Wednesday, May 9, 2012

Daily Wrap

As you know, it's been tough lately to get a clean signal on the market, I've had my suspicions that we would see one final bounce that was AAPL/Tech led. As we have expected, volatility and unpredictability have increased, the unpredictability aspect has grown beyond my wildest expectations with the Greek/EU situation. In any case, these are the charts right now that I'm most interested in as they have the cleanest signal to date and on an important timeframe that usually leads to a significant move.

 The DIA is the only short term 1 min chart I'm featuring as the DIA's underlying trade has been the worst, today it's underlying trade was the best so it seems it's making up for the recent weakness there.

 The rest of the charts are on the 15 min scale and are leading positive like the IWM

 The QQQ which is now leading above the last rally on May 1st

The SPY which is also leading positive 15 min and near the May 1st rally as prices are down significantly from that area. As we have seen so many times before, accumulation tends to occur in to falling prices while distribution occurs in to rising prices. Being all of these charts look nearly identical across 3 different versions of 3C, this is about as strong of  signal as we can reasonably expect. I've made many good calls on signals that weren't this strong.

One of the ways I use to judge market sentiment was by looking at a lot of stock charts and when I found more short setups and no long set ups or vice versa, I had a pretty good idea where the market was going. Applying 3C to that same principle to some important stocks and important sectors (without overwhelming you with charts), take a look and remember, 3C is short for "Compare, compare, compare".

Note how all the different stocks across 3 versions of 3C all look similar, this isn't coincidence.

 AAPL 15 min new leading high (while the longer term I still remain bearish, but as for a good bounce, this chart should lead to one).

 BIDU 5 min-this stock is my biggest gainer of my shorts, yet it's 5 min chart is leading with momentum.

FCX/Copper 15 min is leading to nearly new highs.


 GLD 15 min is leading at new highs

 SLV/silver is leading at new highs

 The flight to safety trade, TLT/Treasuries saw the start of a negative divergence yesterday, today the momentum was much stronger with a huge leading low put in-if there's to be a decent bounce, we'd expect money to move out of TLT

 Energy, while I have recently felt Energy would be a laggard, still is showing good momentum that has hit new highs.

 XLF/Financials 15 min is leading positive

And most importantly (when considering I have felt the last bounce would be led by tech), XLK/Tech's 15 min chart is leading positive at new highs.

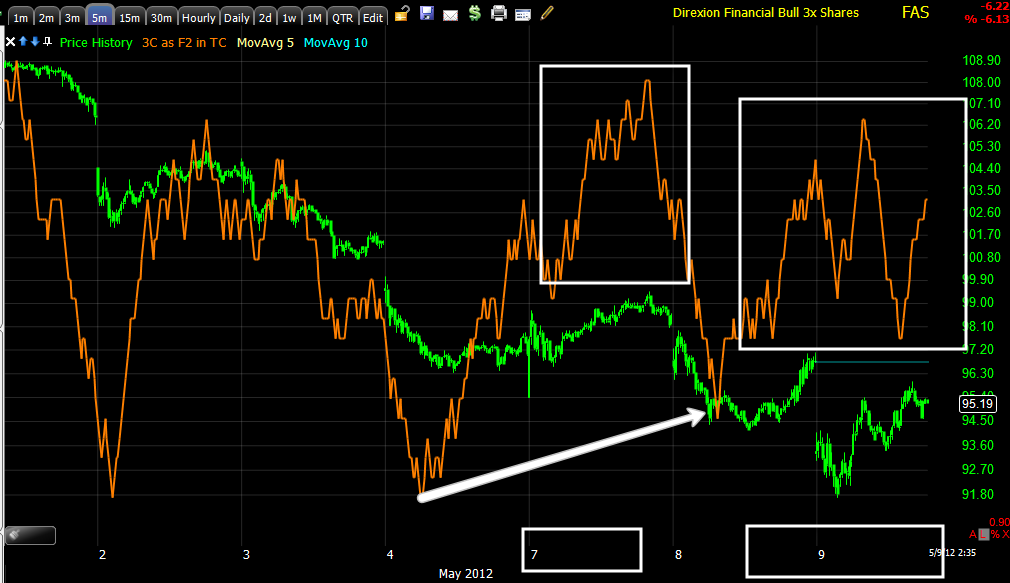
Nearly every one of the risk on assets above held the hammer support from yesterday, they may have shaken out stops intraday, but the close was above yesterday's hammer support.

I could list many more stocks, but the major groups are all covered here and most look nearly exactly the same, 3C doesn't do that on its own, it judges the accumulation/distribution for each stock individually. To see this kind of confirmation among so many different assets classes and industry groups looks very encouraging.

Many of you know that I try to be very patient with my trades, the fact I put on 3 trades alone today should tell you something about how I feel about these signals.

The underlying market is deteriorating and that has been going on for a while, but the entire point of a bounce is another shot to short in to strength. If this market can't bounce with these signals, it is done and over, but I suspect it will bounce.

In sector rotation today, one significant difference I haven't seen in a while is the defensive sectors that have dominated rotation started to fall out today and the risk on sectors started rotating in.

Utilities, Healthcare and Staples all looked choppy today rather than their normal strong/increasing trend. Financials look as if they are rotating in during the afternoon, Discretionary as well, and most significantly Tech is building in.

As I alluded to earlier, I think to get the most bang for the buck, the move will have to happen quickly and catch shorts off guard, for this market to put in a meaningful bounce, there will need to be a short squeeze. Based on the bigger picture I'm content to sit with my shorts although I added a few long positions today to hedge out some risk and hopefully add to the gains, but I intend to use any market strength to fill out my short positions.

I could make a lot of different arguements and show a lot of different charts, but these are the ones that move me and moved me to take action today in some trades. We've had 6 straight days down since the last really clear signal on May 1st when the negative divergences were clear, just as we were able to take advantage of the "Buy the dip" mentality to short in to failed bounces, the psychology is firmly bearish right now and a perfect time to run a short squeeze.. Volume has been up the last two days in many key places and as we have seen so many times before, a volume swell, like we saw in the SPY today with a bullish hammer yesterday and support held today, most often leads to a reversal.

While the EU remains a fundamental wildcard that even Wall Street likely has no edge on (as it is the voter's voices that are moving events there), this is the best bounce set up I've seen in a while and to think just a few days ago the market was very foggy, it seems pretty clear today.

Just don't forget that if we get a bounce here, because of the increased volatility and amplitude, should be a very strong sentiment mover. For this bounce to do its job, it will need to be VERY convincing and it's difficult to short in to a market that may be up huge on the day, but if we get this chance (I feel more confident about it now than at any time over the last several days) try to remember what the big picture looks like and use what may be the last chance we get to short in to strength. Even though we have no evidence of the bounce starting in real price terms, I can tell you with a pretty fair amount of certainty, it will move you emotionally. If it is the kind of bounce that Wall Street uses to manipulate emotions and knock traders out of positions, by the time it is close to ending, you should feel fairly scared to short the market, just remember that is the point of running such a bounce.

If I need to, I'll run all the long term charts and indications to remind you of what this market truly is just under the sheets.


Spain has formerly nationalized Bankia with the traditional boilerplate that the bank wasn't insolvent which means it was, the action itself means it was, but the last thing they want is a bank run.

Meanwhile the powers that be in the EU have decided to pay the next bailout tranche to Greece, but instead of $5.2 bn it will be a billion short, which will be held at least until Monday. I'm not sure how the pieces fit, but I'm pretty sure this has something to do with the letter of memorandum between PASOK and Syriza.

This will be interesting, the EU is paying Greece so Greece can pay EU banks, but if the anti-bailout coalition wins and forms a government, $4.2bn Eruos just went down a black hole, likely never to be seen again except in the already insolvent banking sector in the EU. I suspect the payment being made is more about EU banks than keeping Greece afloat right now.

As I tried to articulate yesterday, this small rather insignificant country, Greece, is likely the end of the EU as we know it.

I wold pay attention to every headline coming out of Greece over the next week.

Finally with the market closed I have some time to look at the risk asset layout and see what credit and other important underlying conditions did today, I'll report back shortly.


FAS / TYH

Here are the chart for both leveraged ETFs. Any use of these ETFs by smart money would likely see strong movement in the mid-term charts, around 15 min as leveraged long ETFs are killers on the downside and in choppy markets, so I would expect any accumulation in them for a bounce type move not to take place over a longer period moving from strong 1, 2 and 5 min charts to the 15 min chart, but rather a much faster positive divergence and much stronger, in other words a faster entry in to them.

I have enough room that I can add to them if I wanted and still not upset my short positioning that much as I still (like the AAPL calls) view these trades as speculative because they run against the big picture perspective.

As an example, take a look at XLF (I could use any long market average though)

Typically accumulation periods/positive divergences would have a more "U" shape. However you may recall on 5/1 when the market bounced up, I expected the reversal to be a "U" shaped one, but much tighter than normal, you can see it on this chart at 5/1.  I would expect the same here, a gradual sloping "U" shape reversal wold not have the same impact on a short squeeze as one that is tighter and more vertical on the upward slope or the second (right) side of the "U". If shorts had too much warning, the squeeze wouldn't be as effective. I can still imagine a pullback, perhaps to the red line area and it wouldn't do much damage to the "U" shape, it could even be deeper, but the start of the bounce would need to be fairly quick, maybe a late day rally or an opening gap.


 FAS 3 min saw a sharp negative divergence on 5/1 as was expected and posted that day before the reversal. The recent 3 min chart shows a couple of ares where positive divergences appear to have taken place, late on May 7th and at the bottom of May 8th and today as the chart is leading positive.

 On a 5 min chart, the same areas are showing likely positive divergences, on the 7th, at the lows yesterday and today.

 Even the 15 min chart identifies roughly the same areas. If it were me accumulating as smart money, the bulk on the 7th would make sense as to have the position started and not give away too much in needing to accumulate quickly yesterday and today in which trade sizes would show up as being larger as well as volume.

 The 30 min chart is interesting because it's a long time frame, but the divergence is very compact and in the same areas pointed out above.

 TNH 1 min is leading positive today as well as on the 7th and yesterday's lows, similar to FAS above.

 The 3 min chart also shows a relatively new and fast positive divergence that is nearly above the May highs.

 The 5 min chart also shows a large leading positive off yesterday's lows, the red area is where I would expect or at least not be surprised to see a pullback, if that happens and the charts are still positive or rather more positive, my position size would allow me to add there.

Agin, the 15 min chart has changed character very quickly with a strong leading positive divergence starting on the 7th.

If Wall Street runs the bounce as I have suspected, they will only accumulate what they think they can offload in to higher prices and won't want to spend any more money than need be to get a bounce moving. They'll depend on a short squeeze to get the momentum moving, thus the positive divergences that I thought I would see, strong 15 min positives that developed quickly  are in place.


Adding Leveraged Bull ETFs to Equity Model Portfolio

Although all of the positions in the equity model portfolio are short and all at a gain, I will be adding FAS (Financial Bull 3x leveraged) and TYH (Technology Bull 3X leveraged). Although the primary positioning in the equity portfolio is short and on any market bounce I'll be looking to add to those shorts, I see the leveraged long ETFs as any easy way to use some leverage and hedge those positions on a potential bounce as the charts are starting to look a lot cleaner than they have been.

these are not long term positions I'm adding, they are only for a bounce and they will not be very big, maybe 1/3rd a normal position size.

I choose Technology because my gut feeling has always been that the last bounce in the market would be tech and AAPL led. I choose FAS (3x leveraged long financials) because as you know I'm very tech heavy in my short positions whic are at a decent gain, I have no financial short positions and I think having a financial long on a potential bounce will make up some gains that I have missed out on not having financial shorts already in place.

Assuming we get the bounce, and I wouldn't be putting on these positions if I didn't think the probabilities were good, I'll close the leveraged longs in the equity MP as well as the AAPL calls in the options MP and add to short positions there (in to price strength). I'll need to add Financial short positions in the equity MP as I'm moving more toward pure equity shorts and less leveraged trades (although these are leveraged, you remember how many I have used in the past during the market chop.


AAPL Options Model Portfolio trade

I went with June $570 AAPL calls, again this is for a bounce only. I am considering adding an equity long position as a short term hedge, I'm not sure if I'll use AAPL or not, I'll probably opt for a leveraged ETF.

I'll let you know if I decide to do that.

Going to Add AAPL Calls

This is a short term (bounce only) position, I'll probably look at June Calls if they are not too expensive, with a strike of $570.

Again, this is a speculative position meaning smaller than normal.

The AAPL Update

 1 min we have a decent trend, leading positive

 2 min , after seeing distribution on the earnings gap up, we are starting to see a much cleaner trend here as well-leading positive


 3 min showing the 23/34th accumulation before earnings, the distribution on the earnings gap up and a clean leading positive trend.

 15 min remains in a leading positive position which has continued to gain.

 a "U shape"?

Remember, ultimately the 60 min is deeply leading negative, I am already short AAPL but would like to add to the equity short on any strength. I'm still holding the May Calls for the expected bounce higher. If I weren't already holding those calls, I would consider buying AAPL calls for a bounce move only. The longer term equity position I want to be short.

Market Update

 Since the update in which I told you the 1 min charts went negative at the QQQ gap fill, the DIA has seen a strong leading positive divergence. The DIA has looked the worst in underlying trade, therefore I think it has the most to make up for.

 The 3 min chart is now forming a trend, something we have been lacking recently and making the market very foggy.

 IWM 1 min went negative as mentioned, it is starting a decent leading positive on the intraday 1 min chart.

 The 3 min is also forming a trend, keep the look of the price trend in mind on these charts.

 QQQ went negative at the gap fill, it is starting a slight positive, based on the other averages, I'd expect it to increase.

 The QQQ 15 min trend has remained positive and keeps growing.

 SPY 1 min also negative at the QQQ gap fill and a positive divergence starting on the pullback-this is what I was looking for if you recall the earlier post.

 The 5 min is forming a trend, keep price action's shape in mind.

A few days ago I showed you a chart like this, I showed how the daily range (volatility has been increasing) and the amplitude of the swings increasing.

"If" we are to see the one last swing up that I have been hoping for, the market trend would suggest it would have significant amplitude and would be a significant move up, there's no reason to run a shakeout move if it is a half measure and in-effective is squeezing shorts and getting bulls on board (even if to only trap them).

Being the move would have to have significant amplitude, there's almost no chance of a "V" shaped reversal, this is why I asked you to note how the 5 min price charts looked like.

A reversal that is strong enough to move high enough to make it worthwhile cannot happen on 1 or 2 days of accumulation and it would need to be "U" shaped.

So the question in my mind is, "Are we seeing that U-shape as the mid-term charts are starting to show a trend?"

"U" shape?


Dr. Copper-FCX Update

 FCX has something similar to a H&S top, although the preceding trend isn't correct for a textbook H&S. In ant case, the market trend has been an important break of support is typically followed by a volatility shakeout, yesterday and today support was broken in FCX.


 As for Copper's ability to predict the market, here's FCX compared to the SPY, you can see they were in line until the market top started forming in March, FCX/Copper dropped badly which is in line with out macro view of the market. The question still remains what the short term direction will be-one more bounce?

 FCX 1 min went positive yesterday and remained in positive position today on the gap down.

 2 min has a decent positive trend going.

 The 3 min is in confirmation

 The 5 min went from a weaker relative positive divergence to a leading positive in the last 2 days.

 The 15 min chart, like many others remains in a leading positive position.

 The 30 min after having gone negative and confirming the move down, has recently gone positive.

The 60 min is in leading positive position.

This wouldn't be a long trade I would favor, if you did take it it must be considered extremely speculative and position size should be small and you'll need to be nimble. The point of the post is the general trend in copper as it recently broke important support, it may give us the typical volatility bounce we commonly see and I can't imagine it could do that without some market support.

Q's fill the gap

The IWM, SPY and DIA fell just short. All of the 1 min charts put in a negative divergence as soon as the QQQ filled today's gap, it's a decent divergence, but I can't say it's a reversal of the move up, it could very well be leading to a consolidation either through price (pullback) or time (a lateral price formation) to get the other averages ready to try to break through the gap, it's too early to say as the only divergence that is complete is the negative 1 min as the Q's filled the gap, there's no positive divergence yet on the pullback.

As to what is going on, at 10:25 the Euro started to rally toward the downtrend line that we have been watching since yesterday, it hasn't reversed, it's has more stalled out short of the resistance area at the downtrend line, this is likely what gave the market some support.

In Europe the markets are closed, as to news...

As expected on the 60% vote in Greece supporting anti-bailout parties or anti-Troika, the Troika has (as was expected) said they may delay the $5.2bn May 10th payment to Greece. Remember Greece has a rather small $400+mm coupon due on International law bonds that were PSI holdouts, if that payment isn't made (and I don't see how Greece can make the payment or if there's any political will from the pro-bailout or anti-bailout parties to make the payment to a PSI holdout), we could see Greece being sued in international courts as soon as the next day. If I recall correctly the payment is due May 15th.

Around the same time the Euro started to rally, news broke that there is a possible memorandum letter that will be signed between the pro-bailout PASOK party (came in 3rd place in the elections) and the anti-bailout party Syriza. No one knows what the letter of memorandum would be. Of course if it were to change any of the terms of the Greek bailout it would knock the market down quickly, if it were to affirm or in any way be seen as pro-establishment, it would likely send the Euro/market surging. No one knows though at this point.

Personally I can't see PASOK cutting a deal with the newly empowered Syriza that didn't give significant concessions to the anti-bailout party. If a second round of elections are held, PASOK would likely loose even more ground and as the second largest party, coming in 3rd place, it would seem to me they may be trying to soften their pro-bailout position (after all, politicians first and foremost want to retain power). I don't get the feeling this will be market positive, but the fact there has been some movement has peaked the market's interest.

GLD Update

Since SLV is my least favorite due to the horrendous amount of manipulation and since we have a fast moving market today, I'll start with GLD and then look at SLV if we have time.

As has been shown recently since the last F_O_M_C meeting, the debate I have been having with myself as to whether gold was acting as a risk on asset or a flight to safety asset as it has moved in both directions, I think it is fairly well settled for now, gold is a QE3 or monetary policy intervention sentiment indicator. If gold is to rally here, I believe that it is most likely looking to the ECB to add liquidity to the market before the F_E_D. The F_E_D has some hurdles to overcome before a QE3 like program can be initiated, the least of which would be their political independence in an election year. So if anyone is going to print and gold is reacting to that, it would seem the most immediate probability of central bank liquidity injections (other than a globally coordinated one like we saw last November, would be the ECB as European banks face a huge capital short fall and any default in Greece or if Greece were to walk out on the Euro-zone, would cause the EU banks huge losses and I don't think the ECB's LTRO 1& 2 were nearly enough to give the banks enough of a buffer as evidenced today by Spain looking to nationalize one of their banks and most likely inject liquidity in to the others.

There are other factors as well, not the least of which is India's recent policy adjustment dropping the gold tax.

As to my long term opinion of gold, as you know I have been of the opinion it is either in a primary or intermediate top.

 The long term 5 day chart sees GLD/gold go from a steady uptrend to a very parabolic move at the yellow arrow to a large triangle which is usually a sign of a top in this situation.

 GLD broke below the triangle and too out numerous other support areas such as the long held 150 day moving average and 200 day, the yellow trendline is where we expected an upside head fake move, which came a few days later, this was the 3 day GLD put trade (shorting GLD) that made 215% in 3 days. The head fake worked beautifully.

 Recently GLD has left several large gaps open, while commodities haven't shown the same degree of gap filling as equities have, the larger trend has been to fill gaps, there are quite a few and if the ECB is expected to loosen policy, GLD may be reacting as a sentiment indicator looking for ECB action or globally coordinated action which would give the f-e-d some political cover.

 Since going negative (there was a head fake move in the yellow box), the 1 min trend has been solid.

 The 5 min has been positive over the last 3 days.

 The 15 min has shown several positive divergences, GLD would probably have to fill all the gaps to make this worthwhile, but again, it is largely motivated my sentiment toward easing. If the ECB were to rule out easing, gold could be stopped dead in its tracks.

Here's the 30 min trend, from distribution which took on a leading negative divergence at the top to a relative positive divergence then a leading positive.

I think GLD has a chance here, but the larger implication may be for the market and it seems to be sentiment oriented, with the market looking for Central Bank easing/printing. I don't think the f-e-d has the cover to do it alone, but if there were to be an ECB/F_E_D action (the PBoC joined in as well last November), that would be more doable.