Thursday, April 25, 2013

AAPL Calls P/L

Earlier this afternoon I closed the AAPL Calls out of, "An abundance of caution".


I had to take a small loss of -0.004% on this, but I'd rather do that than take a large loss, I celebrate small losses, they are small problems that were crushed early before they became big problems.


GS

Well you can't get everything, but yesterday afternoon the charts deteriorated, it looked like something ugly was coming, today despite a nice head fake move up, those charts still stayed ugly so, TODAY WAS A GIFT, days like today give us an opportunity to enter a position at an excellent price, low risk and very good timing, they are hard to enter as the market is going the opposite way, but you just have to trust the charts over your emotions.

In any case, GS was one I wanted to add to as a core equity short and these two charts are reason why I think we still are likely to have more upside before we get the break I'm looking for, although this one is getting uglier and uglier, I think assets like HY Credit will fall completely apart before the market does and that hasn't happened yet, but what this could be is the very typical, increased unpredictability and volatility.

Back to GS...

 Note the head fake move to a new high above resistance right before GS reversed to the downside, I explain why this is so common in the two articles linked at the top right side of the member's site. In any case, the 15 min negative here is clear and I could have done something with GS as a trade I'm sure, but as a core short...

This 4 hour chart still shows a significant accumulation period suggesting GS has more upside to go before all the shares are distributed.

We'll be able to tell soon if there's accumulation in to the downside move or not.

Going Long FAZ (Financial Bear 3x) ETF

I would have preferred an options position, but the momentum right now in Financials to the downside makes premiums very expensive, however the ETF, FAZ, which still has 3x leverage is up (and I hate to chase),  but still below yesterday's close.

Position size will be just a bit bigger than a spec position

UVXY Follow Up

Earlier today I put out a long position on UVXY, that position is now in the green.

The improvement in the 3C charts is so obvious, the charts need no annotation, if you can't recognize these positive 3C divergences, email me and I'll help you better understand the principal so you can apply it to other indicators and understand just how important charts like these are.

Being that VXX / UVXY trade nearly the mirror opposite of the SPX/SPY, the divergences should be nearly the mirror opposite too.

Here are the UVXY positive divergences, many made extreme moves to the upside today.

1 min

2 min

3 min

10 min

Even 30 min.

AMZN Earnings and Quick Update

I was asked about AMZN earnings and whether there may be a leak, honestly I'd have to do a lot of analysis between AMZN and the market, the Industry group peers and sub-industry group peers.

AMZN in general looks better on the 3C charts than I'd expect given the overall market tone the last few days.

As far as my personal plan, it is as I have posted before, to try to add to an existing partial AMZN short position to bring it to full size, I want the trade to come to me and my definition of that is AMZN trading at least above the flag-like consolidation zone since January (which is way too big to be a true flag) and price above at minimum $278. Ultimately, I'd like to see AMZN above $285 with negative divergences in to that move. I Would consider above $278-$280 "IF" the 3C charts were absolutely stellar in their negative divergences.

As far as a leak, I don't see it off hand, but AMZN does look more positive on 3C than I'd expect to see.

NFLX Question

I just had an email question as to whether I think it's too late to enter NFLX Puts or a short equity position, a short equity position won't make as much, but it is a better entry. I would still take the Put position on NFLX even right here.

Closing AAPL $390 Call Out of an Abundance of Caution

Leading Indicators

I don't have time to show you everything in Leading Indicators, but here are several that made a difference.

 High Yield Credit was not keeping pace with the SPX in the afternoon session.

FCT is a good measure of sentiment or Risk Appetite since its not directly correlated (as a manipulative asset) and it has been risk off since about the same time we started seeing negatives in the averages yesterday.

Yields was one to watch, this slight dislocation at the far right was very important as to whether the SPX was frothy/toppy.

Even on a longer term scale you can see how today's Yields mattered.

High Yield Corporate Credit was another that was just starting to disconnect with the SPX, much like Yields.

 Long term HYG still remains supportive, this is another reason I think we see a little more upside after a correction.

Here TLT should have been making lower lows as the SPX made higher highs, this is the exact same behavior we saw before the last 3+% correction in a few days.

Volatility/ VIX Futures (VXX) just like last time are doing the exact same thing (same as TLT above), they should be moving lower, but an apparent bid for protection because of fear is showing REAL ORGANIC demand, holding prices from going lower as the normal correlation would suggest.

 Another look at VXX vs. SPY

VXX 1 min was also starting to see improvement after being in line all day

The 10 min chart continues to show the same length positive divergence as we see in the market averages that trade opposite VXX with their negative divergences.

Currencies...
Intraday the $AUD is generally supportive of the market, although it has been fading a bit since noon time. The Euro had a sharp fall in to 10:15, although it is negatively dislocated from the SPX intraday (as well as longer term), it is trying to move in the same manner as the SPX. The $USD has fallen off pretty significantly since yesterday morning, I suspect this is behind not only the market's intraday performance, but GLD and SLV too. Right now the $USD continues to fall off just about in the same area as the SPX moving up; there's obviously some correlation/influence there at work. The Yen doesn't seem to be an issue.

GLD & SLV P/L & Charts


The SLV 22 Calls from yesterday yielded a gain of +95% for a day.


The GLD May 10 $130 Calls yielded a gain of 93%

As for the charts, my belief is we have much more upside to go, but that it's also probable to re-enter these positions at a lower cost basis than what they were just sold for, adding additional profit.

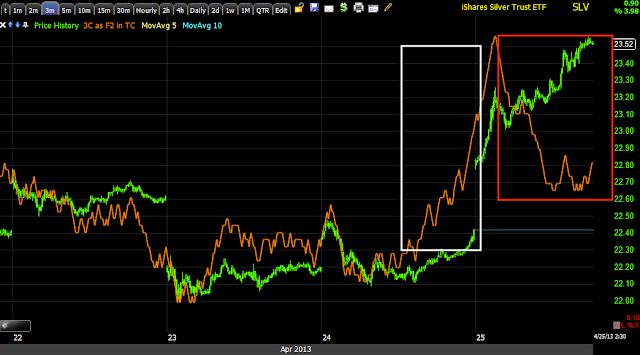
 SLV intraday was losing momentum.

The 1 min chart was a little less than in line, but then shifted to a more negative position just before it went lateral and then started a decline.

SLV 2 min with the positive that was one of the charts that convinced me to enter and a negative making me think we get at least a gap fill.

 SLV 3 min also positive yesterday, a good entry signal and a negative today, a decent short term exit signal, it looks like we sold right at the high of the day.

SLV 5 min is negative, but not that bad so I think we can re-open the position at a better cost basis on a pullback as long as there's 3C accumulation.


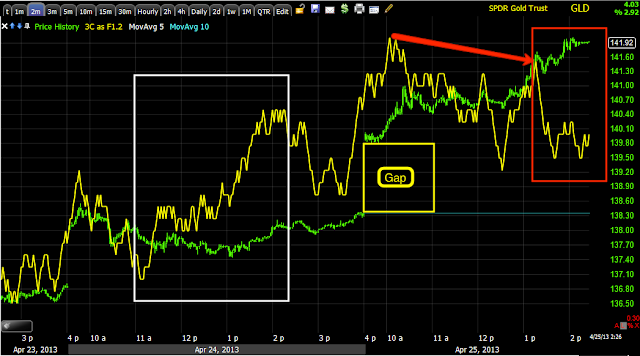
 GLD intraday was losing momentum...

2 min intraday 3C was negative

The 5 min is similar to SLV, we have the same gap.

I know a lot of you did very well, I hope many more did just as well.

Closing Remaining May 10 SLV $22 Calls and Half of GLD May 10 $130 calls

I hope to pick them back up on a pullback or gap fill, there are negative divergences that make me think that is likely.

The AGQ 2x silver long ETF will stay open.

Update

Moving along to treasuries, yesterday I said the negative divergence (short term) in TLT was so developed that there was no way in my view TLT wouldn't see some downside, it did today, however...

I just found the EXACT same behavior in TLT as reported in the VIX, this is the same as last time before a sharp correction and even on the same day, a Thursday before a weekly op-ex Friday with the sharp correction on Monday.

Quick Update

As I'm going through Leading Indicators and other assets, I found the exact same thing I found in the VIX Futures/ VXX (I know about the CBOE, but this has been going on since before today) on April 12th

TLT and VXX- REAL ORGANIC DEMAND- REAL SUPPLY and DEMAND, FEAR and GREED?

In fact I found the VXX anomaly the day before on the 11th (Thursday), then on the 12th the VIX continued and TLT joined, that was a op-ex Friday. The following Monday looked like this...

The red arrow is April 12, the next day is a Monday and a big move down of -2.3%

I can't say that the mid-term negative divergence charts posted last night couldn't be capable of the same type of move, while not VERY highly likely at this point, who knows what it looks like at the end of the day or even tomorrow, but as it sits now, it could produce a pullback as sharp as the one above.

It's the EXACT same behavior first noticed in VXX (VIX Futures).

Market Update

It's a pretty crazy market today, the CBOE offline/online/???

In any case, intraday charts shaped up, however the charts that were there from yesterday are still there. I still think it is most likely we will see that pullback / correction.

Here's the SPY and some futures
 ES 1 min intraday is in line

TF 1 min (R2K futures) don't look so good on the same timeframe

SPY 1 min from the earlier leading negative to a relative positive, but still in negative overall position.

This is really where most of the change is.

2 min SPY is not showing much strength at all, the opposite in fact.

As is the 3 min SPY, leading negative

the 15 min chart is where I would cap any pullback activity and think that any correction could only be short term (day/s) in nature as the accumulation period above is quite a bit bigger than the distribution period, this is why I think after any correction, the market has more upside before the reversal I'm looking for.

I'm checking Leading Indicators now.

SLV P/L & Charts

Here's the P/L for the SLV May 10th/$22 Calls we opened yesterday


At the fill, the P/L on the position for 1 day is 65+%

That keeps our Options Tracking Portfolio kicking some butt as we are on the right side of the trade, entering when others are selling and selling when others are buying.


SLV Updated Charts...

 It's the short term charts that caused me to take partial profits, leaving some exposure in case this move goes parabolic, but taking some extensive profits for a 1-day trade, off the table and hopefully adding the position back at better prices on a minor correction.

2 min chart also leading negative intraday

And 3 min so the divergence is migrating through longer timeframes, whereas earlier it was perfectly in line with price.

10 min SLV shows the leading positive divergence, why I like SLV longer term and why I left the AGQ long position open as the draw-down there will be much less of a concern than in calls.

The 15 min chart with a head fake move right before the reversal as usual and a leading negative divergence before the collapse, smart money was pouring out of SLV before the collapse. The leading positive now on a 15 min chart is beautiful, again, this is why I like SLV and this is my LEAST FAVORITE ASSET in the entire market to trade.

Closing Half of SLV Calls

These are yesterday's May 10th $22 Calls, I'm closing half because of intraday negative divergences, hoping to pick up that half at better prices, but I want to keep some exposure for a possible afternoon move.

The long AGQ (2x long Silver ETF) will stay open.

Long UVXY @ $6.28

Well I had to put an equity long (UVXY) in the Options Tracking portfolio as that was the only place with room, but it's an open position.


Long VIX Futures, VXX / UVXY (Short XIV)

Obviously these are trade ideas and it's probably not wise to take every one of them (position sizing, correlated risk, etc.), but I still want to provide them.

I'm not sure if I'll have room, but for a short term market reversal to the downside either VXX (Long VIX Futures) ETF or the leveraged version of that, UVXY will both work; I prefer to be long UVXY.

If you prefer shorting something, XIV is the inverse of VXX/UVXY and moves largely with the market so if you wanted to short, that would be the short.


Here are the charts for all 3, all 3 have confirmation.

 VXX 10 min chart (about the right timeframe for the market averages' negative divergence/pullback timeframe) is leading positive.

The 1  and 2 min charts are in line so they aren't giving specifics on intraday timing, but I personally have no problem going long VXX/UVXY right here.

The leveraged UVXY 10 min chart leading positive confirming VXX.

The inverse XIV 10 min chart leading negative, confirming VXX/UVXY.

And again XIV confirming intraday charts are perfectly in line.

The only timing help intraday will be from momentum indicators such as these below (momentum, RSI, MACD, Stochastics) showing positive divergences which most are, you'll want to check multiple timeframes, but I really think we are close.


Remember leverage cuts both ways so make sure to use risk management and position sizing and consider UVXY is leveraged.