Thursday, April 18, 2013

Furthermore...

I wouldn't cite these if I wasn't sure that they correlate very well to our own leading indicators.

In addition, there was this amazing demonstration of how accurate the modeling actually is, I had never seen a CONTEXT/ES differential this large, never!

"
"The CONTEXT model for ES is at an astounding 45 point negative differential!!! I HAVE NEVER EVEN HEARD OF SUCH A THING!"

Just so you know why we use CONTEXT, let me put it in context. Friday's ES 4 pm close was $1582.50, the low today was $1538.75, the differential above was 45 points, the drop from Friday's 4 pm close was 43.75 points!


Tonight...

And CONTEXT at a +20 differential

EUR/USD

I was just thinking about how clear the currency divergences were for Tuesday and Wednesday and how muddy they were last night, in fact I had expected a break on the SPY and we got that exact break nearly to the cent, I was looking for a move below $153.59 in the SPY and the low was $153.55, as soon as it took out that area I mentioned (in last night's post right after the close, "Positions"), the market headed higher from there. Last night I had looked at the currencies and thought it was probable that the scenario I described in the post linked above would occur, I didn't imagine it would hit the area by 4 CENTS!

In any case, in looking at the currencies tonight, the $USD and Euro especially, I thought, 'With these looking the way they do, the EUR/USD should at least have a positive divergence" which would be risk/market positive, so I looked and found this just moments ago...
That's a pretty incredibly large leading positive divergence in this risk on pair. I look forward to checking it later tonight and seeing how it has developed.

GOOG Charts, Interesting

There's one area that's pretty interesting, whether part of a counter trend bounce or something else, I'm not sure, but I'm sure you'll find it interesting too.

 This is always a sign of trouble when volume falls in to an advance.

 Daily chart shows a leading negative divergence at the top, but there was trouble long before that.

 The 4 hour chart shows distribution in the same area as the daily.

 The 2 hour chart shows the same distribution, but this is the first of many charts that shows an area in the decline that has had some very strong divergences through, I pulled the white box over price at the positive divergence to highlight the area as you'll see it over and over again.

 On a 60 min chart there's a positive in the same area.

 The 30 min chart is positive in the exact same area.

 The 15 min chart has a very active positive divergence in the exact same area.

 Here it is on a 10-min chart.

 The 5 min chart isn't quite long enough to catch all of it, but a very strong leading positive divergence.

 3 min shows several smaller divergences and what looks to be a possible head fake/stop out area in yellow today.

 The 2 min chart  with a strong leading positive and the same area today that looks like a stop run.

 And the same on an intraday 1 min chart.

The Trend Channel has held a couple of decent trends in GOOG, but notice the 6 day ATR, it should rise as it does at the green arrow in to a rising trend, at the orange box we have price pretty significantly outside the channel (Channel Buster) with reversal candlestick setups, then the trend break shortly after, it's usually the same thing before a reversal, volatility increases to the upside and longs get excited, but that's usually a good sign things are about to change. On the second trend up, the ATR drops as the trend is rising, this isn't a good sign and GOOG stops out just after.

In after hours it looks like GOOG beat on earnings and just missed on revenue ($11.58 EPS vs consensus of $10.70 on revenue of $14 billion  vs. consensus of $14.3 billion). What really matters is guidance which should come at the conference call starting right now (5 p.m.).


GOOG May 3rd $760 Call

This is about what I mentioned.

I'm going to go ahead with a small GOOG Call position, in the money and expiration May 3rd

Quick GOOG Update

GOOG has earnings today after the bell,  I checked to see if there's a leak, we did catch one before in GOOG, this MIGHT be a leak, either way, I expect GOOG to perform well in the coming days as early as tomorrow is not at all out of the question.

We know there's a leak when we see something very unexpected, being I expect GOOG to move with the market, this isn't unexpected, but perhaps to the degree GOOG is positive and some of the timeframes that are pretty far out. I'll post the charts, but it will be after the close.

I'd say GOOG will perform well as early as tomorrow, I never pay attention to after hours earnings action as it often is very different the next day.

Leading Indicators.


Short and sweet...

 When commodities are acting this well vs the SPX, something is up, considering the stop level in the SPX talked about first thing after the close yesterday, I almost stopped when I saw this chart as it pretty much provided the answer I suspected.

 High Yield Credit didn't make a new low today, instead made a higher low...

 High Yield Corp. Credit (this is really the important one) is still in leading positive position, plus it held and didn't follow the SPX, in fact it's pretty far from its intraday low.

 High Yield Junk is acting almost exactly the same as HYG above.

 This also raised my eyebrows, although I expected to see it with the theory I had, it's still pretty wild to
see the SPX making a move like that with Yields rising (this is positive for the market as a leading indicator).

 The Euro, as bad as it was acting is still acting better than the SPX, so it too is supportive and makes the SPY move look like the stop run discussed yesterday.

 The $USD should be higher at the SPX lower low, it's not as the $USDX divergence suggested, the $USD would halt. The divergence is now negative so it looks like the $USD will head down (market supportive), but only after the SPY took out that level.

Not surprisingly, the Euro is also going positive at the same time (market positive). Both currencies basically made the small move they needed to made to push the SPX to 6.5 week lows.

 TLT(Treasuries-flight to safety trade) should be at new highs here, but as you saw with yields, it's no surprise that it's not.

And after seeing all of that, I had an idea what I would see next....
 The CONTEXT ES model is moving up and now @ over a 16 point positive differential over ES.

SPY Arb is moving up as well, but that was a given after seeing TLT.


I'd say stop run

That's what I figured yesterday, if I was running things, the SPY just took it out with the support at $153.59 and the SPY hitting an intraday low of $153.55 and now looks like this...
Leading indicators confirm, stop run....

I'll post those next

Update

The IWM, QQQ and DIA all look either close to stabilizing or there, the SPY is the one that looks like it wants to move down a bit more intraday and I would guess this might be why..
The 50-day is one obvious target, but the 6.5 weeks of longs is only a few percent away (less than -1% from yesterday's close), that's at the trend line.

Checking leading indicators now.

Update

Sorry, I'm trying to figure out what these currencies were going to do while the VM (virtual machine with half my programs was locked and on the phone with customer support, that's resetting, here's what I have on the market (futures) which are moving from currencies, but there seems to be a floor.

 ES longer term 15 min so I'm pretty sure this is the stop run I was talking about yesterday and today.


 NQ NASDAQ futures 1 min positive, again looks like a stop run

NQ 5 min positive, again looks like a stop run

 This was the positive divergence in $USD I was trying to figure out if it was going to fire, it did, but was already negative as it started, thus the issue.

 This is the Euro 1 min negative-obviously both are effecting the market...

 The Euro 5 min is positive.

The EUR/USD pair is really the asset that we're trying to figure out, it was very negative at the highs, it dropping is pulling the market lower, but it's building positives already so again, I think stop run, but my other programs are coming on line now. I'll verify.

AAPL Charts

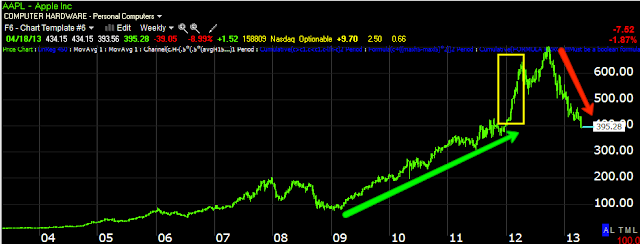
Here's the deal, I have long suspected that something bigger was going on in AAPL, the stock has seen a 300+ point drop and a loss of nearly half, - 44% over a 7 month period.

Look at a 5-day chart of AAPL and tell me which emotion that moves the market is stronger, Fear or Greed?

 In AAPL's case, Fear and Greed were nearly equal, but this was an extreme case. It took 9 months to add on those last 300 points, but as I always warn, "Changes in character lead to changes in trends" and extreme upside volatility is almost ALWAYS seen right before a top forms so when you are riding a nice trend like UNG soon and in several years it breaks away from its trend to the upside, be happy for the gains, but know that the multi-decade party is coming to an end. Those same 300 points added in 9 months were stripped away in 7 months with virtually no break in the selling-Dan Loeb's Third Point Fund sure is influential!

 The 1 min intraday chart, note the positive divergences and the lower price today from yesterday's divergence is a mere drop in the bucket when you consider the bigger picture, it's nothing.

However what do we have at the first two positive divergences yesterday that smart money filling big orders needs? Yep.  If you answered "Supply" as the two positive divergences yesterday were both at the stop runs, you get the gold star. Today we have a more typical accumulation period of quiet in a tight range, I always say that, "Quiet markets are dangerous markets if you let your guard down, they are often like the kids in the room next door a little too quiet". 


 2 min chart shows the negative divergence at the EOD highs on the 16th and the stop move just before 1 pm yesterday is the start of a stronger leading positive divergence, today a nice tight range that allows market makers to fill institutional orders right at VWAP.

 The 5 min chart, leading negative on 15th at the EOD.

 15 min is one of my favorite timeframes, in markets that aren't extreme like this one, it's a great swing trade timeframe. Look at the leading negative last week and an equal leading positive this week.

 Here's where it gets interesting because I have seen this, but I just haven't figured out the angle to make it a trade, there's a longer term divergence in play here on the 15 min chart if you zoom out. The white blocks are where the accumulation zones would be (primarily).

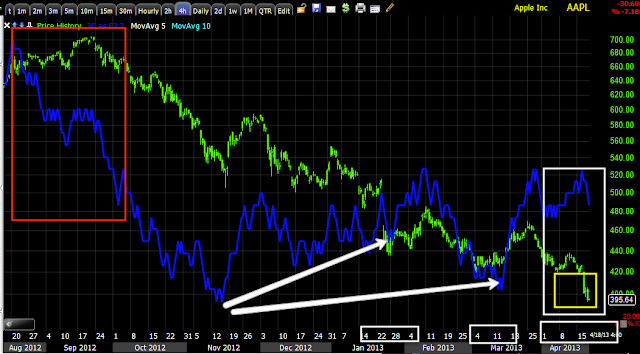
 Now the 4 hour chart, just extreme selling, this is one of those times when Wall St. lost control and all funds tried to sell at the same time, too many big boys and girls trying to fit through the same small door at once and what started this? AAPL as a top 5 holding in Dan Loeb's Third Point Fund one week and then it missing from the top 5 the next week, all hedgies moved at once.

Smart money is a lot like dumb money in the herding mentality, if your fund underperforms the S&P by 15% it is not a problem just as long as 90% of funds underperformed by 15%. If you are a fund manager and making several million a year or a LOT more, you are concerned with keeping your job, not striking out on your own to try to stand out from the crowd because if you miss and standout from the crowd as an under-performer, there goes your job.

Intraday momentum is increasing, the momentum indicator on the top, RSI, MACD and even Stochastics

Futures

That positive divergence from earlier is even stronger, we are seeing some gains.

I'll be positing more ideas.

AAPL May 18th $390 AAPL CALLS

And boy are they expensive.

Truthfully, since I like to get out of a position before the first sign of a pullback, an earlier strike would work, but the percentage gain is the percentage gain whether you have 1 contract  in May or 2 in April (it's not quite that simple with options), but 1 share of AAPL moving +10% is just as good as a  100 shares of a $3.95 stock moving 10%.

Adding to AAPL, but changing the Call

I'm going to go with the May Monthly (17th /18th expiration) with a strike at $390, most likely (in the money in any case).

I'll post some longer term charts and show you why I've decided to go with longer term CALLS here.

May Increase the AAPL Call Position from yesterday

You may recall it was speculative size  for this very reason...

" I'll leave a little room to add just in case we get a pullback"

I like the 3C charts in AAPL, the bad news came out yesterday and should be priced in, today it has continued high ROC (lower volatility) base-like structure, kind of an extreme inverse H&S or deep "U".

I'll post some charts soon and let you know before I do anything.

Gold / GLD charts

Here's a plethora or virtual cornucopia (That may be a tiny bit of hyperbole, I'd make a good politician though) of 3C GLD and YG (Gold E-mini futures) as well as the $USD (which typically trades opposite of precious metals-or at least it did before the F_E_D turned everything on its head).

I do NOT like analyzing or trading Gold/GLD or Silver/SLV because they are so heavily manipulated and unpredictable, look at last week's move- a 30 some odd year decline! In any case, 3C wasn't giving a long signal so that's not a problem.

The point is, for me to open positions in either of these, I have to be feeling pretty darn confident in something I see.

 GLD 5 min with the negative just before the fall, we also had a very nice trade (long leveraged gold April 4th, sold April 9th-bought at the very lows/sold at the very highs) and a current positive leading divergence.

 10 min with clear leading negative divergences and a very clear leading positive

 15 min (one of my favorite timeframes) with a strong leading positive and it has put in the time, it didn't just dead cat bounce.

 30 min with a VERY clear distribution trend and now a relative and leading positive divergence (that's often the order they form in).

Gold Futures...
 30 min leading positive and large volume at the end of the decline looks like short term capitulation, I'll cover the primary trend in gold which seems to be in a bear market, of this is a very sharp bounce/counter trend rally, we'll have even better evidence of a bear market which I suspected started back in 2011.

This is the 30 min chart of the $USDX (US Dollar Index) which has been pulling back from a primary trend base and it looks like it will make one more move lower at least before reversing back to the primary trend which should benefit stocks and gold, at least until the primary trend continues, then watch out below in stocks and probably gold.