Thursday, January 2, 2014

Daily Wrap

Despite the first day of the new year being one of the better performing days historically, we took the signals Tuesday (despite the EOD ramp job) and went with it and were rewarded this morning as Asian futures were down handily last night, I had little doubt we'd see the same in the US.

Today we had some intraday divergences, positive, but this isn't of any concern, I just hedged the trading portfolio with AAPL and DGLD rather than close anything as I don't feel it's wise to run against the major signals right now.

I also opened a couple of calls, most of you know I use options as a tool, not a trading methodology, the right tool for the job and in this case, my concern is that any longs are going to be short lived in duration so the leverage of options makes the trade worthwhile on the profit front.

Today was the largest first trading day of the new year since that nasty year remembered as 2008 when it all just seemed to fall right in to.... the gutter.

Even though intraday charts were moving toward what looks to be either a little more lateral (process) or a move higher, maybe to fill the gap, maybe something else, the distribution today which has some momentum from earlier in the week really stood out, thus the reason I didn't want to close any trading shorts.

To give you a feel of the true underlying trend...
 This is the SPY 15 min chart from the Oct 9th cycle lows (there was about two weeks of accumulation before 10/9 and the low of 10/9 formed a small island bottom as well as a head fake to the downside before moving higher). There's distribution in to late November/early December and then a very small accumulation patch and what I consider a head fake move above the range from November, remember a head fake move is proportionate with the preceding trend and the bigger it is, the more effective it is.

In yellow, we see a leading negative divegrence from late last week/early this week, it's 3 days (yellow), the leading negative divergence in ornage, that's all today alone!

Take a look at the same divergence without all of the scribble on the charts and remember the deeper, single divergence is today alone on a 15 min chart!

 That's a new leading negative low that stretches back at least 4 months.

On a 30 min chart looking at the same period/cycle we see the same divergences, except the yellow leading negative is 4-days and the second part of it is today alone, it's rare for a chart as long as 30 minutes (even 15 minutes) to lead so much in one day.

Again, look at the 30 min without all the scribble...
That new leading low in a singular line is TODAY alone. You can see that there was serious distribution in to Tuesday's EOD ramp job, so as I often say, "Price is misleading", you have to be careful of how much weight you give it. You can't judge the market by price alone, we look for as many pieces of the puzzle as we can. 

While we can see a move up a half a percent and feel, "When is this ever going to break", I've seen the market take out several months of longs on an a.m. gap and there's nothing they can do about it.

As for Index futures, there's information there too.

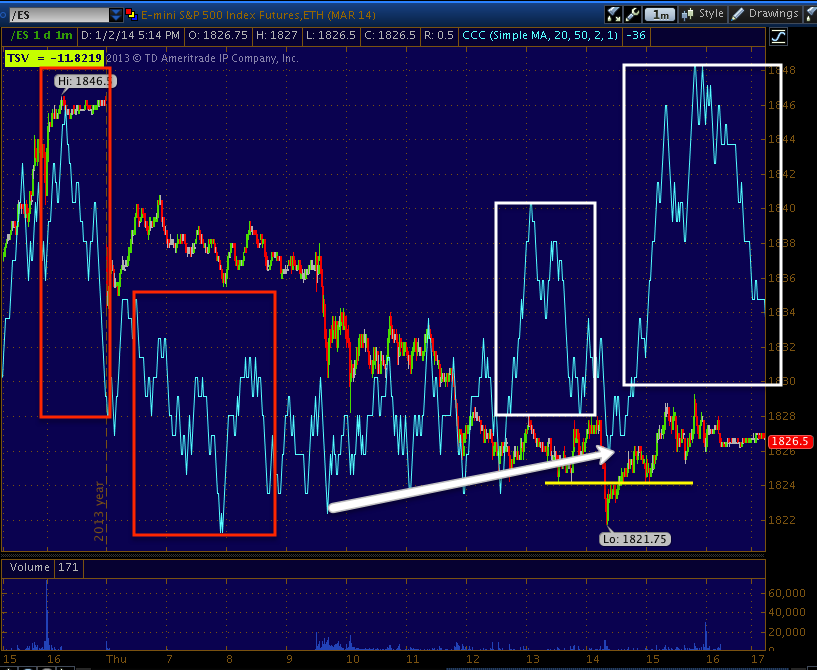
 ES/SPX futures, intraday/1min showing distribution late Tuesday in to the close and the same this morning, you'll see when VWAP is applied as well. Later in the day some light, "Steering" accumulation. Note the head fake move below the yellow trnedline, I'm telling you, these are great timing markers because we see some form of a head fake move in about 80% of all reversals, it doesn't matter the time frame, but as mentioned above, they are proportional so you can get a feel for what we are looking at, 


 The stronger and much more important 5 min ES chart shows strong (considering the volume) distribution Tuesday afternoon, thus I'm perfectly happy with the decision to add to shorts and to close the AAPL hedging long. Note the increased distribution in to the EOD ramp job. Like I often say, price can do anything over the next day, a holiday or the weekend, but 3C most often picks up right where it left off and in this case it left off with distribution in to the close which led to a gap down, not a move higher in price.

Otherwise, 3C is in line or trend confirmation.

/TF, the Russell 2000 Futures on a 1 min intraday chart show the same distribution late Tuesday, then accumulation today (note that it's in a flat range and again there's a head fake move).

 Looking at a longer chart, as I said earlier this week, it's not as common for Futures to see long term divergence migration, but here we have a 60 min leading negative in the one average that should lead the market in any risk on move.

AGAIN, note the smaller accumulation and HEAD FAKE move toward the left before price made a move higher, then a large relative negative divegrence and a large leading negative divegrence which is once again, characteristically in a flat trading range, THIS IS WHY I WARN TO BE ALERT DURING DULL MARKETS LIKE THIS RANGE, IT'S OFTEN WHERE THE MOST ACTION IS OCCURRING.

Like the SPY, we have another leading negative divegrence striking a new low. this is the kind of detective work I'm talking about when warning against basing opinions, trades and emotions which are the root of everything, on price alone. I just showed you completely different markets showing the same exact signals, that's called probabilities and that's the best you'll ever get in trading without breaking the law.


Here's the intraday ES/VWAP (Volume Weighted Average Price). VWAP is an institutional tool that market makers and specialists use or have their fill for an institution or fund essentially graded, if they fill a buy at VWAP or below, they'll likely bet more business, if they fill a sell or short sale at VWAP or above, they are likely to get more business.

I marked "S" for areas of selling and "A" for areas of accumulation as seen above in both the ES and TF 1 min charts.

And the catalyst, I doubt you'll here it on CNBC (feel free to email me and tell me why they are saying the market was down today), as I have been talking about a lot, "Watch the Yen, Watch the Carry Trades"

 5 min accumulation sends the Yen higher, but there have been larger positives in play, we saw them last week and then we heard from BOFA that they covered or closed out their USD/JPY carry trade, apparently one of the reasons we saw accumulation in the Yen. This shorter term accumulation sent the Yen higher as carry trades were likely closed, as far as the short term intraday positives we say, it may VERY well have to do with a loss of momentum in the Yen's upside and a negative intraday divegrence, but this is temporary unless the BOJ intervenes, watch USD/JPY $100 for BOJ intervention.

 The much more serious 30 min Yen futures has a large leading positive divegrence, note once again the "W" reversal process to the far right before the Yen gained and right before the move, the head fake move hitting stops.

 The result saw the carry cross of choice heading nearly parabolically vertically down, this can be another reason for the short term positives as parabolic moves (think about our trade/short in TWTR that we covered on the 30th, that entire trade was based on the parabolic effect.

 The USD/JPY also lost ground, a move below $100 is where the BOJ gets upset and may try to take action to halt the rise of the Yen.

This shows EUR/JPY in red/green candlesticks and ES in purple, you can see that the carry pair still has a correlation, albeit negative this time and ES actually underperformed even the carry pair today.

 Here we see that accumulation in VIX futures even though earlier this week and last week they pinned VXX with small steering distribution to keep the market from falling on Quad witching, Window Dressing and apparently End of Year gains.

Note the congestion today taken with the small positive divergences in the averages, that makes the move we prepared for today more likely.

 Spot VIX and its Bollinger Band Squeeze look to be VERY much still in play. As suspected, the Hammer which is a candlestick denoting support or an upside reversal, that held at the lower Bollinger Band has seen a move higher as the demand for the protection of VIX futures ran counter to the market correlation, I mentioned early this week that it's unusual for there to be a reach for protection as Window Dressing was over and there were only a couple hours left in the year, why would anyone need to hedge their longs for the end of year? Well I don't think that is what it was.

On a short term basis, Tuesday's candle, even though it was stronger than the correlation by closing higher, did leave a long upper wick which shows some resistance and today the candle formed a star which is a loss of short term momentum so a slight pullback here would make sense with what we saw in the averages and Index futures as well as VIX futures, but over the bigger picture, I think we'll see the VIX shoot vertically higher as the market moves in the opposite direction, just go back and look at the SPY 15/30 min charts and Index futures 60 min charts.

Early today the benchmark 10-year yield (not the bond above) was over the 3% line in the sand, this causes mortgage rates, car loans and many other interest rates move higher.

You may recall early this week and late last week it was my opinion that in the short term, we'd see treasuries move higher and yields lower, the 10-year closed below 3% today as the 10 and 30 both rallied higher as you can see, but the 3C divergence doesn't look good for continued upside strength.

There are longer term positives in both the 10 and 30 year treasuries, but I think charts like this 15 min negative are migrating out to longer timeframes which means it is likely that we hit 3+% and it becomes a problem for housing/mortgages and other rates, but we were right on in calling a bounce in treasuries which lowered the yield much to the F_E_D's relief I imagine.

As for Leading Indicators...
 This is HYG (High Yield Corp. Credit, an arbitrage asset) seeing a strong move higher at the EOD, which fits perfectly with our observations and positions opened today.

This is the 3C chart, it's in line, but not much more.

And the long term HYG chart leading negative and especially recently breaking away from the SPX.

Intraday High Yield Credit also makes perfect sense with what we saw and prepared for, THIS IS WHY I SAID I LIKED THE VISIBILITY IN THE MARKET TODAY.

However on a slightly longer timeframe, it's clear HY Credit is not taking the bait.

Long term like HYG, Credit has been selling off all year, where credit goes, equities will follow.

 Our professional sentiment indicator intraday also went positive, expecting the same short term move we are.

However long term, there's no doubt where sentiment stands.

I'm not sure if HYG is being used as an arbitrage asset for tomorrow as VXX is right in line with the SPX which has price inverted on this chart to better judge the correlation. However as seen above, VIX futures look a little sloppy and range bound so we may see some deterioration short term in VXX to activate the arbitrage scheme, the market doesn't have much else as the Yen advances, but recall that the very short term looks like a small pullback there too.

Yields are in line, reversion to the mean so they are not of much help to the SPX.

As far as futures, Asia looks to be in the same trouble as the US. this is the 4 hour Nikkei 225 divergence

Not good news for the Nikkei 225 futures, but again short term...

We see the same distribution late Tuesday and some accumulation today, I'm not sure if it's enough so we may see Asia turn down first.

Remember the China trade we are watching for an entry, FXP/FXI.

Other than that, in futures right now, the Index futures aren't looking great on 1 min charts, but they rarely hold overnight, they just don't look good right now, I do suspect though that this is transitory as we have enough confirmation for a short term move.

The thing is, when things like the carry trade go against you and you are running 100:1 leverage, the market can just run over these divergences that are on intraday charts, if you are seeing your leverage funding going against you, you'll close any longs and close the carry in an effort to save your portfolio which can get out of hand real quick, this causes a snowball, cascading effect which is the reason I hedge trading shorts rather than close them and go long for a short trade, you have to keep those probabilities in mind.

If anything changes later, I'll update again.

Some of you have asked about TWTR, we opened that short at the top and covered on the 30th at the bottom, a fine trade, I see a bear flag, but I suspect it gets head faked, then I think we'll have another shot at TWTR short, the long term charts are negative, but the last trade was based 100% on the parabolic failure effect, that's why we have concepts and use them.

Have a great night!


GLD / DGLD Charts

This looks like exactly what I was looking for being gold has had a strong tendency to trade opposite the market, just look at today and being I only need something very short term that can not only hedge the trading portfolio shorts, but can also add a little extra $$$ to the portfolio as long as everything is timed right, this looks like it's going to be seat of your pants, precision flying to navigate this market the next day which is a Friday which means it's also going to be an op-ex day, which means look for the market to be pinned most of the day and then around 2 p.m. things will move a bit differently.

Because the DGLD volume is so low, the shorter timeframes have gaps in them where there's either no trade or 100 share lots and that doesn't make for a good signal, but I didn't come up with the idea using the DGLD charts, I was looking at GLD and GDX/NUGT/DUST, I decided GLD was more appropriate although I would have preferred the liquidity of a DUST over DGLD.

Quite a few of you asked me about GLD today and my response was the same all around, "I think it looks good, there's nice improvement in the charts, but I believe it's not quite done with this local base and today it popped just above that local base so I expect a little backing and filling". This last part makes perfect sense with the market signals being that gold has been trading nearly the mirror opposite of the market, GLD's charts also tend to confirm what I suspect about the market and any upside pop, SHORT DURATION, THUS THE OPTIONS TO MAKE THE PROFIT POTENTIAL WORTH WHILE.

 THIS IS THE HOURLY CHART OF GLD, which seems to be a forgotten asset and when they are quiet like this (much like home-builders during their massive base from 1999-2001) before they put in 2500%-5000% moves.

This is DGLD, it is effectively a 3x short GLD ETN. The spotty nature of the chart is a function of low volume. In red we have a strong bearish engulfing candle and a drop today just below the trendline, but on that drop the daily candle turns out to be pretty close to a bullish short term reversal, "Hammer", it's missing a little on the real body, but the principle is the same and closes right at the trendline

 GLD 30 min showing from left to right, a gap down on heavy volume indicative of a capitulation event, basically all the weak hand longs sold at the same time leaving only strong hands and giving smart money an opportunity to pick up a lot of shares on the cheap with plenty of supply so they don't drive price up or create any unwanted interest.

Then we have the little local base in between the trend lines and strong volume as we get a supportive move off the lower trendline. I didn't look close enough, but it may have triggered some stops as well. Today's move just above the base looks like a short term head fake, I have suspected all day that it will drop back down in to the range before making a serious move to the upside which the 60 min. chart is clearly telegraphing.

 This is GLD 15 min and it shows a counter trend correction to the left that saw distribution as price was higher than previous price above the trendline, but 3C was significantly lower, a distribution event.

As price makes its way lower which I talked about as being one of two very likely possibilities, either gold was ready to make a move higher or it was going to move all the way down toward the June/July lows and put in a much larger footprint/base.

At the time I said, "I don't care if gold makes a move higher here which is fine or if it moves to create that larger base because if it does create that larger base, it just means that when it moves up it will have the support and gas in the tank to make a significantly higher move than if it had moved up when I presented the two options.

 GLD 15 min above and 10 min just above both show an increasing positive ROC for 3C, this is seen on "W" bases or double bottoms as they mature as the second half is nearing completion so between the lack of interest, the size of base, the "off radar" nature of gold, it has all of the hallmarks of an asset under serious accumulation.

Also note the small head fake move below the local range just before it breaks out of that range today.

Even the 5 min chart is positive and looking stronger, this is fantastic because the 5 min chart could have easily gone negative today representing institutional distribution which would cause a rethink of the asset, but it didn't, it held its ground.

 Look at the same 5 min chart up close and what you see is an intraday "steering" divergence that sends gold lower on a gentle slope and in to the end of day Tuesday, as the market makes an end of day ramp that saw distribution, the asset that trades almost exactly opposite the market was seeing an end of day accumulation signal in a leading positive divegrence that played out today. What is good about today is once again, even on an intraday basis, GLD held in line and didn't show institutional distribution.

However, just like the intraday positives in the averages, the Index futures, some of the bellwether stocks like AAPL,GLD has an intraday negative. Again these intraday charts (1-3 minutes) are not serious divergences unless in a trend, they are more like short term signals and the short term signal was the opposite of the market which it should be for confirmation.

 This validates my thoughts today that GLD will likely come down in to the local range before popping higher on what I think is a mature divergence and a real, solid move.

The 2 min chart shows the same and fits perfectly with AAPL, PCLN, Index futures and market averages.

The 3 min chart shows accumulation at the EOD Tuesday, the opposite of the market averages which had ramped in to the close, but on distribution. ANOTHER PERFECT EXAMPLE OF HOW 3C SIGNALS PICK UP THE NEXT TRADING DAY RIGHT WHERE THEY LEFT OFF, EVEN ON THE START OF A NEW YEAR.

The take away is "very short term weakness, which would have been expected without the signals or the market signals, however we do have excellent confirmation".

So the 3x inverse (3x short GLD ETN), DGLD makes perfect sense as a short duration hedge, maybe a day, maybe two, maybe half a day, but it has the leverage I was looking for that AAPL couldn't provide (thus I opened a larger position to cover as a hedge).

DGLD looks to be a perfect solution to not only hedge the trading shorts, but to add some extra income in to the trading portfolio which closed out the day today at a +22.45% gain since inception which is just about 1 month as of today, that's an awesome return considering it's all equity positions and none of the leverage of options, If I were able to add options, this might be well over 50% for the month and that is solid performance.

Even though this is a new day, new year and volume is much different which can cause 3C some time to catch up to the new "normal", I REALLY like the visibility in the market and today's performance in the market is not typical at all, it's usually one of the most consistently bullish days of the year, not today, character is changing.


Trade Idea: DGLD

Remember I was looking for an equity position with leverage to hedge the trading portfolio, I had already chosen AAPL long for a short duration trade, well I'm going to add DGLD which is 3x short GLD, the opposite of UGLD. Be careful as the volume is under 100k today, but this should work for what I need, which is a short duration position, I'll post charts in a minute.

Option trade Ideas: PCLN / AAPL

Again, everything I said in the last post still applies, that's one of the reasons I chose options, if I feel like it's a short duration trade and the profit potential isn't there otherwise.

I decided on PCLN because of the $>1200 expectations and it looks decent and I chose AAPL because it has a decent short term chart.

PCLN I'm going with Feb monthlies $1130 calls

AAPL Feb monthly $550 calls.

I'd like to find a more leveraged hedge for the trading portfolio other than the AAPL long, but we'll see about that.

Index Futures

The VIX futures are once again pinned intraday 1 min, however if this may help swing some of your decision making, the Index futures 1 min charts are now really starting to scream, only 1 min though so whatever you might chose if you play a hedge or a long, please bear in mind that the probabilities of this being a short duration move are very high and the probabilities of a surprise gap down much bigger than today's are rising exponentially.

PCLN Update

I suppose if I were intent on opening a call in PCLN today, I'd be looking at it now.

At the moment, I'm not intent on it. I want something to jump off the chart and while this looks much better for a call position, I'm not quite sold. I'm going to look around, see if there's anything that may swing me, but to me it looks like a decent trade, it doesn't look like the kind that I just can't ignore.

SPY Options Opportunity, but...

Considering the first trading day of the new year traditionally is one of the strongest and most consistent, today is not good news for the bulls that believe the F_E_D will never leave them in their heyday. It's difficult to see all the contingencies and possibilities months in advance, but the F_E_D or F_O_M_C (same difference as they say) seems to have put off the initial taper plans from summer as the market threw a fit (bonds) and sent yields soaring on the 10-year.

The same thing is happening now, last I saw the 10-year had crossed solidly above 3% which one of the last two times it did that, it led to a -20% decline just back in 2011. I find it interesting that they chose the period of not only seasonal adjustments which is arbitrary economic data production that makes Window Dressing look like nothing more than window cleaning. These seasonal adjustments are so bunk, no one can figure out how they arrived at the numbers they do and they aren't willing to be forthcoming about it. It's what is generally known as "Goal seeked data", meaning put in the number you want and the computers will figure out how to get you there. 

With strong economic data as the Seasonal adjustment period runs through the first quarter of the year, the F_E_D has lots of ammo to taper even more. Secondly they act just as Congress lets the extended unemployment benefits expire, remember the F_E_D has tied "accommodative policy" which is not just QE as most assume, but more so it is leaving rates super low with this ZIRP policy. This means that the unemployment rate has virtually nowhere to go but down no matter how bad the labor situation is because those who fall off the unemployment benefits as millions will as their extended benefits were cut (I believe they just got their last check) ARE NO LONGER COUNTED AS PART OF THE LABOR FORCE!

When you take the available number of people in the labor force and shrink it by millions, it doesn't matter if unemployment rises in reality, it can't rise fast enough to make up for the millions of people who are suddenly no longer considered part of the labor pool. It's an ingenious, but really crappy thing to do, especially for a F_R_D that claims to be so transparent. The average Joe might not get all of this, but those who make their living on Wall St. know exactly what it means and I have to wonder what the blowback is going to be on this one.

In any case, this is the kind of move I spoke of earlier in which I'd consider an options position, long call...
 I sid a move below today's range and there it is, there's an intraday positive divegrence, I looked at it, I thought about it and I looked at this next chart and made up my mind...

The 15 min SPY leading negative divegrence which is just super strong right at the bump to highs on a EOD, SUPER low volume melt-up.

I can't go for a SPY call, not with this chart, this is just trouble waiting to happen and as high as my risk tolerance is, I could not relax after the close with a long SPY position open knowing this is out there.

That's where I'm at with this.

MCP P/L

Here's the P/L for the rest of the MCP long position just closed.


With a fill of $6.25 and a cost basis of $4.73, the gain on the second half of MCP comes to +31.73% and we are still VERY low in the overall base, by the time this simply fulfills the measured move it should be a double and likely quite a bit more as the measured move doesn't account for the length of the base.

Apparently it looks like this may have been the right time to wrap it up as it looks to be falling off after the initial burst of retail buying faded and as I said, smart money is not chasing MCP so there's not a lot of support in the area at best, more realistically, MCP was pumped so there was enough demand for smart money to sell in to, but I think for the same reason as us, to accumulate it at lower prices as it should pullback.

I applied ROC to price in blue, I don't know why,  you can see the Rate of Change falling off pretty easily.

Look at the herd, the lemmings all placing their buy orders as soon as they heard the words on CNBC!

Keep an eye on how MCP reacts if it moves below the area where most retail chased this one, they'll likely have stops under the noon-ish lows, but it can be very enlightening to se this action live for yourself and it makes the articles "Understanding the Head Fake Move" come to life.

Trade Management: MCP

I HATE not having a long in MCP and as I have said since the first partial position was taken off this week, as a core long/trending long position, I would just leave MCP long alone, but as a trading position, I want to try to work around any pullbacks and such.

We may have received a gift from CNBC, I don't watch, but apparently they were talking MCP up on one of their shows and MCP jumped, this is not going to be smart money buying Fast Money endorsements, either smart money is in long ago as we know to be the case and/or they are using the bump up to take profits, perhaps they are looking for the pullback or even forcing it if they really like MCP which I think they do, so they can accumulate more on the cheap.

I'll be closing out the rest of the MCP trading portfolio position on this gift, I'm not concerned if I don't top tick it, this is more than enough for me, so from here I'm looking for a pullback and a new long entry.

 Intraday spike on CNBC comments, this is not smart money. It looks like that's about all retail has for now so I think it's a reasonable time to exit stage left.

The 2 min chart shows a negative in to the move so I think my theory is probably pretty close.

And the 5 min chart also negative here with a gap just below, this is more than enough for a short term trade to go ahead and collect those substantial profits and wait for the next opportunity.

Again, for a longer term position, core long, trend trade, I'd just leave it alone and be patient.

Trade Idea: AAPL (long)

AAPL worked very well last week as a hedge, it wasn't my first choice as there's no leverage unless you use options, which may be something to consider here, but in a little larger size it hedged all trading shorts and added to the portfolio's overall gain, and then I was done with it in a day.

I'm going to do the same exact thing and add it as a hedge (AAAPL long) for the trading portfolio, maybe an options position, that will be decided in a bit and I'll post it of course before taking any action.

Here's what I see and like about AAPL, although I'd prefer something more generic like a leveraged industry group, this just looks to be the better choice.

 More important than the short term long/hedge has been this 15 min negative chart in AAPL, although I have taken no action on it because the 30 and 60 min were in line, but that is changing so AAPL looks like what may have been a counter trend rally as AAPL lost -45% off the all time highs, may be coming to an end.

This is the chart that really changes things and takes AAPL off the "Keep an eye on it" and puts it in the "Trade Watchlist", the 30 min chart very unambiguously has deteriorated badly from what was a perfect in line status or confirmation.

This is one seriously ugly negative divegrence and I'm glad to see some movement and AAPL back in play as a trade. The area in which 3C went leading negative is just as important as the divergence itself, on a gap up which is Wall St/'s thing, sell in to strength and this looks to have been very strong selling in to the gap up.


Intraday 2 min AAPL has a "W" base so it should be good for a move to the $570 area.

The 5 min chart is clear about this divergence too and the $570 area is a perfect area to look at AAPL as a possible core short.

This is the daily chart, the negative divegrence is seen here as well which means serious business, I'm thinking normal market behavior and head fake moves would put price around the yellow box which is about the same as the measured move target from the "W" base. I can't say we get that because too many other things are boiling up, but that would normally be what we look for.

For now, AAPL as a short duration trading long, I'll take a look at it as an options trade, but I'd prefer it broke under today's range to purchase a call/long option.