I try not to be a news service, there's enough of them out there that I needn't waste my time, but I do think it is important to highlight fundamental events that are or will shape the market so when you see news and events in the future, you can put the pieces together for yourself.
While we had a VERY slow Tier 1 Economic Data day, we did have some news that you should be aware of.
First off, overnight in Europe will be quite busy while most of us in the US are sleeping and the European markets open at 3 a.m. EDT.
Here's what's on the schedule for tomorrow:
Provisional Q2 German GDP -The recent trend in macro-economic Euro-zone data has shown the big "C" word emerging in what's left of the Aaa countries or the "Core", the word is, "Contagion". Any miss on GDP is not going to be helpful to the Euro's plight, sovereign bonds which are the same as saying "Future bailouts that the EU can't afford" could be effected, and there could certainly be domestic issues that cause German politicians to take actions that aren't seen as helpful to the periphery.
*Also recall that overnight Japanese GDP came in well below consensus and I believe even below the lowest analyst expectation, while Greek Q2 GDP did beat, Greece is virtually written off. The market may be extra-sensitive to GDP data. If you want to consider conspiracy theories, you may recall my post from Friday about the market not being done because AAPL had not broken above its triangle. Now consider the overnight news that sent ES from risk off to heading back up, Japan, the world's 3rd largest economy missed so badly on GDP that it was below even the lowest analyst estimate, however Greece, which as an economic indicator has zero worth, came in bad, but better than expected and that sent ES (S&P E-mini futures) higher. Which one do you think would carry more weight if all things in the market were equal?
ES overnight reacting to Japan first and then Greece...
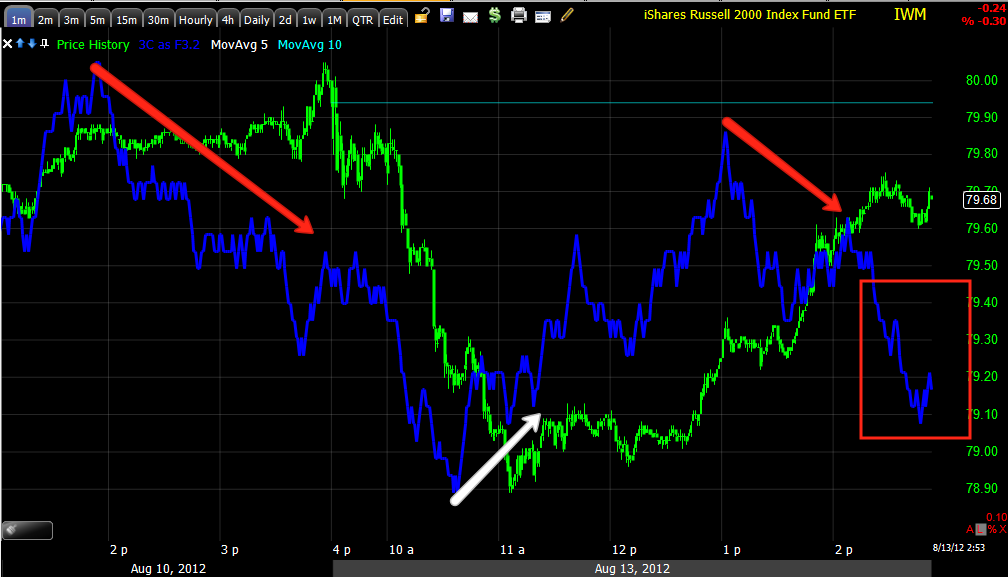
The EUR/USD (Euro's) response to Greek GDP
UK CPI-Same issues, except the UK is not the power-broker or purse strings that Germany is, but the data recently from the UK hasn't been good.
2Q Euro-Area GDP- Well nothing "Euro-area" has come in very strong recently, this of course could be another disappointment that effects Spanish and Italian yields among other things.
Euro-Area Industrial Production- Same issues
U.S. Retail Sales (July)
U.S. Business Inventories
Italy also has an auction of bills tomorrow, the yields will be watched.
Today:
One of the only sources of hope left for market bulls is QE3 will be announced, however last week we had a run of economic data that seemed to put any hope of QE3 in September out to the pasture and would likely push any further chances in to the new year because of the election and the F_E_D's need to seem impartial. Gold, which has been trading as a QE sentiment indicator (up when traders are hopeful and down when they lose faith in new QE), saw a petty sharp decline today.
Friday I opened GLD September $160 puts around 11:50 a.m. and they are up 12% today. While we will be looking at the longer term outlook for Gold as there are some interesting developments, it seems to me that for the near future, U.S. easing through QE looks unlikely, through the ECB... ? Who knows, now that Merkel is back from vacation I suspect that debate will heat up. While I feel GLD will suffer some downside due to the increasingly unlikely QE announcement during 2012, technical trade and volatility will remain, such as the entry discovered Friday tat led to today's gains in the GLD put.
Some may have noticed, some may have not, but the market is at an exceptionally low area of fear; this is large part explains recent VXX/UVXY anomalies as the VIX hit a closing low today of 13.90. Since I don't have enough history on a daily chart, I have to use a 2 day chart, but the last time I can find the VIX this low was around July of 2007!!!
2-day chart of the VIX and last time it closed this low.
VIX vs the SPY over the last week or so. About a week ago we learned that the QQQ had short interest so low that the last time it had been that low was 1998! The market's ultra-complacency is setting it up for a big fall; I don't base my opinion on the VIX, but rather on the charts and the other risk assets we follow such as Credit, Yields, Commodities, Currencies, etc-all have lined up signaling a reversal that would only be the 4th time this year and in much worse condition with much higher volatility than any time this year.
These are the 4 reversals that have been signaled this year.
Note that in each of the last 3 reversals there was at least a 1-day/intraday head fake move to a new high or a new low at the June reversal. We have the range in place to make such a move, as I mentioned several times today, I'm surprised we haven't seen that move; the NASDAQ 100 "could" have been considered to make a weak version of that move today and the Russell 2000 could have been considered to make a version of that move on August 7th.
As for my comment about the market being in the worst position now of all of the reversals this year, here's the SPY 60 min chart showing the negative and positive divergences of each reversal, although the SPX is close to the April highs, 3C is significantly lower in the largest negative divergence of the year which all started with the head fake move lower in early June that we identified as such more than a week before it made the move allowing us plenty of time to position.
Today in what is most likely a little realized event of some importance,
The German Constitutional Court has received a new lawsuit challenging the Constitutionality of the ESM and the European Fiscal Pact. To put this in to some context, the ESM (European Stability Mechanism) is the permanent version of the wild failure known as the EFSF (European Financial Stability Fund). The EFSF was a stop-gap temporary measure, it never lived up to its intended use as the EU decided to try to leverage the EFSF to $1 Trillion dollars, but on one of the earliest offerings to raise funds, they couldn't even technically cover a $3billion dollar offering. With China bowing out as the potential savior of Europe and looking for opportunities in Africa, there simply isn't any place for the money to come from except the richer Northern EU countries.
The ESM was supposed to already be functional by now, this is where money for current (Greece) and future (Spain and Italy) bailouts was supposed to come from, but to this date Germany has not ratified the treaty creating the ESM. As the German Constitutional Court takes up the issue of the ESM's constitutionality, further lawsuits are causing further delays and bond holders of sovereigns such as Spain are getting very nervous, while potential and likely countries that will need a bailout are saying that they will not accept any bailouts with conditions tied to them. This alone is an impasse as there's no way the Northern EU countries will fork over money to Spain with no conditions, just look at the harsh austerity imposed on Greece for their bailouts.
The German Court was supposed to decide by September 12th, that now appears to have been set back even further, meanwhile Europe has no permanent bailout funds or even a mechanism that is operational. If Germany does not ratify the ESM, the biggest financial donor to the ESM will not be included in it. Furthermore the ECB's Draghi has tied sovereign bond purchases to keep Spanish and Italian yields down, directly to the ESM's functionality. This means the ECB may not buy these countries' bonds on the secondary market. Italy is already seen 10-year yields above 6%, Spain has seen then higher than 7.5%, for reference, every country that has received a bailout thus far has considered 6% an unsustainable yield forcing them to seek a bailout as the high yields effectively lock them out of the bond market to raise much needed cash to run their countries and re-capitalize their sinking financial sector.
I think few traders realize what a catastrophe this could be as the original Spanish banking sector bailout was to come from the ESM, since then multiple Spanish Regions have failed and sought government bailouts, or in other words, Spain is quickly moving from needing a banking sector bailout to a full fledged sovereign bailout and there is no money, no mechanism in place to handle what would be the biggest sovereign failure in the EU to date and Italy wouldn't be far behind.
As for technical today...
Other than the historical low in the VIX, the NYSE volume today hit a more than 10 year low (for non-holiday trading days). ES volume was also about half of the recent 4 month average, however it is not known what effect the Knight "Algo Gone Wild" has had on ES volume.
Complacency at multi year highs and volume at multi-year lows today... Of the 10 major sectors and what I consider to be the 3 most important: Financials, Tech and Energy, only 2 of 10 closed green, Tech and Financials.
Energy
Since the market wide accumulation day of August 2nd, which is the same day Goldman put out their long Euro call, which might as well be long stocks, I have felt pretty good with the USO and IOC short and Put positions.
Financials
About a week ago Financials seemed to be the last group holding on, I commented on it, but since as you can see, they have been making new leading negative lows including today.
Tech
When in doubt, look at the longer term charts, I don't feel much doubt about what was going on with smart money and AAPL today, but there were other Tech movers, here's the 15 min. Tech chart in to the afternoon rally.
As for other indications, take a look at the various credit types vs The S&P E-mini futures.
ES in blue, Investment Grade in brown (I'm a bit surprised IG credit isn't doing better), Red and Green are both high Yield credit, which should rally with the market, when credit diverges, it's usually a signal.
As for our own Risk Asset Indicators, here's how they closed.
Commodities as a risk asset didn't participate at all in the end of day ramp, this probably suggests in addition to the overall market divergence, trouble in China.
Commodities stayed in line with the SPX for quite a while then started slowly slipping, now they are moving totally opposite.
Interestingly, High Yield credit seems like it was bought near the SPX lows and sold in to the SPX ramp in the afternoon, in any case, HY which should rally with the market absolutely did not.
High Yield Corporate still remains dislocated from the SPX.
As does the high yield Junk/JNK.
Yields again (typically act as a magnet for stocks) didn't participate for a 3rd day.
It almost seems that Yields had their head fake move back on the 9th.
My favorite currency as a leading indicator and trouble in Chine, the $AUD also didn't participate with the SPX which is notable because it has been VERY well correlated until the last few days.
$AUD vs SPX longer term.
The Euro as mentioned earlier provided initial support for the market after the Greek GDP, however it failed at the afternoon ramp.
Here's a longer view.
I said earlier that the SPX and Euro typically revert to the mean, here's a better idea of what that would look like.
In AH, Groupon is getting whacked.
Here's ES as of now...
ES's earlier positive divergence and then leading positive, followed by what was a nasty leading negative divergence during regular hours, that divergence is barely noticeable compared to what 3C has done in after hours, as I said, I'm happy I'm not long the market or ES.