Wednesday, February 6, 2013

Quick Update

This is some fact based observation mixed with some conjecture.  The end of day "ramp" in stocks was achieved apparently through the use of... you might have guessed it, volatility just like we've been seeing through most of the early part of the year, except price in many cases is at the level seen the last several days, but volatility is far from the lows seen on those days, in other words, while volatility is moving down, it's not moving down nearly as much, the VIX is still in a huge volatility squeeze from some of the largest volatility to some of the narrowest in a very short time, as I said yesterday the VIX probably has a little more time to bounce back and forth around the median of the 20 bar average on a 20/20 Bollinger Band setting and that's exactly what it did today, but again, it's not breaking as low as it was and judging from the size of the volatility squeeze in volatility, there's about to be a huge directional move and I just don't see that to the downside.

The NYSE TICK Index shows a clear trend from about 1:15 on to the upside, in fact hitting extremes of nearly +1500, while the recent volatility uptick that we expected is forming more of a tighter triangle like the Dow I showed you near the close with both the SPX and Dow closing at +0.04 and 0.05% and the NASDAQ down 0.32% (made some money in the NASDAQ puts from yesterday-yeah!) and the R2K nearly the mirror opposite up +0.33%, however even with the TICK at such extreme levels 3C moderated through the afternoon and didn't look anything like the market was ramping (back to unchanged in the Dow and SPX and down in the NDX, up in the R2K). I figure the TICK is probably up and trending like that as the Russell 2000 went green as we're talking 2000 stocks, not 500, 100 or 30. Still 3C was very much like it was being hedged or moderated, earlier strength turned negative or dropped to in line.

Tomorrow is the ECB's rate decision policy and while I have no business making these kinds of guesses, I'm just thinking out loud.

The lack of any stocks, averages or ETFs clearly standing out as a long buy seems odd considering HYG is positive and looks like it will move up, but credit traders are also the smartest of smart money and no matter what, HYG isn't going to go too far, but excellent choice as far as a beaten down asset on the cheap. Thinking about that triangle in the Dow, you know what I'm thinking. The 3C charts are clearly negative on timeframes like 10, 15, 30, 60, and pretty neutral on 1, 2,3 and 5 almost as if there's nothing going on there or whatever may have gone on yesterday, they aren't putting much more in to it.

So here's my guess, the ECB lowers rates tomorrow which will initially be met with cheer, "Germany is saved!", the French are upset about the Euro's strength, I'm sure everyone other than vacationers out of the Union are upset. A member of the ECB went out of his way today to say that they aren't targeting the currency value as if to try to inoculate himself before the deed is done.

So everyone is happy, the European markets rally on the news, the US pre-market is strong and the open is, we get a move above the triangle in the Dow and wherever else they're found, but there's one crowd that's not happy, guess who?

Anyone with a carry trade on, just about all hedge funds, large institutions, etc. I already saw evidence today that it looks like some where trying to close the trade, they'll be at a huge loss on huge leverage (up to 200 to 1). Soon the initial enthusiasm and jubilation gives way to the reality of funds selling equities to close their carry trades as fast as possible as the pace and size losses they are taking, the yen soars and that's probably the reason VXX looked so good on 3C charts today and volatility didn't sell off to similar lows when price in the averages was at this level, you have tour triangle's broken to the upside and sent back down lower and if it happens like this, remember my gut feeling that the reversal comes quick-intraday even, that would do it.

So the real event, the pivot tomorrow is the ECB rate decision, this could explain the huge volatility squeeze in the VIX as well as 1000 other things.


Long the Yen

This is another I'd consider, again because it hasn't reversed the stop would have to be wide to accommodate volatility on a reversal, but I would consider long the Yen (FXY), there is the leveraged YCL, but liquidity there is almost non-existient.

Poking Around

The more I look around the more it look like everything just went short term hedged or basically a market that has no idea what to expect from tomorrow.

I've looked at a lot of assets, the theme is this short term kind of non-commitment to either side, but mid term and longer look very negative. The only asset so far I have found that I would consider an immediate trade in other than what's already open is short the Dow/DIA, whether that be short the DIA or long a 2 or 3 x leveraged bear ETF, that's a matter of risk tolerance, I would though plan my risk management to include this sloppy triangle and a potential head fake move above it.

It's not hugely obvious, but it's a major average receiving a lot of attention because of the 14k level so the triangle is pretty much a given, the way this one looks, if I was going to be playing another weekly short, it would be the Dow, but I think this needs a bit more room and enough risk management and maybe even a phased entry to allow for a head fake move above the triangle.

This is if you have to find something to trade, I personally already have some exposure there so I'm inclined to be more patient.

Market Update

It has been a very dynamic day, earlier (45 mins ago or so)  the signals looked to be building, now they are in line and in certain case fading, if you go out to about 10 or 15 minutes they are falling off negative really bad so if I were to play options here right now, I'd have to take  longer term position out to March monthlies.

I'm still looking around. I expected volatility like VXX and UVXY to show some intraday negative signals, but they held up really well.

So like yesterday there's some question as to what is going on the last two days, but today's character is not as good as yesterday's, it's almost a totally different situation as if there's some fluid dynamic.

I'm still poking around to see if there's any trade worth picking up now.

Leading Indicators

As quickly as I can-and if you are wondering whether I'd take a long/call in front of the ECB tomorrow, no, there's too much risk, not enough probabilities. I will leave the AMZN call open for the short term trade it was meant to be.

 This is FCT, it just happens to be a good leading indicator, there's a loss of downside momentum, all in all though I think the dislocation is big enough that whatever the loss of momentum is about is shorter in nature. Note the earlier confirmation of Trend 1 to the left.

 Yields, like a magnet for stocks, they are dislocating intraday.

 And they are dislocating on a longer view as we entered the volatility area.

 The $AUD intraday is not playing along.

 The dislocation here is enormous.

 The Euro intraday, you already know it's close on a longer term basis, but today it's more risk averse.

Credit...

 On a 1 min chart, here's what bothered me early yesterday, credit (Junk) moving with the SPX, it seems to have found a support area, I'd say an accumulation zone, it is very short in nature though so unless it puts in several more days, it can't sustain a very long or strong move, but it is really cheap vs other risk assets.

 Longer term, something like 25 days in this trend or 5 trading weeks and the entire gain in Junk credit was stripped away in 7 days, FEAR is stronger than GREED.

 The biggie, HYG or High Yield Corporate Credit. Today it appears less connected to the SPX than yesterday, but it also seems to be reaching for an accumulation/support area.

 Long term, that's a bad sign for stocks as Credit leads and equities follow, but still you see the support area it is reaching for today?

 The long term view and I'm not sure what the actual credit would look like, this is the ETF, but big accumulation at the November Cycle low, in line on the way up and then a large leading negative divergence and a positive divergence now within the leading negative, the leading negative is far stronger.

Here's a closer view, the distribution at the top and the accumulation it appears of the last 2-3 days. It looks like volatility is really going to pick up and with it, I'm guessing the swings in the chop are going to be larger before a fall off the cliff.

Got Out

Ok, I'm not even done with my analysis and haven't had a chance to look at the Q's beyond 1 min, but I  keep looking at High Yield Corp. Credit and how incredibly cheap it is vs any of the equities and if there was to be a big swing to the upside before the ECB in anticipation of a sell-off, then what would you choose to put on a big position for a quick trade, equities that are trading very rich compared to every metric out there or the deeply discounted High Yield Credit, especially HYG which is EXTREMELY liquid so they could put on a decent size position and be able to get out of it because of it's enormous liquidity, it's a HELL of a lot cheaper (please excuse my language, but I really wanted to convey that point), yes, HY Credit is trading at an extraordinary discount.

So I looked at HYG and saw a few positive divergences that I did not like, now don't get me wrong, as far as what we use Leading Indicators for, HY Corp and Junk Credit are so totally dislocated from the SPX (one reason CONTEXT is so divergent from ES) that the negative signal and bias for the market is not going to change even with a 1.5% move in HYG in a day, but for what I mentioned last night, "One last Hurrah before the ECB", this is the most discounted, High Yielding Asset they could choose.

So I decided that I'm not going to take a 1-day gain and put it at risk when I can simply re-enter the position later.

I closed the entire position unlike yesterday where it was phased out, after thinking about it the couple of hours of risk weren't worth the extra 2.27% on a 50+% gain. Here's a nearly 42% gain, this is what, like the 4th or 5th in a week? Don't get me wrong, day trades (literally 1 day) and options, especially weekly are my least favorite trade despite the gains, you can only go so long before the other side of the sword cuts you, but they are undoubtedly the best vehicle for this environment.

I'm going to get out the Leading indicators, but I could almost guarantee that HYG will rally and probably Junk Credit with it.

Closing Out the QQQ Put from yesterday

Decent profit, I'll explain in a minute, but remember what I said last night about what could happen just before the ECB meeting tomorrow.

Intraday

All of the averages have at least intraday positive divergences, I can't see the 2 or 3 min, but there's nothing positive on the 5, this includes Futures, or at least ES and NQ to a slightly lesser degree

Futures, CONTEXT and Currencies

I believe it was just last night and pretty much since the start of the week that I have not only been focussed on what the mid-term Index Futures are doing like ES and NQ (S&P and NASDAQ E-minis), but more recently there's been an added emphasis not only on what the EUR/USD does which could be a huge change as of tomorrow if the ECB actually does something instead of taking a pass, the French are screaming about the Euro's ascent and I can't imagine German Industrial production and exports are very happy about it either, especially with part of of 2 (GDP) in place for a formal declaration of a recession. Germany counts on exports, if you really dig down to the hardcore truth, the Euro-zone wouldn't exist if it weren't for Germany needing to create a free trade zone in which they controls who gets in based on their credit report (economy and ability to pay for German exports). This is also one of the main reasons why Germany is the clear task master when it comes to Europe and the question tomorrow will be who Draghi really answers to, the Bundesbank and Germany or Goldman Sachs, although according to Goldman they too off their Euro long days ago which means they have been selling in to strength since they announced it.

In any case, the thing I'm focussing more and more on is the carry trade, the ECB's decision tomorrow could have huge ramifications for the carry and for every risk asset class, that may be why we are seeing some not so carry friendly movement in the pairs today, nervousness in front of the ECB tomorrow? I may have to leave that QQQ weekly Put from yesterday open a bit longer.

Any way, we'll look at CONTEXT first as a quick and dirt way, but I'll update Leading Indicators, it really matters right now.
 CONTEXT for S&P Futures shows the model significantly down vs ES, it hit a low earlier of a -12 spread, that's pretty low (ES is red/CONTEXT model is green).

 CONTEXT's SPY arbitrage is also seeing similar underlying weakness as there's been a significant divergence between the SPY and the model since about noon time (I can't believe how fast the days are moving this week),

 This is the ES 1 min chart with a leading negative divergence, it starts at what time? 12 p.m. EDT

 Yesterday the ES 5 min chart, which was working perfectly for our 1-day weekly option index trades, was nearly perfectly in line, this was one of my concerns, I at least see divergences now, but perhaps more importantly...

 The ES 15 min chart, which is much more important, was not effected by the shorter term movement that did effect the 5 min and the clear positive and negative divergences are still very much there, so far today we have a pretty negative one, another reason I may have to leave that QQQ Put in place for another day although I hate doing that with fundamental wild cards like the ECB vote, but it seems Goldman doesn't have a lot of faith in the status quo either.

 NASDAQ 1 min futures got nasty after being largely in line all night and certainly since the European open.

 NASDAQ 5 min chart still seems to be working fine for the day to day option trades we've been hitting to take advantage of the increased ATR and volatility.

The 15 min NASDAQ showed quite a bit of deterioration.

Other indications...
 The EUR/USD since the start of trade this week (green arrow) with the red trendline as an initial marker, yesterday we had some Euro strength,today it's slipping as the $USD is actually up today.

 The EUR/JPY longer term trend, this is carry friendly, it also looks a bit wedgey too.

 A closer view of the same pair intraday showing the Euro losing ground, but guess what else?

 The Yen is really close to breaking out to the upside, if that happens with the Euro still losing ground (imagine if the ECB cuts) then the carry trade could be the main driver of downside momentum in the market. I suspect the bit of Yen strength or possible strength we are seeing right now is some carry trades being closed as they'd have to buy the yen back.

 The USD/JPY longer term, also a bit wedgy.

 And the pair over the last 2 days, notice anything different? Of course this isn't a big enough move to call it a change in character, but it could be the start of one.

 This is the $USD intraday, it's up on its own. If you look above it would seem the USD was slipping, but that has to do with the Yen not falling like it was.

Again, the Yen, that could easily breakout to the upside and with the leverage on the carry, cause a very fast shift in momentum and a lot of risk assets would have to be sold quickly to close this highly leveraged trade out as every pip lost is worth 1 or 2 hundred!

Don't Jump to Conclussions

One of my challenges is looking at so many assets so closely that any changes like what I saw yesterday send up red flags when really they are changes, but not of a large or long enough character to really warrant the red flags. The deterioration from later in the afternoon yesterday continues so far today, although i wouldn't say we are out of the volatility zone just yet. The Q's look a little better than the SPY,that's because of AAPL which did see distribution on today's intraday move above the daily highs of the recent range, it's now sitting right on them as support, I suspect they'll break, otherwise why distribute them unless this is an exodus from AAPL again, but the rest of the charts aren't supporting that idea.

Here's an idea of what the deterioration on the SPY loos like, remember it's still early and remember there's no reason in the world to think that volatility won't continue to increase. Og and by the way, yesterday's Feb (nest week) QQQ puts are in the money, I'd like to see them a bit deeper in the money, but working already.

 SPY 1m leading negative as soon as the gap was filled.


 migration of the divergence to the 2 min chart...

 And to the 3 min chart

And to the 5 min chart, you know what that means. I'd keep an eye on the intraday NYSE TICK for any potential reversals.

There are some other very important assets that I need to look at.

Oh and the AMZN short term calls are still open, there are positive divergences in the short term that keep me comfortable with them, as you probably know the equity short in AMZN is also still open, seem counter-intuitive? They are two different timeframe trades and a hedge of sorts.

What is AAPL Really Up to?

A long time ago I was warning about AAPL while it was still the darling stock that just did not have a normal investing crowd, they were Apple groupies, how dare anyone say anything about AAPL because, "For sure, this time it's different". I think the question of the loss of Steve Jobs has been answered and as far as the "It's different this time", just take a look at a 10-15 year chart of MSFT and you'll know it's never different.

I'm not going to go down the road of all the mistakes AAPL made, but I'll touch on a few. I'll also say  that the hedge fund hotel that was and still is AAPL, still has more guests that would like to check out and do it without taking a large loss.

I really can't see the launch of a cheaper IPhone as beneficial to AAPL, "An IPhone for Everyone!", that crushes the appeal of AAPL, it was a clique, it was exclusive and edgy and that's because it was above the crowd's understanding early on and price point.

AAPL T.V.? Content providers don't seem to want to give AAPL the exclusive rights they demand, to basically do to movies what I-Tunes did to music, so I'm not sure I'd count on that.

The dividend is the death knell, it was for MSFT and not soon after AAPL declared one, it didn't help AAPL.

Finally the biggest faux-pas in my view was allowing the IP5 to hit the market. The IP5 was behind Samsung before it was even introduced, it's a nice phone, but it's kind of like MSFT's "Vista moment". The launch of the IP5 was the first time I watched an AAPL product unveiling (as good as they are at selling the presentation, something BlackBerry could learn from) and thought to myself as well as posted here immediately after, "This is not revolutionary, it's evolutionary" and that was a first for AAPL and not a good one.

In any case, like Cramer says, "If you are down and desperate, you need to create a fiction to create a new truth" and if you are locked in Hotel AAPL with several million shares or tens of millions, you need a little help, the easiest thing to sell right now, "The AAPL sell-off is overdone". Cramer can call Steve Lies-man and start selling the "AAPL has so much cash, the price should be "X" amount higher based on that alone and they have XYZ in the pipeline from what I've heard from my sources" (wink, wink).

For a while it seemed like AAPL was setting up a long trade (this was a while back) and we needed some more confirmation, then we got caught up in that big descending triangle. Yesterday AAPL was one of the stocks showing early afternoon 3C strength and late afternoon deterioration, there are 3C charts that suggest something is going on, they just haven't met in the middle yet, so I'm inclined to sit back until I understand clearly what my edge is, but we want to know where we are so we know where we are going as AAPL moves.

Charts...
 After the decline from September, which moved up +2.8% total after the F_O_M_C announced QE3, remember all the 3C negative signals at that point and I remember several emails saying, "Don't fight the F_E_D", it seems clear that QE3 was discounted long before it was announced, thus the negative signals on 9/13/2012.

This triangle is a bearish consolidation/continuation that saw an initial head fake breakout to the upside followed by a break to the downside creating a "Crazy Ivan" shakeout and 1 more move above resistance before the drop. Note the range now, what are ranges good for? Hint, 2 things, I starts with "A" and has a the following letters "ucmucaliotn" and the second has to do with something you'll see below that just happened this morning just above the range.

 The long term Trend Channel has a ways to go to change the Primary trend or at least intermediate, but on a 5-day chart note the last 2 candlesticks are hammers as in, "Hammering out a bottom".

 On a more sun-intermediate trend basis, here's the Trend Channel (3-days) which is not so unreasonable.

 As far as my DeMark inspired indicator (Can someone please send me some ideas for a name for this indicator? Please?), we have a large sell signal, remember I told you the bigger they are, the more meaningful the move, then a buy signal and its move is meaningful according to the signal's size and a new signal that is already a bit bigger than the last, but it hasn't finished yet.

 The Daily 3C chart shows the distribution of early 2012, I don't recall, but I think we might have played this as a quick short, then the September move down which I made a mistake of getting too "Lost in the lines", trying to get the best entry possible when the fact was AAPL was unpredictable as there were too many hedge funds who were all willing to say, "Every man for themselves" and "He who sells first, sells best".

The point is, now there's a relative positive divergence so it seems something is going on here.

 The long term 2 hour chart with leading negative distribution at the Sept. top and not any real signals since until now, much like the daily chart above.

 The 10 min chart has more detail although not as clean of a trend, there are several signals, the most recent is in the same area with the relative positives I talked about as the first to usually show up followed by a stronger leading positive (all in last night's post). So there's enough information to tell me something is going on, but is this something that's going to move soon or base for a while to support a stronger/longer move?


 It's the charts from 1-15 minute that give us the timing and here's where there are some blank spots so far, yesterday the intraday 1 min was leading positive (remember I said the early afternoon positive divergences had me a bit perplexed, but the late afternoon negatives washed that away a bit). This morning look at the move and look at the negative divergence in to the move, now think about the 2 reasons I said ranges form, 1 was accumulation the second is to create movement, supply, demand and it's all based on obvious support and resistance. As price moved up there was distribution on an intraday basis.

 The 3 min chart shows yesterday's strength and then weakness and today's distribution in to higher prices, which are....

 just above the range this morning, want proof?

There it is, check the volume increase as traders perceive the move above the range as a breakout, but there was distribution in to that move so smart money wanted to do something with this move, maybe trap enough longs to send prices lower where they can be accumulated as the longs sell as their loss grows bigger, that creates supply at cheaper levels that can be accumulated.

Like I said, I don't have the exact game figured out yet, but the range is important and what happens above and below are important.

Keep AAPL on your radar, even if you have no interest in trading it, it's a market bellwether.

Now We See a Little Momentum

It's sporadic and largely due to AAPL, but it's there and on the short term charts. The ideal situation would be to see this early price momentum build with the longer 3C charts (intraday length) refuse to add any strength, this would set up a nice shorting scenario and perhaps tell us more about the consensus of Wall St. re: the ECB possible Rate Cut tomorrow.

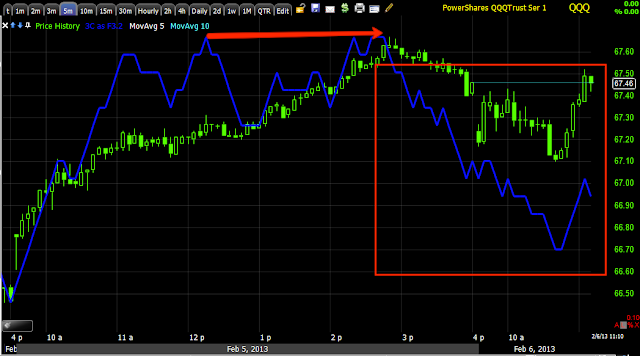
The QQQ is where the momentum is concentrated due to AAPL...
 The 1 min chart came alive and the Q's went green.

Weakness is still present on the 5 min chart, I'd like to see this deteriorate more in to some price upside today, at least the first half of the day.

We'll take a bigger look at AAPL as well.

Early Update

So far even the normal gap filling process is very slow, there appears to be a continuation of the move from early afternoon underlying improvement to late afternoon deterioration, although there are a few stocks, AAPL in particular that do appear to be interesting in what it's going to do, perhaps not so much in the immediate future, but it my be working on something.

 Some  early Dow weakness...

 IWM weakness is more impressive at the moment..

 As is QQQ weakness

 Even with the TICK slightly positive....

The SPY is showing some early weakness, but this is still very early, it's how these charts move from here that will be telling.

I'm of course looking for the QQQ puts to work in the near future.