Tuesday, December 13, 2011

Daily Wrap

First with our second earnings play, ABM reported tonight with a mixed report, revenue fell 17%, they guided to the low end of expectations, net income beat by a penny due to some 1 time charges, other then that, nothing too spectacular, but they did trade down over 2% in after hours ending AH -1.71
5 and we'll see what tomorrow brings.

As for FX, the Euro had a bad day.

 Here's what the Euro looks like tonight.

 On a daily basis, important support has been broken which is not good for equities, commodities and most risk assets including crude oil.

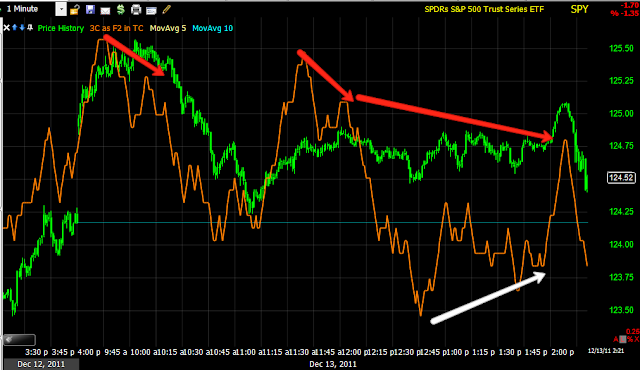
 ES is showing a negative divergence right now in to flat trade.

As you can see, ES opened above VWAP but couldn't hold it, there was a brief pop above right before the 2:15 F_O_M_C announcement and then ES just totally lost VWAP in bearish trade.

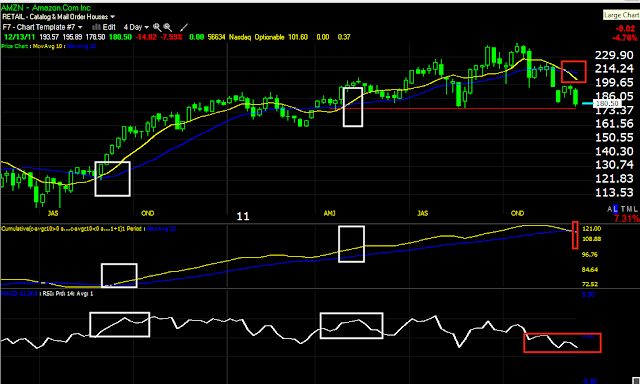
I have been tweaking the scan I recently wrote and there are some new rules, but I'm coming up with many of the same candidates such as AMZN which was highlighted today.

 My highlighting AMZN had nothing to do with the scan, it was coincidence that it appeared in the scan with EMC as well below. The little hash mark in the white box is a signal for a short position or at least a candidate.


The new rules are made to avoid volatility associated with tops and get in to some trades ready to trend where the money is better and easier. The rules are the stock must have been above the 200 day moving average, fallen below it and then rallied back up to it, this is the volatility that occurs with the break of a top, so we are bypassing that volatility and opportunity cost, then the rally up to the 200 must fail and the stock must make a 2 week new low showing it is moving down in the right direction. 3C has to be negatively divergent on the daily chart and the 200 day moving average needs to be heading down which signals a primary bear market. I came up with quite a few candidates and it's just a matter of finding the tactical entry, I think this will be an excellent system, especially now that the market looks set to close the divergence seen in the credit/risk indicator dislocations.

So I may need to set up a new spread sheet or something to give you the list of trades to keep on the radar.

Other then that, the F_E_D disappointed today as did retail sales, showing that Black Friday was as I witnessed, retailers selling volume at a loss or very low margins. It's not looking good for a Santa Claus rally, but we still have some end of year window dressing to deal with which could go either way.

You saw GLD's analysis today and the possibility for a bounce being the top just broke, with the new year coming so are mutual and hedge fund redemptions, to meet those redemptions, the only profitable trade many of the funds have on the year, GLD will likely have to be sold so the timing of the earlier analysis and that fact may work in tandem setting up a possible short in the next few weeks.

Other then that, today was quiet with only Merkel's announcement that the ESM will not be increased and of course some violence in Belgium.

We will see what tomorrow holds, but there's a lot of disappointment in the market right now.

AMZN Trade Idea (Short)

It's probably pretty well known that I prefer to short stocks outside of tops and not in them. I feel the extra 10% or so you usually make is not worth the volatility and the opportunity cost, a trend is where the meat is and I'd much prefer taking 80% of the move then having the top and bottom 10% ties up for months in a volatile pattern.

So with ll of that said, AMZN is approaching the area in which it becomes a much less volatile, much higher probability and much lower opportunity cost trade.

 The weekly chart has broken down and looks great, as you can see, there's plenty of downside. MACD is also negative as you would expect.

 On a daily chart AMZN gapped down in the red box on increasing volume, that gap was never filled which makes it a somewhat rare, and very bearish breakaway gap. Tight now on the daily, there's 1 more level of support, but the fact the market looks like it does and AMZN hasn't been filling gaps leads me to believe there would be less volatility on a break of the trendline, in fact it may slice right through t, but any price strength would be a gift.

 The daily 3C chart is perfect, it goes from confirmation to distribution in the top to a leading negative divergence.

 All of the intraday charts confirm as well, 30 min

 15 min

 5 min

 Here's my crossover screen showing several long signals and a new short signal just the last few days.

The daily trend channel has held the short this entire time, the stop is around $197.

If we can get a bounce, that would be great, otherwise a slice through support would also make for a nice entry. The volatility is largely behind us and being a retailer, this is also an industry group that is on the floor as retail sales showed today.

I like the AMZN trade, but if you have questions specific to your trading style, feel free to email me any time.


AAPL follow up

I don't know how many people took the AAPL short when I mentioned it, but this just keeps looking better!
 AAPL 5 min, every head fake is a new opportunity as it keeps moving lower (3C), I'm liking this trade more and more.


 The 15 min chart is now at the area in which a reversal usually comes and AAPL only has some minor support before cracking lower.

And the hourly chart suggests to me that a break lower is already priced in

Some more color on USO

 2 min leading negative divergence

And the 5 min leading negative.

Geo-politial risks remain, but the weak Euro and strong dollar are putting pressure on USO as well as a global slowdown/China

Trade Ideas, SPG, SAI, HBI (short)

 hate to dump these on you on such short notice and you may want to be a little patient and take a closer look, but alerts I set just went off so here they are.


HBI
 This one set off the alert because it is breaking below a very big top on this weekly chart.

 Here's the break on a daily chart.

 And on a 5 min chart

 Here's 3C with a head fake, and head fakes are one of the last things we often see before a break down.

SAI was from this weekend's scan
 Here you can see it has had 2 head fakes above the 50 day ma

 3C 30 min looks bad

 a close up of the 30 min and another head fake at the 50 daily ma

 Here are both head fakes above the 50 day ma, both were sold in to strength.

 These two charts 2 min and 1 min both show the last head fake before it moved below the 50 today.


SPG-Simon Malls
 The 1 min chart here looks horrible

And this was a scan candidate as it now breaks the daily 50 ma

Don't rush in to the trades, we have time to look at them closer and talk about ideas, feel free to email me


USO Update

Unfortunately my Stockfinder 3C template has a gremlin, but from the Telechart 3C version, it looks like fading USO strength here on dollar strength may be a quick short term trade worthwhile.
5 min 3C going leading negative.

Let me try to get this template loaded and I'll update this again.

Earnings Plays-ABM

I'm surprised how many people took the BBY short last night, but I'm getting a lot of requests for other companies. First there's ABM which reports after the bell. Here's what I like and don't like.


 First the hourly 3C chart looks pretty bad.

 On the 30 min hart, there's a head fake breakout that failed quickly and this is what I like about ABM, it was pretty negative at that point on the 30 min chart.

 Here's the same head fake on a 15 min chart which went negative right at the event.

 And on a 5 min chart, it seems distribution all the way up to the head fake.

 It can also be seen on a 2 min chart.

 What I don't like is there's support at the 50-day m.a. which could limit the immediate downside from a bad reaction, there's not a lot of room between here and the moving average unless it were to slice right through it.

Secondly this is good and bad, there's resistance right at the head fake, but also a top pattern which could provide temporary support at the trend line, so my main concern here would be profit potential.

More coming

TLT may be worth fading with TBT

It looks like TLT is starting to see distribution, probably some disappointment there.

There's not much leverage in TLT, but TBT the inverse leveraged ETF may be worth a look. I'd wait for a confirmed reversal.

Market Update, leaked? You decide.

We have seen F_E_D statements that were obviously leaked as the media outlets have the F_E_D statement before it comes out, it is just embargoed, this way they can talk like they know what they are saying right after the announcement, but who is to say someone in the copy machine department doesn't make a quick call to a friend on Wall Street in exchange for some coke, hookers and cash?

It's happened before, it's a bit harder to tell this time. Judging by the DIA I would say probably, but the SPY's lack of good confirmation leaves the question open. In any case, the market didn't like it and if you faded the rally in to the announcement, congratulations.

 DIA 1 min... inconclusive.

 The 2 min chart though shows distribution into the rally before 2:15

 The 5 min chart shows the extent of distribution, this is suspicious.

 And the 15 min hart, that quickly, definitely questionable.

 QQQ somewhat questionable.

 QQQ 15 min, VERY questionable

If the SPY looked like the rest, I would have made a 'fade the rally call", but there was actually accumulation in to the statement, albeit on a 1 min chart.

Well that's a hurdle that we crossed with little trouble.


Market Unimpressed with the Statement


I really don't think the F_E_D said anything new or even hinting at anything new. It's almost as if they slept through the meeting and made a couple of changes to a few words, but nothing that the market could sink its teeth in to.

What moved TLT

A fresh 10 year auction ended around the time TLT took off. Here were the wildly bullish results for the auction (maybe not so bullish for the market).

It was a $24 bb 10 year auction that came in at the second lowest yield EVER at 2.02%, the bid to cover was also the second highest at 3.53  and most incredible, indirect bidders (foreign governments mostly) came in with a take down of 61.9% of the auction compared to the last at 41.6% which is also the second highest on record.

Lets see what the f-e-d has to say in a few minutes...

Here is the catalyst behind the Treasury move...

Look at this move in TLT

TLT a Treasury ETF is typically considered a safe haven trade when the market declines, I'm not sure what is going on with it today, but I suspect we'll find out soon enough.

 TLT on volume.

Usually TLT and the SPY in red trade inversely, but the SPY hasn't seen a similar drop to TLT's climb.