Thursday, March 26, 2015

Daily Wrap

By my count that's 4 days of red closes with transports, the Dow-30 and the S&P-500 all red on the year. It seems like I've said that numerous times this year, without even looking at a chart that means we've experienced pretty decent volatility, but not much movement through the year which if we were to apply to a stock on a shorter timeframe (as the concept is the same), we might call it bearish "churning".

There seem to be two distinct concepts we are dealing with right now, first is the concept of fear being a lot stronger than greed, if you don't believe me see how long it took the last bull market to run up from the 2002/2003 base to the 2007 top and then how long it took the market to erase all of those gains plus another -15%, by my count it's about 5 years vs 18 months with most of the downside damage in 8 months. It's just human nature, shockingly, Fear is a more powerful emotion than greed.

Thus our nascent divergence forming the last 2-days which I warned several times because of where we wherein the market cycle, stood a higher than average chance of being run right over. This typically occurs on fundamental news that the market wasn't aware of and therefore has to discount on the fly like this morning's (or rather the overnight) start to the Yemen invasion by 9 MENA countries led by Saudi Arabia. Thus it seems that divergence was run over as it was not well formed and in an area (stage 4 decline) in which fear dominates and easily runs over divergences much more often than in any other part of the cycle, although I wouldn't say it's common.

The second concept is, :Once Wall Street starts a cycle no matter how big or small, they almost always see it through and I'm sure there are good reasons for that. In our particular case right now we are at the end of Q1 so firms will be engaging in Window Dressing or the "Art of Looking Smart" in which they dump their losers, buy the stocks that were the hottest on the quarter and when they come out with their holdings for the quarter or prospectus, they look like they picked all the winners, although it's a thin veil of deception, they do engage in it.

Whether Window Dressing is a factor, I don't really know, I didn't think it would be a factor at the end of the year and it wasn't, not on the upside as both the taken for granted Santa Rally and January Effect both failed to materialize. In fact what we do know from Q4 filings from some of the big guys like Soros or the top paid hedge fund manager over the last 4 years, Appaloosa's David Tepper, they sold a lot of stock and/or increased their puts and bearish bets, Soros by 600% in SPY puts, Tepper reduced equity exposure selling companies like AAPL and FB by 60% for Q4 2014 alone.

However, I'm not making the longer term/bigger picture case right now, I'm looking at the most probable outcome and that was as we said early in the week, increasing volatility both up and down. We've obviously seen that increase in volatility on the Downside as more than half the major averages are red year to date and the largest Index, the NYSE is red since the end of QE 3 back from Oct. 31st. Hopefully you understand very clearly why I wouldn't consider trading the market long for a bounce, the unlikely fundamental event that can roll over a divergence actually occurred (Yemen).

Picking up with the second concept, "Once Wall St. decides on a cycle, they rarely abandon it". today's candlestick closes on daily charts would seem to suggest that this is exactly what's going on, however we have to consider a 3rd concept and that's maximum pain on options expiration Friday and the pin that is usually right around Thursday's close and generally holds until about 2 p.m. at which time the market can jiggle all it wants, but the 3C data of the last 2 hours is some of the best of the week.

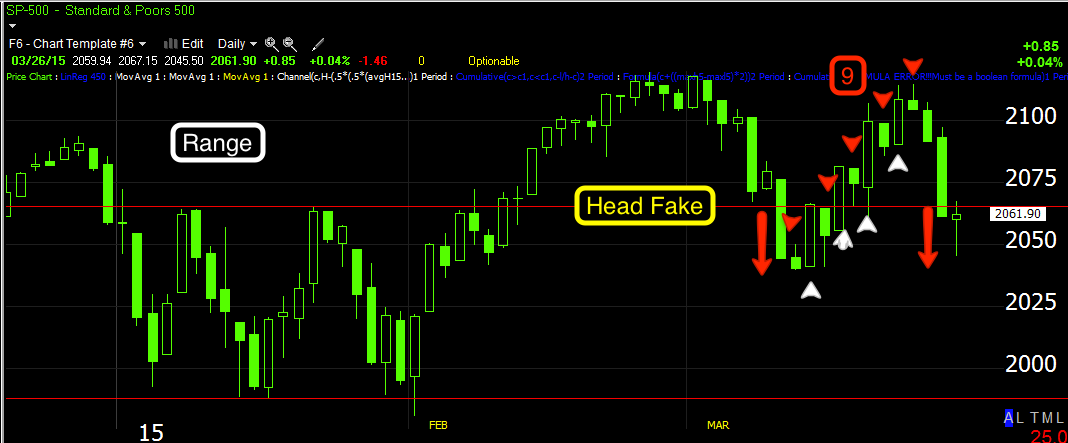
Today's daily candlestick close in most of the averages was a Star, a loss of downside momentum which could be related to a bounce , leading indicators and 3C charts suggest that although these are far from the strongest looking 3C charts or it could have to do with tomorrow's options expiration maximum pain pin to cause the highest dollar value of options to expire worthless since smart money generally writes them and is able to keep the premium which is generally where the juice is in options.

The SPX provides a decent model for most of the other averages' close today...
After 9 consecutive days of volatility and on and off closes, volatility dies at the top as indecision set in as usual and increased on the downside with it falling off today as we have a Star candle in almost all of the averages which is an indecision candle opening the door to a short term change in trend as we have been examining.

This is why I said I believe that just standing by and being patient is a win/win scenario right now as the shorts that have recently been opened or have been open a while work for us on a move to the downside, a bounce allows us to short some assets that have recently broken down and are providing interesting opportunities on a short term move to the upside, take NASDAQ Biotechs for example which closed with a Star (probable reversal candlestick)on increasing volume. We  recently picked up on biotechs again as they started giving signals, BioTechs Head's UpNASDAQ BIOTECHS / IBB and Quick Biotech (NASDAQ) Follow Up .

We are close to our long term Trend Channel stop out and they look quite a bit like a blow-off top.

The near term charts suggest a bounce as does the daily closing candlestik...
 The short term 2 min chart shows distribution at a recent possible blow-off top and a recent small positive divegrence for a minor bounce.

The longer 30 min chart which carries a much more important longer term trend is leading negative suggesting smart money has been selling in to this parabolic possible blow off top for some time. So IBB/NASDAQ Biotechs would be high on my list of potential candidates for short sale set-ups.

Transports on a bounce or Financials would also be of high interest to me. These are weak groups that I'd like to short in to price strength , however brief it may be. While it may be brief, I would not expect it to be mild. Increasing volatility is the one thing we were looking for this week which means whether on the downside or the upside, it's really the increase in volatility that matters as to the transition to stage 4 decline with moves to the downside that stick.

If Wall St. is going to make the effort to move an asset or the market, you can be sure they aren't going to settle on half measures and make it easy for anyone who wants to jump in short. No, they will make it looks as strong as they can to scare as many people out of their positions as they slide in to them. Or make it look as strong as possible so they have someone to sell to or sell short to, both trades come across the tape as a sale, so demand is what is needed and after the last 4 days, traders aren't going to just step up and start buying on a half a percent gain, as always, emotions need to be pushed to extremes to create the kind of movement their position sizes require.

It's my opinion based on the information gathered, that the market intends to bounce, so far we are not talking about a bounce like the February cycle or even the 3/11-3/13 bounce cycle, I mean a quite normal counter trend bounce within the last 4-days of decline, like if you were to look at the volatility around the September highs leading to the October lows, for example...
This is the SPX from the September 2014 highs to the October lows, the example I meant was perhaps something along the lines of the yellow box or the yellow arrow, but note by the yellow arrow volatility had increased by a lot and the downside from there got serious. While I wouldn't say this is the exact model, the point is, a "bounce within the already started downtrend". The yellow arrow is a +1.75% day, not even including the rally off the intraday lows. How much more volatile should we expect the present to be? I'd say quite a bit.

You've seen the Leading Indicators, you've seen the charts as they are. Here's an example using Index futures of how I would trade this and why...

I typically like to work from the long term probabilities to the short term probabilities. The fact is, the market needs to be analyzed in multiple timeframes as multiple trends all exist at once. If I ask you if you made money long or short on any given day, each of you could have a different answer and all be correct, it depends on the timeframe you are dealing with. For example if the market has lost -10% over the last week and one of you has been short the market over that period, you made money. However if within that -10% loss, say today saw a +1.5% gain and someone bought at the close yesterday, they are long and also made money. Thus multiple timeframe analysis is about finding the right tool for the job, the right trade for the trend.

 The concept is, the longer the chart, the stronger the 3C trend so this 1 day chart of ES/S&P E-mini Futures that shows a leading negative divegrence (light blue=3C) at the very area we said had to be broken so smart money could sell in to, which was the 2015 range. Traders will buy a breakout of a range, especially at new highs and that's what smart money needs to sell positions as large as theirs without turning the market against their position because of its size and predatory HFTs and traders front running.

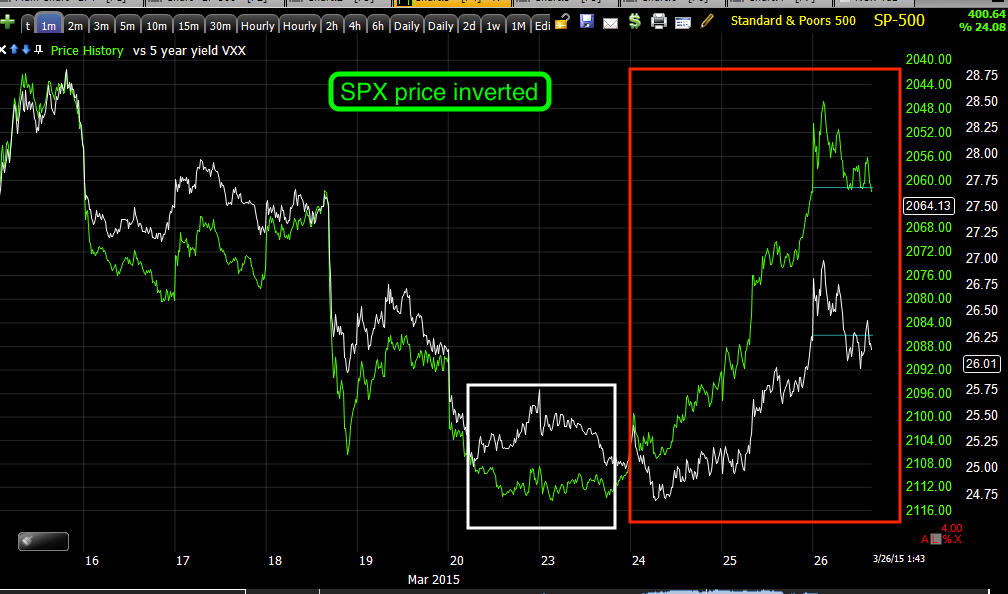
Since this is the worst this chart has looked, it tells me the big picture is very bearish.

A Very strong chart of NQ/NASDAQ 100 futures, but not quite as strong, the 4 hour shows the same area that needed to be broken on the upside before we'd see any real downside (yellow line) also shows strong 3C leading negative divergences. The point is to get multiple timeframe confirmation through multiple assets as most will move together (about 2/3rds).

 And a still very strong, but not quite as strong, but more detailed 60 min chart of TF/Russell 2000 futures shows the accumulation or stage 1 of the base we predicted when we closed our AAPL and QQQ puts on March 10th, expecting a bounce and expecting to see strong distribution in to it. This chart is also leading negative and it included the F_O_M_C knee jerk reaction, which I always warn, is almost always there and almost always wrong.

We've retraced the knee jerk move since the F_O_M_C, thus the knee jerk reaction or anyone who bought it is at a loss.

Now shorter term charts which show us shorter term trend like this 5 min NQ/NASDAQ 100 futures has the negative divegrence that sent prices lower this week and a small positive divergence now. This suggests a short term bounce, nothing much more as the 60 min, 4 hour and daily chart are all negative.

The 15 min ES/ S&P futures is a stronger timeframe and chart, it also shows the negative divergence at the highs that sent the market lower and a recent positive divegrence confirming the 5 min chart and telling us it's a bit stronger than just an intraday bounce.

Thus we take it all together and we get a near term bounce , one that will look powerful as Wall Street doesn't do anything in half measures, they have to cause movement and to do that they have to hit upon emotional extremes of fear and greed.

The longer term charts are the highest probability so they already tell us even before a bounce has begun, that the highest probabilities are that it will fail.

Thus I want to wait for the bounce and trade with the probabilities meaning wait until the bounce is looking extreme and showing short term negative divergences on these shorter charts that are now positive, I want to then short in to that strength or sell any longs I might want to be rid of.

In this way I let the trade come to me on my terms rather than chase it and I can confirm by the shorter term chart divergences that there is distribution in to higher prices, that smart money is selling or shorting and then I simply want to be doing what they are doing as money moves the market. These are among my favorite trades, I don't have to do anything until and unless the market proves my theory was correct, the trade comes to me on my terms at the time and place of my choosing rather than chasing it. The only thing this takes is the ability to be a little patient and a little patience can go a long way.

As for some assets we have recently talked about, we have a half size long in oil/USO, I intended to add the other half on a decline in USO near it's regional lows. I still believe this is a probability, although obviously the War in Yemen has changed the landscape for the present, thus I'll be patient and keep my eye on oil for the right opportunity.

Gold I have also expected to pull back a bit. Gold has gained as a flight to safety asset during the recent days of trouble in Yemen, but I believe it still has more basing work to be done before it can truly hold a trend reversal which I'm very interested in. Today's gap up in gold and lack of any further gains, leaving the daily chart with a Star on higher volume, possibly churning and negative divergences suggests I stay the course and wait for the anticipated pullback in gold.

Of course I mentioned a couple of assets on the short side I'm interested in, Biotechs, Transports and Financials, but there are numerous other stocks and a few groups that have caught my eye as well. Biotechs just didn't have the charts to consider a new short 2 weeks ago, as of last week, they started to change in character, thus if I can get a bounce there, I'd be interested in a short.


I think we pretty well covered leading indicators, bond yields, credit, etc. as well as the 3
C charts as far as what we have right now. If something else develops in futures, I'll update it as I usually do so long as my eyes are open.

That leaves us with internals and breadth.

Honestly I was a bit surprised by internals although perhaps I shouldn't have been. The Dominant Price/Volume Relationship among the component stocks that make up each of the averages was dominant in all but the Russell 2000 once again, the R2KL has been missing a Dominant P/V theme nearly 75% of the time over the last couple of weeks which is strange.

As for everything else, the Dow came in with a Dominant P/V with 16 stocks, the NASDAQ 100, 56 stocks anf the S&P 500, 188 stocks. The theme of the 4 possible scenarios was Close Down/Volume Down.

This is the theme that has the least next day bias, the most common theme in a bear market and the one I've nick-named, "Carry on" as in keep doing what you were doing as it doesn't have a strong next day bias so I take that as meaning keep building that base that I suspected needed to be widened out, thus is may look something like this...
Note the "W" shaped base I mentioned as a probability earlier today and note the new lows as a run on stops before any bounce.

The S&P sectors came in with 87 of 9 in the red led by Materials at +.23% and lagging with Utilities at -.84%.

The Morningstar groups were similar with only 175 of 238 in the red. This is a fairly dominant and close to oversold on a short term basis, condition, but the Dominant P/V relationship isn't there. This is another reason I suspect some more base building tomorrow during options expiration (weeklies).

A one day oversold P/V relationship would be something like Close Up/Volume Up or even Close Up/Volume Down if it were near the end of an uptrend on something like a bearish candlestick, like a star or hanging man.

As for breadth indicators they took a hit this week. Of all the NYSE stocks (the largest index), only 44% are above their 40 day moving average. Only 48.7% are above their 200-day moving average.

Viewed as a market of stocks rather than a falsely weighted stock market, we're pretty much already in a bear trend.

finally as for futures, there are some negative divergences starting for the overnight session, perhaps this brings us down to the base area proposed...
 ES/SPX futures leading negative since the cash close.

1 min NASDAQ futures doing the same.

Remember in multiple timeframe analysis the positive 7 and 10 min charts would suggest that any short term move lower be met with a bounce higher and since we need to move lower anyway to broaden out the base, it would make some sense.

There are hints of a slight positive in EUR/USD.

That will do it for tonight, I suspect tomorrow we'll have time to look at numerous trade set ups as I suspect things will be dull unless there's more unexpected news out of Yemen or some other corner of the world. Just watch, if we have the bounce I suspect, the media will call it a relief rally over Yemen and that the war or operation progressed so nicely, even though we have the signs well before that has happened. It's just the human mind needing to feel in control of something so out of control.


Have a great night!

Leading Indicators

*I captured these charts about an hour ago for the most part, but their trend should still be intact and their meaning as well, I'll double check them just incase anything is different*

Earlier this week, I mentioned the market's lower volatility, we had just come out of 9 consecutive days in the S&P-500 in which there was a close down, a close up, a close down, a close up and so on and so forth for 9 days. The volatility for each day's ATR was quite wide which is why early this week I said that volatility had dies down and that was worth taking note of. Changes in character lead to changes in trend. Then I showed you some previous tops like the September highs and more recent ones and showed you how the market can bounce back and forth with no direction that really holds until volatility makes its way back to the market.

Yesterday I explained again the 4 stages of a market or asset cycle, accumulation, mark-up, top and decline and I showed in every instance just how volatility preceded each of the transitions to the next stage whether from stage 1 to stage 2 or 2 to3, 3 to 4 or 4 back to 1. Volatility always manifests before a trend change and that's what I saw this week, the die off of volatility and though t it was worth noting.
Early 2015 was the obvious range with very defined resistance which is why we forecast in advance that there would be a head fake move above as retail traders would chase the breakout above a clear resistance area and smart money would sell in to their demand which is what all of the 3C chart and breadth charts show us as it happened and now. In early MArch the entire head fake move was retraced which below the area where long stops would be hit, made for a perfect area for a bounce which is what we first spotted on March 10th as we took action to protect profits in puts, Closing Down the AAPL and QQQ Puts for now

Since then, the market did bounce as we expected on MArch 10th and that's the 9 consecutive days of high volatility and daily ATRs (average True Range) with a small white arrow for each day up and a small red arrow for each day down as they alternated day after day for 89 days.

Then suddenly volatility died at the top of stage 3 distribution and the candle bodies were small, the die off of volatility. Since then, it has picked up the last 3 days as half of the major averages have not only retraced ALL of the F_O_M_C Knee Jerk reaction, but are also red Year to Date, 

Today's hammer suggests we see a bounce and it doesn't matter if there are a few days of upside, what matters now is that the volatility increases, as it does, we enter an area or stage that is ready to transition to stage 4 decline with the increased volatility so while the bounce (if it has strong volatility) may look very strong and may look like the market can't or won't break down, THIS IS EXACTLY WHAT WE HAVE BEEN LOOKING THE LAST SEVERAL DAYS FOR IN ORDER FOR THE MARKET TO BREAK DOWN.

As I often say, "Price can be deceiving".

The Hammer candle is almost enough to convince me we are going to bounce to the upside, especially with internals as shown in last night's Daily Wrap and Tuesday's both showing a strong short term 1-day oversold condition. This bounce is what we have expected and is also what we need for stage 4 decline to really make a move to the downside and for that move to stick.

As for Leading Indicators, I showed yesterday before the overnight surprise fundamental news sent the market lower, that they were in line to support a short term bounce. I also try to include the bigger picture so you know what the longer term probabilities are, in this way we can use the bounce to our advantage in selling or shorting in to it, replacing positions like UVXY or entering new put positions.

Leading Indicators...

The FX pair EUR/USd has had a strong correlation with market Index futures and they have moved in line with EUR/USD. However last week I pointed out that Index futures ran too far above the FX pair and that they'd need to come down. Like anything with the market, they overshot to the downside and that's part of increasing volatility. We'll see them overshoot again as the normal correlation gives way to stronger emotional instincts like fear and there will be less and less correlation between the two assets.

For now...

 EUR/USd is in a downtrend from the overnight and although there are some signs of positive 3C divergences or accumulation,  I expect that the main trend will be the EUR/USd continues to move lower generally while the Index futures bounce higher without the support of the EUR/USD as it makes its way lower.

This will put the Index futures in a place (above current levels) with no support from EUR/USD which you will see, has been all about support of the market. This tells us volatility is picking up, fear is building and the market starts acting more and more extreme which eventually, is what I'm looking for on a strong stage 4 decline move.

 This is the EUR/USd (red/green) vs ES/SPX Futures (purple).

Today is one of the first days in which the two have had nearly the opposite correlation as it looks like the market is trying to get ready to bounce, but the EUR/USd pair which is now acting as a leading indicator keeps moving broadly/generally lower which leaves any market bounce unsupported.

 This is the trend down in EUR/USd and ES on a 60 min chart from the February cycle's stage 3 top. The green arrow shows they are moving together in correlation in a stage 4 decline and then our most recent bounce from March 11th comes. This is where ES/SOPX futures (purple) ran too high above the support of EUR/USd and for days I had been saying ES will fall back down to EUR/USD and not only did it fall , but it overshot to the downside which is usually indicative of rising volatility and more fear to the point in which sellers don't care about correlation, they just panic and that's wen we get the sharp moves down, but volatility (whether up or down or both) still needs to increase.


I checked the single currency futures of EUR and $USD to make sure I understand the most likely trend for EUR/USD. below is the Euro single currency futures on a 7 min chart.

Note the Euro had 3C support as it moved higher and as it moved higher, EUR/USd moved higher as well. But now, note the negative 3C divegrence to the far right (now) in the Euro futures suggesting the Euro makes a move lower. This move lower in the Euro will pressure the E?UR/USd lower, which is what we already expected so this is additional confirmation. This also means that there's less support for any market bounce and it's more likely to fail although I have almost no doubt about it failing before it has even begun.

This is the $USd futures bellow (US Dollar Index)
 Note not only the positive 7 min divergence in the $USD, but also the head fake move in yellow, a stop run that we often see just before a trend reversal which in this case was to the upside. 3C is leading and supportive of higher $USd prices, thus this is the third asset confirming the EUR/USD moves lower and leaves the market on a bounce, with no support, thus shorting in to the bounce seems like the best course of action as everything is lining up to tell us any such bounce, no matter how strong it may look, will FAIL,

 Our Professional sentiment indicator (blue) vs the SPX (green) is also suggesting pros are getting ready for a short term bounce very soon.

 This is the SPX (green) vs High Yield Corporate Credit or HYG, the most often used lever of market manipulation. On an intraday basis, HYG and SPX are almost perfectly in sync. In fact the SPX has pulled back a little today since I captured this chart, but HYG continues higher supporting a short term move to the upside in the market (SPX, NASDAQ, Dow, Russell, etc.).


However, you can't just look at a map in 1 inch sections and expect to understand it, you must look at th whole thing.

This is a longer timeframe of HYG (high Yield Corp. Credit) vs the SPX (green). You can see that the February cycle's stage 4 decline to the left is being lef by HYG to the downside and then HYG provides minor support as we first discover the probability of a market bounce on March 10th as we closed Put positions, Closing Down the AAPL and QQQ Puts for now 
This is the date we closed the puts in the Mach 10, Closing Down the AAPL and QQQ Puts for now As you can see, we were only a day off.

I ust however remind you that even with HYG supporting the market very short term, the long term prospects are very bad as HY Credit has already entered a primary downtrend. As they say, Credit leads, stocks follow" so this downtrend in HYG should be leading the market lower despite what happens over the next few days.

Even HY Credit is leading the SPX (green) intradat since yesterday.

 However looking at the larger trend and you see HY Credit has been moving lower only giving the market some support at the accumulation area for the recent bounce of MArch 10-11th and March 13th, the "W" base. At #1, the F_O_M_C knee jerk reaction higher we warned about, Credit did not support the market but instead diverged lower.

High Yield Credit is a risk on asset for smart money the same as AAPL would be for retail traders. So why is smart money not buying risk in to the F_O_M_C knee jerk higher? Also at the stage 3 top of the cycle HY Credit is heading lower as the market makes a higher high. Again, Why is smart money not buying risk? Because they are too busy selling in to the bounce and shortly after Credit's leading divergence against the SPX was indeed a clue as to what was to come as the SPX moves lower AND IS NOW RED FOR THE YEAR TO DATE (2015) JUST LIKE THE DOW.

 Yields (red) move opposite bonds (the flight to safety trade), thus they tend to be excellent leading indicators pulling stocks (SPX in green) toward them so when 30 year yields trended lower during the last bounce, we knew it was safe to sell short in to the bounce as the market would eventually be pulled down to yields as if they were a magnet. At the green arrow you see the SPX pulled lower toward yields again as if they were a magnet for the market.


 Very short term bonds have sold off and yields have rallied providing short term support for the SPX (green) to bounce as we expect.

However, don't forget where the big picture lays.

Here I inverted the price of the SPX so you can see what VXX should be doing and it is not performing as well as it should in red, again, indicative of a bounce.

 Spot VIX has been in line with the SPX.

 Commodities are once again acting as a leading indicator since the end of QE3. In red you can see where commodities negatively diverged in price vs the SPX and pulled it lower and in white where they positively diverged and supported the SPX.

The main trend is lower, but near term there's support for a bounce. This chart alone tells us a bounce is a probability , but also it's failure is an even higher probability so how do we want to use that information we have in advance? I want to use the bounce to sell in to or short sell in to.


 This is the very near term positive divergence in commodities vs the SPX, however the chart above at the red area is an even larger divergence suggesting a move higher in the SPX wit this short term commodity chart's leading divergence and then a failure and a larger move lower.

Intraday, the TICK Index is signaling the market appears to want to pullback and widen out that base I mentioned that needed work early this morning. Being tomorrow is an options expiration Friday, little will get done, this could run in to next week.


And the custom TICK/SPY trend showing a larger break lower, short term capitulation or selling exhaustion in yellow and a rising trend of improving internals today, consistient with a short term bounce and failure of that bounce.


MArket Update: Bounce More Probable

After this morning's surprise news (non-discounted events in Yemen), it seemed a bit questionable whether or not the market would carry on with the original plan we saw surface a couple of days ago, a market bounce which in the bigger picture is really just an increase in volatility leading to the next stage, stage 4 DECLINE.

I'm almost done with a Leading Indicators post that will be out shortly, but the punch-line is the same as yesterday's, they are for the most part supportive, but only on avery short term basis and after that, they have serious damage that should pull the market much lower so we are set up in a good place in which if the market moves lower, our short positions are working for us and if it bounces, we know the highest probabilities are the bounce CAN'T hold and we can short in to that, thus a win/win scenario as long as you don't introduce long risk in the mean time.

Just based on the Sector and group performance yesterday and the Dominant Price/Volume Relationship, a bounce was highest probability, but now we have Bullish upside reversal candlesticks in place, "Hammer" as in "hammering out a bottom", things look even stronger for a bounce. However tomorrow is an op-ex pin day and they are dull and I still think the market needs to widen out its base and there's not enough time to do that.

Either way, it shouldn't matter unless you are planning on trying to piggy back a bounce which I think is exceptionally dangerous and trading against probabilities.
 A Star reversal candle in the SPY, increased volume would make it more effective.

A bullish Hammer in the Dow, again higher volume would make it more effective, but as I said above, we may not have enough time today to finish a wider base which may have to wait until tomorrow afternoon after the op-ex pin is lifted around 2 pm and possibly in to Monday.

Intraday, it looks like we will pullback a bit toward the goal of widening that base area...
 Today's intraday NYYSE breadth has improved from very negative -1250 to trending up, but recently breaking the trend and moving more toward the pullback intraday I said I though we needed to widen the base area to make it suitable to sustain even a short term bounce as a "V" base isn't sturdy enough for the kind of volatility we should expect.

The intraday SPY is just starting to turn negative enough to turn prices down and hopefully toward this morning's intraday lows where it should accumulate and create a stronger short term base for a 1-3 day bounce.

SPY 5 min is in line with the downtrend as much of the divergence was run-over, but it's leading positive today.

DIA intraday is also negative so it should turn down as TICK suggests.

However the DIA 5 min not only shows the larger negative divegrence sending prices lower from the last bounce, but a positive divegrence intact now for a decent volatility based bounce.


 Intraday the QQQ is also going negative to turn back down.

However it too has a 5 min positive divegrence still intact.

I'll be honest with you, for the kind of volatility we need to continue after the last 2 days, any bounce could look very scary and very strong, but it's the volatility that matters, the bounce will fail, just keep this in mind should this thing get off the ground so emotions don't overrule logic and probabilities.

 IWm is more or less in line intraday, it need to be as it has had the worst looking charts for a bounce.

This is about as good as it gets on a 2 min chart, but note the clear negative sending prices lower. We should see another negative in to higher prices.

Leading Indicators are coming next.


UVXY Trade Management

Friday the 13th of March, I took the UVXY (2x long short term VIX futures) off the table as I saw no further upside in it as the market was ready to bounce further and I wanted to preserve the +10% gains, here's the post, Taking UVXY (2x long VXX short Term VIX Futures) off the table for now.

I just replaced that position in the tracking portfolio as was always my plan as the bounce neared its end, that was just this Monday, Replacing UVXY long position and now it has a nearly +9% gain.


I'll likely close this one down for the time being as well if the market does as I suspect and broadens the base intraday.

Here are the charts and what I'm looking for...
 This is the SPY intraday. Earlier I mentioned it needs a larger base to bounce from and to do that, it needs to move down toward the intraday lows forming a "W" like base.

If this happens as I suspect it will and if we see stronger 3C accumulation in the averages, I'll take the UVXY long position (trades opposite the market) off the table , not only because of the increased probability of a market bounce and a VXX/UVXY pullback, but because I'll get a better price for it down there on the market pullback (as VXX/UVXY trade opposite the market averages).

If this were just VXX without the 2x leverage I may have considered holding it through a bounce as the big picture charts are very strong for a big move up in VXX/UVXY, I would just prefer to take the gains on this leveraged asset and re-enter at better pullback (for VXX/UVXY) prices.

As for the charts, remember VXX is short term VIX futures and UVXY is the 2x leveraged ETF of VXX).

 VXX 2 min, very near term has a minor negative divegrence as it looks like someone is taking some gains off the table in anticipation of a market bounce.

The UVXY chart should give the same signals to confirm VXX, this 3 min stronger timeframe does as you can see, the upside since the last long entry was confirmed by 3C as it moved up with price, but in this area it is starting to diverge.

The 5 min chart shows the cycle better with accumulation at the Tuesday lows (we entered late Monday) and we have a negative divegrence now. This is just for this small area.

For longer term positions, you must consider the longer term charts and this is why I keep coming back to VXX/UVXY at reasonable pullback areas and closing the position before they pullback again, however a part of me wants to just stick out the longer term trend trade, if it weren't for the leverage of UVXY vs VXX, I might have just decided to stick with it through any market bounce.


 This is the 15 min chart with an amazingly large positive divegrence, this not only suggests a large primary uptrend in VIX short term futures, but a large primary downtrend in the market.

The longer/stronger 30 min chart is even more impressive. Note the initial positive divegrence to the left around November/December and its run up. Since then on the pullback, it looks like VXX has seen strong accumulation of lower prices as smart money or deep pockets build a longer term trend position on what would be a large "W" or Double base between the two positive divergences.

These are the charts that make me want to just stick with a longer term trend trade, but I can't just walk away from a 10% gain in 3 days and the ability to replace it at better prices.