Wednesday, November 27, 2013

Daily Wrap

Picking up where I left off with the last post...

Well here's a lever I haven't seen in a while, it's funny how these things move in phases, today it was using the most heavily weighted stocks in an index to push it higher. As few other levers are working or working as well as they use to, today's very light volume was a perfect day to just knock out the ask stack on heavily weighted stocks.

I came up with a few examples without spending all night on it. Take the Dow-30 which closed up +0.15% today, really that's negligible, but it would have been worse if it were not for taking out the ask stack. Only 8 of 30 stocks closed greater that +.50%

MMM of the Dow closed second from the top at +1.03% however as far as weight goes, MMM is the 5th heaviest weighted stock in the Dow at 5.28%, this is about the same weight as T, PFE, GE, INTC and CSCO combined. 

IBM closed 3rd from the top at +0.95%, IBM's weight is a hefty 7.08% of the Dow 30, this is about the same as T, PFE, GE, INTC, CSCO and add MSFT and IBM still holds more weight as the other 6 Dow components combined are worth a total of 6.77% of the Dow vs IBM's 7.08%, so with those 2 stocks alone closing up near 1%, the Dow was saved from a red close.

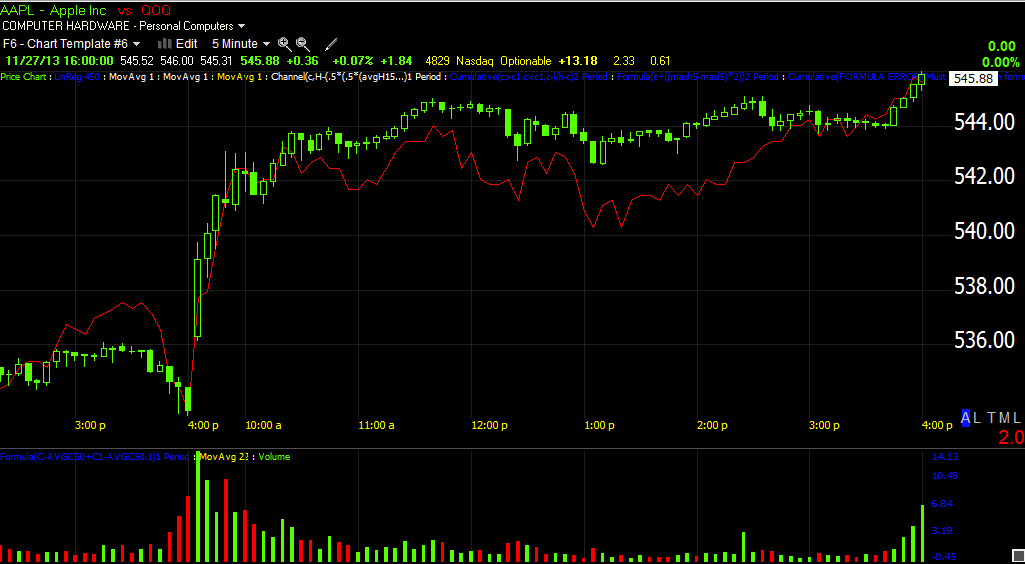
Taking a quick look at the SP-500 which use to use a market capitalization method to weight the index, but now uses the more specific "Float" Market Cap of all shares publicly available to be traded). Not surprisingly, the most weighted stock in the SPX is AAPL which closed up +2.34% today.

I took the top 10 most heavily weighted SPX stocks and combined their closing percentage and divided by 10, I came out with +.25% while the SPX closed at +.24%,  that's pretty amazing. AAPL must really carry some weight because only 4 of the top 10 closed green and AAPL was the biggest gainer.

NASDAQ has a proprietary weighting system and you can only find out the current weighting with a $10,000 a year NASDAQ subscription, but from the post we know that AAPL has been around 20% of the weight alone, I added up the bottom 50 of the NASDAQ 100 and their combined weight was about the same as AAPL's, so with AAPL up over 2% today, you can see how the NASDAQ and SPX closed green when no other levers were working and TICK wasn't indicating any great number of stocks moving.

AAPL got some intraday 3C help, but it was thin, it didn't need to be much more with volume so light and there's still problems so I'm fine with a short there.
 Intraday EOD help

Still at the next timeframe, 2 mins, still trouble so intraday today was weak (3C signal).


The cheaper stocks and the most shorted also improved in the afternoon, 

The R3K MSI improved in the afternoon.

As has been apparent, distribution in HYG was going to knock that lever out of the game and sure enough...
 HYG (green) vs the QQQ today and falling in to the close, but this shouldn't have been a surprise as we've been covering trouble there...

5 min leading negative divergence/distribution in HYG.

It looks like Credit sold off because of the run up.

High Yield put in another day of losses...
HY credit

No matter what the market is doing, protection is bid so someone is a bit worried, checkout spot VIX today.
Spot vix vs SPY (green)

We also got news that NYSE Margin Debt has hit another all-time high. Investor "Net Worth" defined as Total free credit in a margin account less total margin debt is at all-time lows.
Relative to the economy, margin debt has only been higher at the peak of 2000 and 2007.

Deutsche Bank wrote about this in an article called, "Red Flag!" and compared their findings to those at 2000 and 2007 and said they were indistinguishable.

The dominant Price/Volume relationship was close up/ volume down which is the most bearish of the 4 possibilities, but considering the holiday week, we may give that one a pass.

Interestingly though, futures have something going on....
 The carry pair EUR/JPY looks to have taken a pretty sizable hit since about 6 p.m. EDT.

I've been talking about some accumulation in the Yen, but...?
The Yen has moved up on a positive divegrence, although the carry pairs drop seems larger. We'll see what happens, I'll check in on this later, but very interesting considering the market couldn't put anything together without the NY F_E_Ds open markets desk knocking out AAPL's offer stack.

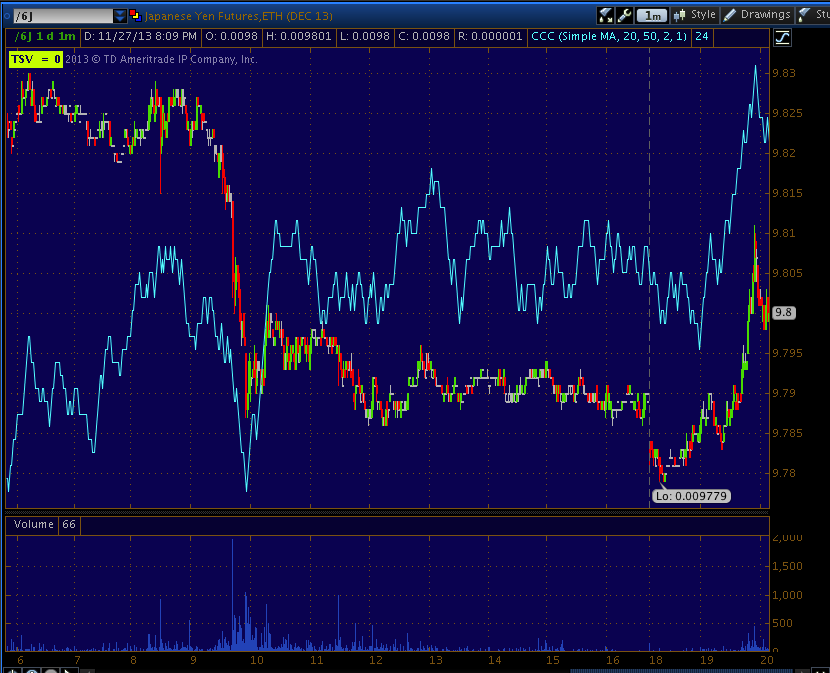
So far there hasn't been any reaction in Index futures, but NQ doesn't look too hot.
I suppose the divergence makes sense as today was almost exactly like yesterday, NASDAQ and R2K up +.72% and +.60% respectively and SPX and DOW  up +0.25% and 0.15% respectively.

I don't see any other immediate reactions, but I'll definitely be taking a look later tonight.

I wish everyone a Happy Thanksgiving, US markets are closed tomorrow and a half day Friday.


Plunge Protection Team Saves Christmas?

Undoubtedly you've heard of the PPT, many of you might think it's a tin-foil hat conspiracy, however did you ever think you'd see the day when your own country spied on all of your electronic private communications and no one cared or did anything about it?

I sure didn't.

In any case, in 2009 myself and David DT ( A Russian trader many of you know) were trading together (over phone or instant message) and we got so good at picking out areas where the PPT would come in to the market, we could actually call it 10 minutes before it happened...New low in March of 2009? I don't think so, the PPT were there every time the market came within a few percent of breaking down.

Today would have been really easy for them to work because volume was so low, first let me show you who they are, then why they'd be active today and then the tell-tale signs.

The actual name, "President's Working Group on Financial Markets", called by Wall Street and the Washington Post, "the Plunge Protection Team".

Officially created by Executive Order 12631 

They released this during the 2008 Financial Crisis... "On October 6, 2008, the working group issued a statement indicating that it was taking multiple actions available to it in order to attempt to stabilize the financial system, although purchase of stock shares was not part of the statement.[16] The government may wind up owning shares in the firms to which it provided loans, as they will receive warrants as collateral for these loans.

The official members...1) Secretary of the Treasury, 2) the Chair of the F_E_D, 3) chair of the SEC and 4) Chair of the Commodities Futures Trading Commission (CFTC)

It is well known and established that the actual working arm of the group is the "Open Markets" trading desk at the NY F_E_D, Brian Sack use to run it and quite controversially.

In the last 2-days I mentioned the NY F_E_D's trading desk in this context 4 times, 

"I doubt they'll let anything bad happen in front of Black Friday even if the NY F_E_D's open markets desk has to buy up everything"

WHY? This isn't even about the market really, it's about consumer sentiment in front of the biggest shopping day of the year. Did you know a large percentage of retailers run at a loss all year and make all of their profits during the holiday season? It's obvious, it's about sentiment in an economy that is really rough and it's not going to help OB with his popularity ratings, especially if Black Friday flops, the OB Care will catch a lot of the blame and note that at least half of the members of the PPT are his cabinet members and others are his nomination.

Why do I think PPT?

Simply there was no other place for the pump, I'll check the most heavily weighted stocks, but I'm guessing on low volume, that's exactly where they did this and I'll show you some proof. The money they'd have to spend on a low volume day like this vs the possible repercussions make it well worth it.

 The NYSE Tick is probably the most damning evidence, as you can see, there was no mass movement of a majority of stocks higher in to the close, this suggests only a few stocks moved higher to effect the ramp and the way the major averages are weighted, they can but a couple of stocks in the Dow and 1 or 2 in the NASDAQ and move the entire market, all they have to do is take out the ask stack which isn't hard to do or expensive on a day like this.

 The SPOT VIX didn't crash, but went the opposite of what you'd expect after having looked at the NASDAQ 100

This is short term VIX futures in green vs the QQQ in red, they were not knocked down either which is a typical lever used to manipulate the market higher.

Why wasn't short term futures taken down? Simple, there was strong demand for protection and to take out the ask stack there would have cost a lot of money.

 HYG in green vs the QQQ in red, another lever commonly used, but not surprisingly considering HY credit and the 3C chart, HYG went the opposite direction, it's a wonder it didn't trigger some negative market arbitrage.

TLT pushed lower is a lever to ramp the market, but that didn't happen as you can see, again I'm surprised this didn't cause some negative market arbitrage, maybe it did and they had to compensate.


 And the Yen wasn't pushed around so none of the carry pairs could have lifted the market.

The only thing left is using the strange weighting of the averages and buying the most heavily weighted stocks, for example AAPL use to have nearly 20% of the NASDAQ 100's weight, this was the same as the bottom 50 NASDAQ 100 stocks COMBINED, 1 stock can move an entire average that much while the others do nothing...THIS IS WHY THE NYSE TICK WAS SO NEUTRAL.

And the proof...
This is AAPL in green and the NASDAQ 100/QQQ in red, notice anything?


MCP Long

I'm just reiterating MCP long, I really like this one.

 60m

15 m

Quick Update

I'm not sure what they are trying to use to ramp the market or hold in to the close, I can see TICK is breaking down, HYG is breaking down, VXX is still pinned and EUR/JY looks like its out of the game.

 The earlier channel just preceding the break of it lifted some of the averages more than others, but that's breaking down.

HYG is retreating and moving like HU Credit, it looks like they don't want to hold that in to Black Friday.

These are the 3 min signals in VXX in which they have knocked it down at each attempt to run higher which would push the market lower, but even in the face of that, demand is pushing VXX up as there's obvious demand for protection.

USO- Reiterate Long

The USO position I'm so fond of, but I prefer a 2x leveraged ETF, as you know got a knee-jerk kick lower on Iran/Saudi conflict, however the intraday charts look really good. I suspected they would as the long term charts already have a commitment, so why not accumulate a discount?

I like USO here and now long and I think a stop can be placed just a bit below as long as it's not obvious and you have very little risk as well (assuming you are using reasonable risk management).


Opening AAPL Jan $550 Put

I was going to say...

"I'd open an AAPL short equity position, but I'm not going to just because I'd prefer Puts and the upside momentum intraday isn't there to reduce the premium, if it shows up, then I'd likely go for AAPL Puts."

To be clear, I am not opposed to an AAPL short equity position here.

However, I can't pass this up, AAPL Jan $550 put position. Perhaps after an initial momentum move and a correction I'd switch over to an equity short if I felt the 30/60 min charts were deteriorating more.

Quick Market Update

As I said early this week, it's unlikely considering how many just got shafted on their insurance (Blue Cross Blue Shield of Florida set to cut 80% of Florida policies-I think some 300,000+ have been cut), then there are plenty of Consumer Discretionary warnings right in front of Black Friday, I don't think they'd let the market have a negative close or a bad close that would further dampen sentiment on this all important retail weekend.

VIX futures intraday are almost pinned, I noticed this too yesterday. HYG is trying to hold up, but the trend in credit is clear. Yields may have been messed with a little to form some support, it's hard to say, but in the end there are really 3 charts or so that sum up why positions were entered over the last several weeks and specifically yesterday in the "Trading Portfolio" experiment.


 As the SPY is just about to go red, a small "Steering" positive divegrence pushes it back up, I honestly would not be surprised if the NY F_E_D's trading desk was on watch through the low volume trading day, this isn't tin foil conspiracy stuff, this is executive order, I'll get it for you if you like and that little intraday divegrence is exactly why we use the 3C intraday charts.

 VXX is outperforming on the whole as the SPX (green) is inverted so you can see the correlation, but there are intraday negatives that aren't pushing VXX down, they look like they are there to pin it and with low volume they can keep providing supply for any small bid stack and we'd have a 3C signal like that with price flattish.

This is the SPX heading back toward the HYG intraday after breaking off to the downside, the signals for weakness are already in place so a break to the downside is not anything novel.

However if we are going to look at credit, lets look at one that's not a lever of manipulation, High Yield...


This is a very different perspective and even adding HYG on a longer basis, you'll see the negative bias.

 Yields are up today, that can be mildly supportive, but really most of the market is pretty dull, sentiment indicators are flat, so are many others.

The IWM longer term chart and Channel Buster though are where I place probabilities and why I opened SRTY long (3x short IWM/Russell 2000) yesterday and maintain other positions.

The longer term , more powerful VIX futures like the 15 min

And the 60 min.
 And again, add Credit to that, you have nearly all the components of arbitrage and it doesn't look good for market bulls.

HY Credit vs SPX

AAPL Charts...

Yesterday I put out several posts about AAPL and its job with the COMPQX, but also deterioration.

The last major call in AAPL was a long position, calls were opened for it, although I do expect the larger trend to be down so this is actually an ideal area to look for an entry.

This is the last major update when I still had the AAPL call position open on Friday 11/22

In fact, the VERY same triangle that broke out, was the very same triangle posted above last Friday, linked above.

 AAPL breakout from the bearish descending triangle, this is the post from last week and the exact chart in which I was looking for an AAPL breakout and that's why I had opened AAPL call positions.

This chart is from last Friday's post, looking for a breakout above the triangle, it doesn't always happen right when you want it to, but the 3C signals were there and it did do what we were looking for.

 This is the current 5 min view of the b/o fro the same triangle, note the increasingly parabolic move, in my experience I never trust a parabolic move, they trend to create a true parabola and fail in like manner to the way they started.

 My Trend Channel set to 30 min held the entire move so a break below $540 would represent a change in character for this portion of the move.

 A wider 60 min Trend Channel holds several trends, her around $535.50 (by the time the channel arrives) would be a significant change in character for the move.


This is my X-Over Screen, initially used for weeding out false crossovers or "Whiplashing", but since has acted as a neat little trading system of its own. All 3 indicators have to fire for a short or long or BTS/Sell. The price moving averages in the top window (10-sma and 22 sma yellow and blue respectively), the custom indicator and 22-sma in the middle window, the code for the indicator is below and finally a normal 14 period Wilder's RSI with smoothing (Wilder's) and it must be above or below the 50 line for a signal, also watch for divergences. You can see a short trade and a long, the type of trade depends on the timeframe you set it to, this is a 30 min chart good for a quick swing trade.


This is the code for the Custom Cumulative Indicator in the middle window (yellow) with a 22-bar moving average (blue). In TC2000 the code may need to be adjusted so feel free to send me a screen shot and I'll double check your indicator looks right.

*Make sure you use custom CUMULATIVE indicator and enter the code as seen, I copy and pasted it for you below.

Code:

c-avgc10>0 and avgc20>(avgc20+avgc20.1+avgc20.2)/3
c-avgc10<0 and="" avgc20.1="" avgc20.2="" avgc20="" b="">
1+1


 Intraday 1 min, you can see a positive near the close yesterday, as usual the closing 3C signal tends to play out and pick up where it left off the next day.

2 min chart

3 min chart. Notice how each is a little less extreme than the former? This is "migration of a divegrence", it actually shows the divergence is valid and getting stronger.

 At the "A" and "B" I want you to imagine a red arrow running from left to right, that is a large relative negative divegrence. The green arrows show 3C confirming price movement which just means nothing unexpected is happening in underlying trade.

However the current signal is both negative intraday and leading negative, it was the intraday charts that needed to go negative as they act as the key to unleash the longer charts' 3C momentum or signal that is coiling up like a spring.


 We saw an island bottom on the 5 min chart with 3C accumulation of it, again proof that smart money buys in to weakness and sells in to strength. The Island bottom also represented a head fake move just before the upside reversal.


 The 10 min chart is why I believe in an AAPL short as well as the 5 min, both leading negative, but short duration there were signals for a bounce, that is why the AAPL calls were opened and you can see that in last Friday's post linked above.

These charts just needed the faster timeframes to go negative, they should return to making new leading lows.

The 15 min chart and once again, note where the divergence really got negative and the breakout above the range, again this goes to how Wall Street accumulates and in this case, distributes.

I like AAPL short for a trading position a lot, whether as a Put position or equity short, I'm not sure yet, it depends on the set up and the signals at the time, but if I wasn't trying to be careful with not adding too much to the trading portfolio right off the bat, I wouldn't have any problem with shorting AAPL here.

AAPL Update

Watch AAPL, it looks like a parabolic move, the move up which I thought we'd get, but not too serious is one of the reasons I waited on AAPL which I see as a swing/position, but not quite a trend short, there's not enough data to confirm and support a trend.

Watch the 5 min chart, you can see the parabolic move rounding over, for an AAPL equity short, a move below $540 would interest me, a stop can be placed just above recent highs, but don't make it obvious, I'd rather have a wider stop and fewer shares.

Charts coming.

Will be adding XLF (Financials) short or FAZ (3x short Financials) long to the Trading Portfolio

I'm trying not to fill this model up too quick, especially because I want to leave room for actual trading of shorter positions, where opportunities are available, but some of these are just too difficult to pass up.

You might consider this a reiteration of XLF short / FAZ long Trade Ideas.

Take a look at XLF and also note the very tight and somewhat quiet recent range, quiet markets are dangerous markets, as most of you know and if you have kids you'll understand, "A quiet market is like the kids in the room next door being a little too quiet, you know they're up to something" and in fact these flat ranges are one of my favorite scans, where nothing "appears" to be happening.

XLF...
 XLF intraday 1 min, note the tight flat range in yellow over the last several days, I'll be marking alerts on either side of the range, but the 3C activity at the same area is pretty clear among many timeframes.

 Here's a closer intraday look, still weak.

This is the 2-min chart, it has very much the same look at the same area, there are smaller BTD accumulation areas in white, but this is not accumulation on any scale more than what's already occurred since then.

 This is the 2 min intraday, also showing weakness at today's intraday highs.

 The 5 min chart again with the same look, at the same area, except the 5 min chart is generally where we draw the line between intraday and institutional.

 The 10 min, note where the divergence starts, if you understand why head fake moves (like failed breakouts/bull traps) are important, then you'll understand perfectly why this chart is divergent where it is, if not please read my two articles linked on the member's site, "Understanding the Head Fake Move"

 The 15 min chart with the 10/9 cycle accumulation, note the size of accumulation on a larger/longer chart and the size of the cycle, these are proportional. 3C is hitting a new leading negative low, we use to trade almost exclusively off 15 min signals, the fact we have much larger signals for a much larger time shows a much larger event taking place, THIS IS WHY I HAVE OFTEN MADE REFERENCE TO THIS BEING A "HISTORIC MARKET AND OPPORTUNITY".


The 30 min chart, note past divergences and the size and role they played and note the current leading negative at a new low on the chart, also the same area.

I'll let you know if I do see a great opening for FAZ, I do have an open position and will continue to do  maintain it