Monday, March 18, 2013

Daily Market Wrap: "Give my regards to Mrs. Merkel"

To say today didn't have its share of oddities would be an unusual day indeed as the day just gets more and more strange, the VERY latest is confirmation that there is indeed some communication among the Eurocrats on these horrendous plans, they just lack any sort of common sense.

Cyprus' president, Anastasiades (I've given up on trying to remember his name), said to Olli Rehn ( European Commissioner for Economic and Monetary Affairs and the Euro and vice president of the European Commission),

“When I warned you that there would not be a parliamentary majority to pass the agreement, you didn’t want to listen. Give my regards to Mrs Merkel.

This is one of those comments my friends and I would read and say, "Oh Snap!"


Bad blood? Sounds like it.

For a timeline of events, check this Reuters article, it's actually fascinating how many temper tantrums there were and other EU officials just playing games on their smart phones in the corridors-maybe if they were using the calculator instead?

Anastasiades also delivered the same message to a CDU official close to Merkel according to Ekathimerini.com ,

"Anastasiades is also reported to have spoken to German MEP Elmar Brok, a member of Chancellor Angela Merkel’s CDU party who is close to the German leader.
According to Mega TV, Anastasiades is reported to have said to Rehn and Brok: “When I warned you that there would not be a parliamentary majority to pass the agreement, you didn’t want to listen. Give my regards to Mrs Merkel.”

Oh Snap!

In any case, however things happened (ALWAYS BELIVE WHAT YOU READ), one thing seems sure from the moment I saw the market open, it seems someone promised market makers, specialists and others who would have been otherwise caught with a massive 2% gap open loss, to keep their mouths shut and actions in line with "normal" quad-witching and if that is done, you'll not only get back to the gap, but the old NYSE trick of opening the market at the lows, the specialists buys the lows and then sells the reversal, was the old trick pulled out as is is obvious from at least Saxo-Bank president that he had heard these rumors earlier in the week.

What makes me say this? First of all this is a general concept/theory, how it all went down is anyone's guess, but looking at the open and the high degree of correlation among risk asset classes, everything was in place to get back to the gap, I've never seen anyone so eager to buy the gap down open of such an uncertain situation and believe they would not have without assurances and while we got back to the gap (pretty much) and seemed to have a somewhat normal day, there are some strong signals that this was not the case and I will show you all of this, you can probably fill in some blanks from there.

One more thing, understand that any hint of a rumor of this getting out would have seen billions pulled out of Cypriot banks instantly rendering the entire rescue plan (that supposedly would have or may still see their two largest banks fail as early as their opening this week), if the deposits aren't there, then the rate or percentage increases to whatever it needs to be to get to the theft of $5.3 billion dollars from private savers.

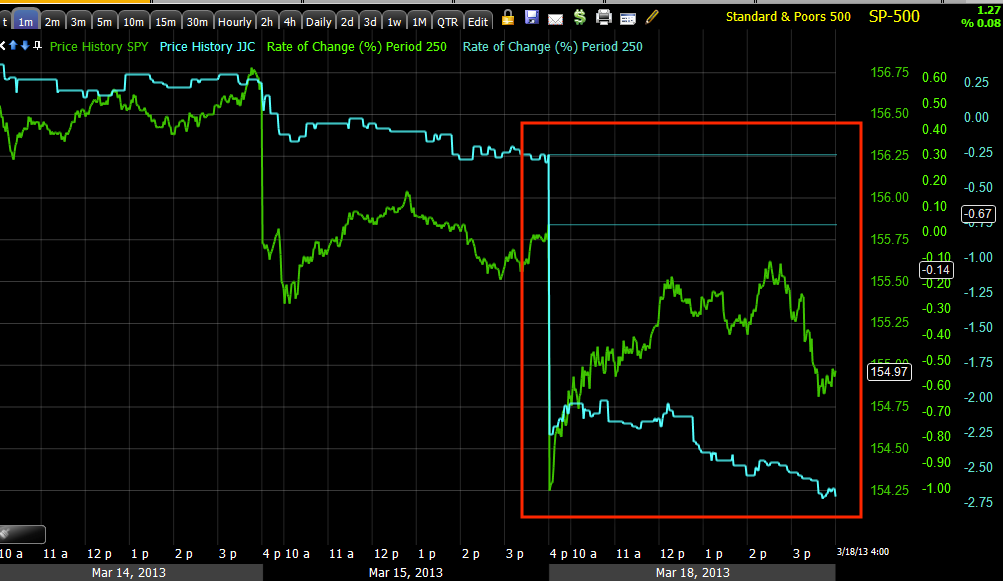
First the opening divergences...
 DIA 1 min

 QQQ 1 min

SPY 1 min-

All 3 went from leading negative divergences to VERY strong leading positive divergences right on the open and price did its thing from there, you don't have to fill the gap, just do what NYSE specialists do (as they chose the opening price unlike the market demand at the NASDAQ-that's right, the NYSE specialist choses the opening price based on their assessment of demand and they even chose when to open a particular stock-it doesn't have to be at 9:30-I've been burned before), chose a low open in which you think will be the lows, buy it, ride it and dump it-instant profits and a technique day traders use to use when trading the NYSE.

As for the incredible amount of risk asset correlation, there's almost no possible way to see this kind of thing without something going on, first CONTEXT...
The ES model is never more than 4 points away from ES and most of the time around 2 points, this tells us risk assets were highly correlated. If we jump to our Leading Indicators/Risk Asset layout, this can be seen clearly, although I suspect it will look much different tomorrow.

All assets are compared to the SPX unless otherwise noted.

 The longer term chart for the year of High Yield Credit which erased all 2013 gins in 2 days last Thursday and Friday-talk about volatility, but it was ramped today with other risk assets for the express purpose of filling in the gap in my opinion, which I held early today and posted it.

 HY Credit intraday is humming right along with the SPX today, looks a lot different than Friday and from a quick eyeball, has still lost all of 2013's gains.

 The Euro, even though it took a real beating and didn't quite make $1.30, was pretty close to in line with the SPX.

 Longer term, the correlation that was once like glue is now deeply dislocated, this can't be viewed as anything other than bearish as it sends the $USD higher which pressures nearly every risk asset class.

 HIO longer term is severely dislocated with the SPX as traders have moved away from High Yielding Income.

 Ooops, this is out of order, but High Yield Corp. credit intraday is moving right along with the SPX and even trying to hold it up at the EOD.

 Here's HIO intraday, also stuck to the SPX, unlike last week or most of the year.

 Junk Credit which is also longer term dislocated from the SPX is also moving right along with all other risk assets, even the close is unique in that they all look almost exactly the same.

Here's HYG longer term, it's dislocated, Junk looks the same.

However there wasn't much demand for the goods that are needed to make things for a happy economy as you can see in commodities and Dr. Copper.

 Commodities intraday vs the SPX

 Commods on a longer term basis are also negatively dislocated.

 Dr. copper isn't bid, it wasn't needed and there isn't any demand, maybe some demand for the slightly heavier and more yellow metal though as you'll see.

Dr. Copper vs. the SPX longer term.

As for currencies...


 The $USD seemed to kill the party at the close, as it broke above some intraday resistance, the SPX lost ground even though risk assets held their bid.

 Bigger view of the $USD, as I thought, in devaluation, the Dollar gets bought.

 Speaking of which, the Yen intraday vs the SPX, the late day Yen strength also weighed on the SPX it seems.

 Longer term, to the left a normal carry correlation, to the right, any consolidation or threat of the Yen moving higher upsets the market as volatility/chop pick up.

 The EUR/USD not quite making $1.30, better luck tomorrow Mr. Draghi or should I say Merkel?

The EUR/USD trendline break, the question is how long can the ECB support the Euro with a rising $USD?

As to several assets that seemed to show things weren't as hunky-dory as they seemed...
 Yields didn't follow the SPX at all, so we seemingly still have an issue with major 10-year and other bond holders looking for a safe haven asset and not willing to give it up as I wrote about yesterday.

 GLD ended up with a much nicer positive divergence by EOD than I expected and I posted on it earlier expecting some positive movement, the 1 min

 The 3 min with a big divergence

 And the 5 min, all went strongly leading toward the EOD, another flight to safety and...

Gold was able to manage this as the $USD was higher, not typical.

 The flight to safety trade in Treasuries has been picking up steam as well, the 10 min TLT chart.

 The 30 min chart leading at a new high


And you already saw the ViX futures in the last post, it seems the ViX was bid today as traders were seeking out protection, take a look at the relative levels of the SPX vs the VIX and specifically today.

As for breadth indications, all went downhill, here are a couple of note.

 % of all NYSE stocks trading 2 standard deviations above their 40-day moving averages, this should be rising, not falling and the last several days have seen the percentage fall from 29% to 17%!

 % of all NYSE stocks trading above their 40-day moving averages, from topping at 85%, this too should also rise or at least maintain, we're now falling under 60%, 25 percentage points.

 The 4 wek New High/New Low Ratio has taken a very sharp turn to the downside in to higher prices.

And the McClellan Oscillator is not only long term divergent and crossing below zero, but has a pretty sharp divergence locally.

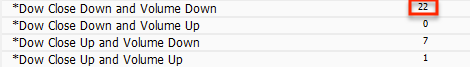
Finally as a sort of measure of breadth, the Dominant Price Volume Relationship which isn't as useful tonight because volume will be down no matter what after Quadruple Witching, but the extent of the component stocks down today as risk assets were so tightly correlated shows there was more running toward safety.

All 4 major averages are Price Down/Volume Down, but look at the components and how many were down, this would certainly have been a dominant P/V signal had it not been for op-ex Friday.


As far as Futures go tonight, there's a recent slight uptick swing, I'm not very interested in it at this point, but will be watching to see if it gets more interesting or if signals get more interesting.

In the VERY immediate future, see my post earlier today on Gold/GLD, I think the April Calls are going to see a nice momentum move, I don't care if GLD slowly drifts higher until April, I want to close that call position in to momentum and then look at a new position, I think that is going to be the next trade to need management.

Tomorrow should be interesting, Cyprus vs. Germany vs. Russia.


Cyprus Update- From Bad to Worse

Tomorrow Cypriot banks were scheduled to open as today was a bank holiday, last night I said, "Get ready to hear those two words, Bank Holiday a lot more" and sure enough, ahead of tomorrow's vote in parliament, bans are scheduled to be closed through Thursday, but interestingly as noted, anyone who went to an ATM while there was still money in it, was unable to take out any money that was part of what was set aside from their personal account for the levy, which in itself is a fluid situation.


To make matters more confusing overnight, we already know that the Cypriot President said the 6.75/9.9% tax/levy was a good deal and that Germany had originally come in looking for 40% of total deposits. Overnight the ECB said it DID NOT insist on a bank levy, last night German Finance Minister Schauble blamed the ECB, Trokia and Cyprus for the levy structure, so now every key player who is said to have imposed this deal is quickly denying it, they see how they have caused a bigger crisis and ONCE AGAIN WE HAVE ANOTHER FOULED UP EUROPEAN BAILOUT WITH ALMOST NO THOUGHT PUT IN TO IT WHATSOEVER.

Russia added to the confusion overnight when they said they saw no Russian Capital Flight out of Cypriot banks, how could they when the banks have been and remain closed? This comes on top of the news the Russians are sending a small fleet of destroyers and other ships in to the Mediterranean. Then Russia said they may "Reconsider their role"in a Cypriot rescue following the bank tax as Russia was NOT consulted. Russia was said to be considering loosening some of their loan term agreements with Cyprus.

Russian Deputy Economic Minister then said this move casts doubt on the entire EU banking system, hinting Russian funds will find another offshore location outsside of the EU. When we talk about Russian funds we are not talking about the average Russian citizen, we are talking about massive deposits from Russian Oligarchs, this is why the EU shot itself in the foot with a so called, "Bazooka". I have done follow-ups on every EU bailout plan and each one is worse than the last, it's as if there's absolutely no communication between the parties, they announce a grand scheme that is obvious at the onset as a failure or worse, the consequences of their plans are ALWAYS worse than the actual event they are trying to fix.

Cyprus' bailout in absolute terms is minuscule, $10bn Eur., however the net effect may be one of the biggest mistakes the EU has made, just like the Senkaku Islands are seemingly a small ordeal, but threaten a much wider confrontation, one that has already ripped a gapping hole in Japanese exports to China. I'M NOT SAYING THIS TO BE DRAMATIC, BUT I HAVE NEVER SEEN SUCH STUPIDITY IN MY LIFE, the EU would have been much better off giving Cyprus a free pass than what they did this weekend.

One of the consequences that was apparently lost on Eurocrats is the obvious flight of capital, would you feel safe with money anywhere in the Euro-zone after they so brazenly ignored all laws protecting deposits including depositor insurance and where willing to take money out of people's bank accounts with no warning, with no clear understanding if they could even pass this in the legislature before announcing such a train wreck? 

The other side of the flight of capital is understanding the difference between the US banking system and the EU banking system, to make it brief, the US has a far higher deposit to loan ratio than the EU has, the EU probably has more non-performing loans. When the deposit base is eroded more than it already has been, what happens to those loans, does the ECB completely re-write the rules of capital to loan ratios to allow for essentially naked loan origination with no assets? Does the entire concept of Fractional Reserve Banking see the rules changed in the middle of the game as the EU proved beyond a doubt, they are more than willing to do? Do they require EU banks once again to raise capital, which was such a nightmare the last time they tried, the world needed a global Central Bank intervention episode to counteract the consequences, remember that?And they risk all of this over Cyprus that contributes something like 0.3% to EU GDP and over $10 bn euros?

As of tonight and as expected, the failure on anyone involved to do simple math has cast the entire plan's success (if that's the right word) in a highly doubtful light as Cyprus' president, Anastasiades must tell the Eurogroup he lacks the votes needed to pass the levy. Did no one consider this? The Cypriot parliament has 56 seats, of which the President's party, Disy has 20 (20 votes), nine more votes are needed to pass the bank robbery, however of the remaining 5 parties who have voiced their intentions, there are only 3 possible undecided votes to garner, leaving the levy 6 votes shy of passing no matter how you slice it unless they just decide to dissolve the rules of Cypriot Parliament.

Tonight the news is that the Eurogroup supports Cyprus protecting deposits under $100k Eur., but the full $5.8 bn must still be raised through levies, which means those with more than $100k in deposits just saw a bad situation of 9.9% get even worse, many of these are Russians. In addition, the Euro-Groups statement did not rule out levies on account of $100k and under, it just talked about safeguarding them, which sounds like still stealing their money, just less of one saving class and more of another's.

Negotiations are ongoing, I wouldn't expect anything that is remotely close to a smart, workable solution, instead I would expect as usual, a poorly conceived, cobbled together, plan in which no one who makes the final decision was consulted and ultimately leads to a worse situation than what we can possibly imagine.


Volatility Follow Up

Before I start capturing charts for the Leading Indicators and FX post, I'm going to post the earlier VXX, UVXY and XIV charts along with the current ones so you can see how the divergence developed and the confirmation volatility futures were giving in to the market downdraft later in the afternoon.

First the earlier captures of volatility assets, the timestamp on the chart is 2:40.

 This is a longer term or bigger picture of volatility futures via VXX, if it were me and I wanted to get an early start on accumulating volatility long, I'd use VXX and UVXY rather than the VIX futures/options which would be in plain sight.

This is a leading positive divergence and it shows an intraday move to the downside that is confirmation, so it's not doing any damage to the leading positive divergence.

Also while most retail traders believe the opposite, institutional selling and buying is almost always done in to a fairly stable, not very volatile market; they are trying to get an average fill around a certain price and the market bouncing all around is not helpful so we most often see divergences in flat-ish areas or price ranges.


 The VXX 5 min chart also going positive in to intraday lows today...

 Just for confirmation (although UVXY should trade at a leveraged multiple of VXX, the actual accumulation or distribution is determined by volume and the ETF's / ETNs only track price of the underlying asset, they don't try to recreate volume so different ETFs of the same asset can help give you an idea of whether there's confirmation of the signal or not. Here we have the UVXY 5 min chart with a positive divergence in to the intraday lows the same as VXX which is confirmation.

 XIV is the inverse of VXX, VIX, UVXY and it shows the exact opposite on a 5 min chart, distribution in to intraday highs so this is further confirmation.

 VXX 2 min chart shows intraday accumulation is pretty strong, however opening distribution is present, this is exactly the opposite of the market so that is further confirmation being they trade opposite each other. In fact I'll demonstrate this, in this manner if you know what the update for VXX/UVXY is, you have a pretty good idea that the market is showing the direct opposite or vice versa, here's the 2 min chart of the SPY (same as above) backed up to the exact same time (2:40 p.m.); if there's confirmation, the SPY should look roughly the opposite of VXX or close to exactly the same as XIV.

SPY 2 min chart backed up to 2:40 today with a positive divergence on the open, price moves up in to a negative divergence at the intraday high, the exact opposite of VXX above and another chart that confirms volatility/market averages.

Here's VXX 3 min as divergences should migrate to longer timeframes and you can see this chart has a positive divergence in to the intraday lows (as of that time), you can also see the leading positive divergence from Friday afternoon that would give us the expectation that VXX would gap up the next trading day. As VXX gapped up, it was in to an immediate leading negative divergence sending it lower off the opening highs.

Here are the closing charts...
 VXX 2 min shows the rest of the story from the positive divergence at the intraday lows to what is really a leading positive divergence I have marked as in line at the green arrow.

 UVXY confirming the exact same on the 2 min chart with an even stronger leading positive divergence at the EOD.

 XIV (the inverse of VXX/UVXY/VIX) going negative and in line at the close

 The SPY 2 min leading negative at the close

 VXX 5 min also leading positive at the close, the divergence migrated to a longer timeframe

 15 min VXX with a new leading high positive divergence as price is near the flat range lows.

 VXX 60 min with a new leading high positive divergence

VXX 2 hour also making a new leading high positive divergence, it looks like someone is buying volatility, you know what happens when the VIX moves up...