Thursday, May 19, 2011

SPY Wrap

It's  been a long day for me and my wife starting at 4 a.m. with 11 hours at the hospital for a surgery that was supposed to be done at 11:30 a.m. As I mentioned, the surgeons who used a literal robot to do this high tech surgery, removing a cancerous tumor from her kidney, in the end-spent more time looking for a small clamp they lost in the surgery.

Anyway, besides all of us being beat, she came through well and  appreciate all the thoughtful emails today. Luckily the hospital had Wi-fi which makes sense when you think about it. I can't  tell you how many times I heard "so and so did great" in their surgery. I couldn't help but think, "what? all they did was sleep?"

OK,  onto the SPY which is another issue that seems to make some sense.

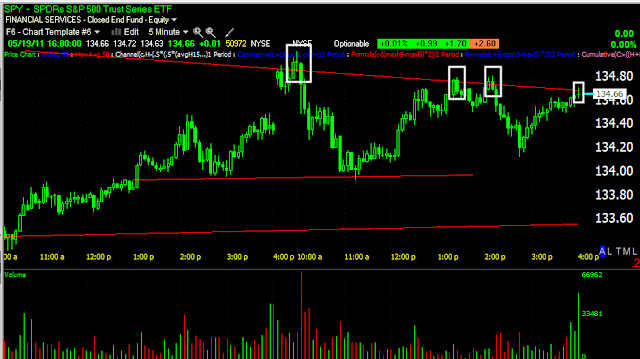
 Here the SPY threatened to do what I've thought it would do since before it broke below the triangle4 days ago, to cause a Crazy Ivan upside shakeout.

 Intraday the SPY made 4 attempts to break through, but it really seems like it was more about killing time.

 A look at 1 min 3C reveals today that every touch of the trendline was met by distributive selling. It seems like they wanted to keep it close, but not let it break $135.

 The 10 min chart is falling apart so if /when we do get an upside shakeout, I am just as certain now as I was then that this would be a head fake.

Below is the options chain, so there's two scenarios for tomorrow, our H&S pattern that I showed you today, pins the calls from $134, maybe even $133, but almost certainly the higher open interest at $135 (they didn't allow the SPY to spend very much time above $135 today and certainly not to let tit close, as well as the high interest at $140.

So it seems likely if, and I would be surprised to see a reversal without it, they push through the upside head fake, it'll have to wait until after options expiration tomorrow.

This is all short term maneuvering for us and hopefully getting a little better positioning and timing on short positions and inverse ETFs., but still the bigger picture for now is the sad state the market is in and the very likely and ugly decline which should make us some quick short side money.

Again, thank you all for you support, understanding and well wishes and for not teasing me too hard about my "other life".  You all are great!

The close

I'm going to try to t the close, but I have some things to do relate to my mother's operation, it seems they lost one of their tools while operating. Not quite the same as dropping a crescent wrench under the hood of a GTO.

In any case, I will try my best to catch the close.

LEI Trade Update

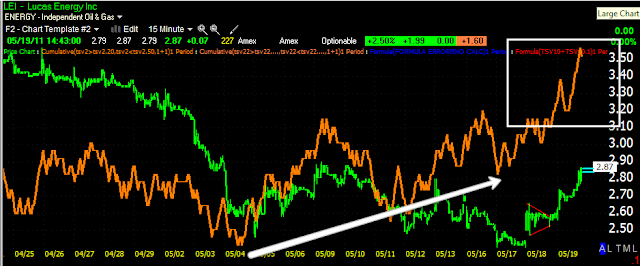
We looked at this trade May 13/18 (yesterday), today we have a nice 10+% gain.

 Here are the dates we looked at LEI as a long trade.

 There's several nice longer term divergences which make me think there could be more upside.

 15 min positive...

 The 5 min is starting to lag, which can be expected with profit taking on a 10+% move in a day.

At this point, I'd be trailing a stop in hopes of catching further upside. This is a 22 bar simple moving average on a 30 min chart.

DB Trade Idea

DB is one of the European banks that could be facing quite a bit of trouble. The chart seems to show an almost panic move out of the stock.

The price candles themselves are very bearish, add to that the volume and it looks like real concern. The recent bear pennant is more bearish then a bear flag as the trading range narrows, also volume has fallen off the last week. I would look for a move above the apex of the pennant, at that point, we'll most likely see a highly distributive move and at that point, it would make for a low risk, high probability short position. Keep this one on a watchlist along with GE.

GE Short Trade

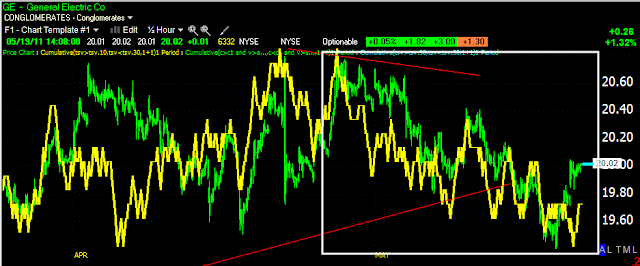
 GE is an ideal looking top and should be setting up within the next week for a nice short position. The minimum downside target should be around $16.

 3C in sync with the down trend

MoneyStream shows a huge plunge. At this point GE looks good, with a little patience, it may set up a really nice entry.

SPY Update

As suspected in the last few updates, it seems like they may be trying to pin the SPY $135 calls. The upper trendline represents a breakout from the triangle, which I still believe is highly likely, it's just a matter of timing at this point. As you can see, we still have a H&S intraday top, which could provide a move down, then we'd have quit a volatile shakeout. In any case, this is where we stand. The breakout point is the golden opportunity. We'll just have to patient and see how this plays out.

Breakout?

The SPY is right at resistance of the upper trendlne of the triangle. There aren't any obvious negative divergences in the SPY, but the Q's are getting a little close.  The Tick Chart hasn't broken the up channel, but it's starting to see some bigger downside bars.

This could be a defining moment, especially if we get a strong push through resistance with volume picking up, otherwise, while slanted, the H&S pattern would still apply.

Treasuries Trade

I highlighted Treasuries several days ago, but also warned to expect a pullback, based on my belief we'd see that upside move in the market (treasuries are trading exactly inversely to the market). TMF seems to be the only real alternative as it is 3X leveraged and looks like after a decent pullback it could see 40-50% of upside. So lets take a look and identify a target area to look at buying TMF.

 A bullish inverse H&S base with a breakout.

 Here TMF shows the negative divergence and the probability of the pullback I mentioned.

The 3 day trend channel has held every move up and down so looking at a purchase in the area of $32.50-$33 or thereabouts, would be a low risk, and most likely a high probability position. You may want to set an alert for price moving below $33.50

USO

Earlier USO was in line, now we have at least a 1 min positive divergence, so look for some upside, at least briefly.
 There's a possibility forming here on the SPY, perhaps this is a small H&S top, it falls right in the middle of the triangle. Remember, I'm looking for a breakout above the triangle, but timing is anyone's guess especially with options expiration.

 The 1 min chart looks like the right shoulder may develop a little more.

 The 5 min chart looks about right for a H&S top, which is on a 5 min chart so it's a short term event.

The pattern implied price target if this indeed is a H&S would be about $133 on the SPY, which would create another downside shakeout.

The heaviest open interest in SPY calls is at $135 and $140 so if they intend to pin the $135 calls, the breakout would have to wait until next week.

Sorry the posts are coming in slow, the browser here takes forever to load.

Market Update

 The DIA just entered into its triangle today, which didn't last long. There's a slight negative divergence from earlier, but for the most part trade is inline with 3C.

 QQQ looks the most benign of all the averages, there's a very minor relative positive divergence.

 SLV is also trading inline


 The SPY showed a bit of distribution right before the Philly Fed, coincidence? IDK. The SPY is trading in line which is not overtly bearish or at least not anymore bearish then what we see in price itself as far as underlying conditions.

USO showed an earlier negative divergence but is now inline.

My take on all of the inline charts, the day is still early. However, because of OPEX tomorrow, we may not see a strong breakout move today as the calls that have the highest open interest at last loo , were in the breakout area. Those calls are likely to be pinned.

Philly Fed-

Unfortunately the internet connection here at the hospital is ultra-slow.

So the Philly Fed MISSED HUGE.  April printed at 18.5, expectations were for a print of 20, the real number? 3.9!!!!

Again and as usual, input costs are squeezing margins. We didn't see this earlier this week surprisingly, but in the Philly Fed, we are seeing the price increases being passed along to the consumer. I'd say, "Here comes stagflation", but it's hard to imagine it hasn't been with us for a while now when using common sense metrics.

This is a ridiculously low miss. We'll have to see if it was a one time spike, however , even if it was, this trend is firmly established. The only thing "transitory" from the Fed will be projected GDP.

It would appear the titanic miss was the source of that huge volume spike I showed you at 10 am.

On the SPY Tri..

 This morning there was a brief breach above the trendline, look at the volume when price dropped below the trendline. This trendline is being taken very seriously.

We also have a 1 min positive divergence on that high volume break below.

SQNM Possible Breakout

I had an alert set on this one which just triggeed, it's very close to a breakout.

A bull flag consolidation on the daily chart

SQNM is just a few cents away from a breakout.

 3C 15 min positive

 5 min positive

and 1 min positive.

The implied target is $9.50 on a clean breakout.

By Popular Demand

I mentioned my former-semi-Rock Star status the other day and have been flooded with emails. Today I woke up  at 4 a.m. and I will be working from the hospital as my mother is having an important surgery. So due to the lack of sleep and against my better judgement, here is yours truly about 16 years ago.


and in an attempt to head off any jokes, here I am today with my wife.


Hopefully I did't just kill my "street cred".


In interesting news this morning, Iranian President Mahmoud Ahmadi-Nejad, is set to be the first political leader to head up an Opec meeting. Iran is in control of the OPEC revolving presidency and Ahmadi-Nejad who is in a power struggle with the conservative Mullahs, has declared himself "acting oil minister" and may head up the June 8th OPEC meeting in Vienna. We'll see if anything political materializes out of this.


Also out today, Japan slides back into recession, no big shocker there.


In other news, Initial Claims come in at 409,000 which is better then last week's 438,000 (upwardly revised from 434,000). The 409k print beat consensus and it looks to be set to become the catalyst that moves the market above the top trendline of the triangle, an event I've been predicting since before the triangle broke down earlier this week. So far, we are right on track as far as expectations go.


We'll see if the open holds the breakout status, but this is looking like the "Crazy Ivan" shakeout I've been looking for.


In other news, DSK has resigned. We'll see how Greece reacts.