Monday, February 23, 2015

Daily Wrap

Today was a bit dull and it's not surprising given the pre-Greek submission of reforms they intend to undertake which Germany described as having to be "substantial" after the "deal" was agreed to Friday. However if the leaks from official Greek sources are anything to go by, it sounds a lot like this list will be rejected out of hand. I didn't have to look Smeagol in the eye to know that Schaueble didn't ask for a list of substaintial reforms by Monday as a Greek wishlist, if anything I think you might be able to consider them as a punitive reminder that the Troika will not tolerate uppity leftists.

Furthermore, I don't think that the EU can afford to look weak in any sense with the rising tide of anti-EU/austerity political groups that are gaining in popularity across the continent. In fact some of the harsher terms were demanded by none other than Spain which has its own problems with the Catalonia region and Spain's extreme leftist Podemos party. Ireland has their anti-austerity leftist Sinn Fein. Italy has their 5-Star movement which is anti-austerity and anti-Euro. On the far extreme right, France has its National Front, Finland's "True Finns" also far right, the UK's UKIP and Germany's own "Alternative for Germany" rounding out the far right. These are for the most part not fringe elements in the political theater, most are ranked within the top 3 parties so the threat to austerity and/or the Euro is not a negligible one.

Getting back to the market, we also have the biggest threat to the F_E_D's status quo since Dodd-Frank with Democrats and Republicans each gunning for more oversight, less independence for the F_E_D, such as Rand Paul's "Audit the F_E_D" so Yellen will have more to deal with in front of the House and Senate over the next 2-days than is usually the case at the semi-annual Congressional (formerly Humphrey Hawkins) testimony which was mandated along with the F_E_D's dual mandate in 1977 in the "Balanced Growth Act".

While the market will be looking for any sign of F_E_D thinking on rate hikes, I suspect most questions are going to be less of a forward looking economic perspective and more of a full frontal assault with the F_E_D's only real ally being the President's veto pen. Under these circumstances, it's not hard to imagine why the market seemed to be drifting today.

The financial media's narrative regarding the bounce in Treasuries today was that of protection with the Greek submission due by midnight, however I doubt this is the case as we saw the probability of a TLT/Treasury move higher last week in Leading Indicator TLT Follow Up / Market Update and several other posts.

The fact that TLT is forming a bottom at the same time the market is putting in the "Igloo with a Chimney" topping pattern cannot be ignored as that correlation is tight.

NASDAQ COMPOSITE DESPERATELY SEEKING $5K...

I think by the look of today's late day ramp and AAPL's support of the NDX, the NASDAQ Comp is desperately trying to hit the psychological magnet of $5k, which it came close to today at an intraday high of $4960.26. $5k would be an easy and meaningful target, whole numbers, centennial numbers and ATNH's are always magnets (why do you think retailers never mark prices in whole numbers, but rather $9.99?) , although the reason for going after such a psychological magnet may not be what it appears.

The market which closed mixed from the Dow down -0.13% to the NDX up for the 9th consecutive day at +0.14% was obviously mixed with the R2K coming in at unchanged after a semi-idiotic looking late day ramp.

Most of the averages today were either negative to listless until the late day ramp to lift the averages out of the red, the NDX obviously being supported by AAPL, but even AAPL looks to have entered a similar Igloo/Chimney topping pattern (I'll update the 3C charts tomorrow)...

AAPL's last 50 minute ramp coincides with lifting the market averages out of the red and letting the NDX close (+0.14%) for its second consecutive week. However in doing so, AAPL put in the same price pattern that is popping up in all of the averages now with assets like TLT obviously looking as if it has found a bottom or is just about done forming one after about 3 trading weeks. See today's TLT update, TLT Update.

However, I do think TLT is lower tomorrow, perhaps finishing up the base area. Here's why I suspect a pullback (although the overall price action has flattened out from the former downtrend, making perfect sense with the market's price action)...
 TLT 1 min intraday distribution near the close.

And the X-Over Channel is moving to a long TLT signal after the downtrend, which had no stop outs, has turned not only lateral, but as I said, a long signal.

The pump and dump today on the "OPEC" Emergency meeting that was shortly thereafter denied officially, looks like it may be part of the larger picture which we have been expecting, USO Update

 USO's 2 hour chart with SIGNIFICANT distribution before the downtrend and a nice positive "Gas in the tank" currently, but not enough to be a real bottom, but more likely a counter trend rally.

Here's today's pump and dump which was front run, see today's post OPEC- USO=Front running 

The interesting thing was even after the dump, there were still positive divergences as a sort of support level formed through the day, this is at the same area we expected a head fake move (stop-run) below in our USO trade set-up from last week (USO has moved exactly in that direction since the post).

We also have our custom Buy/Sell DeMark inspired indicators giving 1 sell signal on a 60 min chart at the same area we called for a consolidation/correction and 3 buy signals right at support, I still suspect a head fake stop run (yellow arrow) below support with this being the highest probability/lowest risk entry, PERFECT for a call option play.

Our custom SPX:RUT Ratio indicator did not confirm price earlier today in the Leading Indicators update and it closed the same way...
Non-confirmation in our custom indicator (red) and the SPX now at a "Chimney" area in price, joining the Q's from last week.

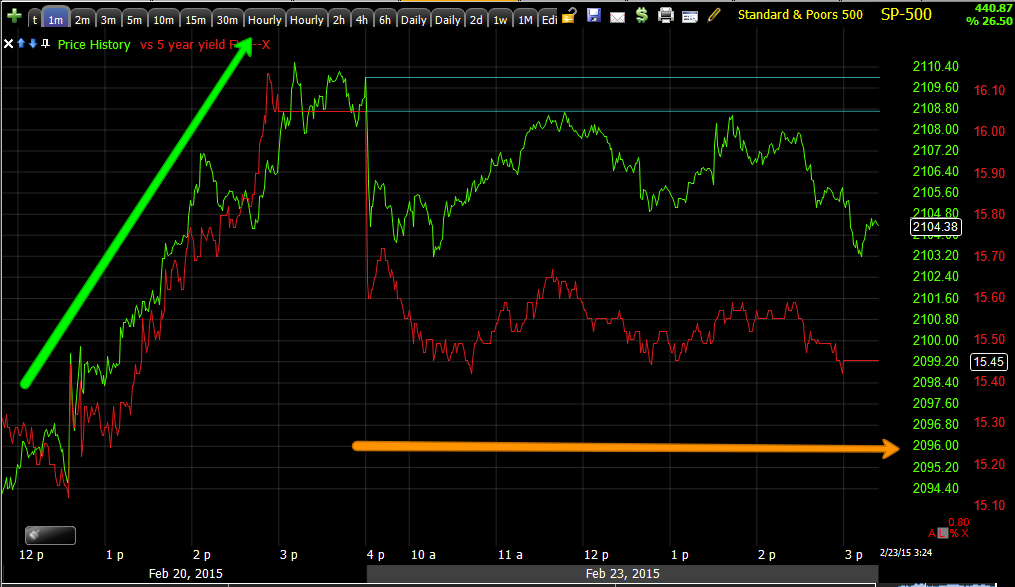
During our afternoon ramp, the divergence between yields and the SPX was ridiculous, but this is what leading indicators are for, ferreting out real moves that will hold vs head fakes that are useful for tactical entries.
That's quite a divergence, but don't forget about what I said about TLT very near term with the late day intraday 1 min negative divegrence...

 Being this 3C chart should pick up where it left off and Pro sentiment leading indicators were in line, I suspect Treasuries will pullback a bit tomorrow, broaden their base allowing the market to perhaps break today's range, for instance look at the SPY above this chart and most probably target NASDAQ 5k. Of course fundamental developments or wild cards could run over this weak divergence (Greece/Yellen).

Despite the late day pump to get the averages out of the red as best they could, it looks like VIX short term futures were seeing more of a bid.
VXX in yellow (inverted) vs. SPX, on the late day ramp in the averages, VXX "should" have made a higher move (actually because this chart is inverted, it would have been a lower move without any inversion), which seems to suggest a bid under protection.

Looking at internals, there was no Dominant Price/Volume Relationship, it was as mixed as the market and really no where near anything considered dominant.

Of the 9 S&P sectors5 of 9 closed green, although not by much with the leader (consider the target-NASDAQ) of course being Tech at a meager +0.35% with the laggard being Utilities at -1.13%.

Of the 238 Morningstar Groups, only 107 of 238 closed green and again, small gains in the green groups.

This suggests that the market is not done trying for what I'm guessing is NASDAQ Comp $5k, although even with AAPL pushing hard and a few other short term, smaller helping hands like a pullback (likely) tomorrow in TLT/Treasuries, the market is obviously struggling here, the late day ramp to get half of the averages green as all were in the red looks to be clear evidence of this.

Otherwise, today had the feel of an op-ex pin, again I suspect there's some hesitation with the Greek situation to do much of anything right now, but as I said Friday, I see no upside in this scenario, only pure downside risk.

Taking a quick look at our broader breadth indicators, Russell 2000 is standing out as its Advance/Decline line is peeling away from price, a trend that has been moving along through the year, but getting stronger now (weaker for the Russell). The same is happening to a lesser degree in the Russell 3000's A/D line as well.

The Absolute Breadth Index is also falling apart, the trend is particularly noticeable through 2015. (Maybe tomorrow I'll do a breadth post).


Because it's material to the market right now, the NASDAQ Composite's Advance / Decline line which was strong through 2013 and part of 2014 when it flipped and went negative, remains so and near term action is lacking breadth, meaning fewer stocks are participating on the upside.
NASDAQ COMP's A/D line (green vs the COMP in red) leading in 2013 (green arrow) and going severely negative in 2014 is still not only weak overall, but in this area specifically. Compare the COMP (red) vs its A/D line (green) relative to the yellow trendlines, the A/D should be moving higher, but fewer component stocks are participating, this especially is not a good sign for the COMP and gives visual meaning to what I said above, although the reason for going after such a psychological magnet may not be what it appears."

In addition, the Breadth indicators that show the Percentage of NYSE Stocks trading above their 40-day/200-day or 1 and 2 standard deviations of either, have not moved up in at least 12 days, many have moved down and several have been flat/down for more than 12 days, nearing 3.5 trading weeks, this is not what you should see when a market makes a move higher, like the 9 days green for the NDX, these should all be at new highs rather than flat to down, especially for that period of time...More evidence that this price pattern of an Igloo with a Chimney is a weak area in the market and almost certainly the same price pattern we see just before a reversal to the downside (or upside for an inverted Igloo with chimney which has a head fake move that is a stop run rather than a breakout).


Futures aren't providing any obvious clues right now, just more of the same after the closing ramp, FLAT, although the Russell 2000 does have a bit of a nasty negative divegrence which looks like perhaps some of the late day ramp risk is being unwound, I wouldn't expect it in the NDX futures, but' we'll see if anything develops later and if it does I'll post it.
TF / Russell 2000 futures with a deep leading negative divegrence just as soon as the cash market closed and the ramp to green ended.

Yellen and Greece are the main events tomorrow. Yellen gets started at 10 a.m. tomorrow with a prepared statement before the Senate Banking Committee. Wednesday at 10 a.m. she'll be in front of the House Financial Services Committee.

I suspect we'll hear something more on Greece soon so I'll check futures as always and post anything I find that stands out.

Enjoy your night.

Leading Indicators

Sure enough, if you saw our earlier post on the oil pump and dump, OPEC came out with an official denial so this was a TRUE pump and dump, but I'm not convinced it doesn't have something to do with our USO trade set up, we'll see.

As for Leading Indicators, they too are a bit tame today, but there's still some interesting things to see.

 This is our SPX:RUT Ratio, usually in combination with the custom VIX term structure, but there's nothing to see on the latter. On this chart though, the red custom indicator is not confirming price action which is interesting given the chart of the Q's last week and the SPY with the Igloo/Chimney price pattern, the chimney is where the head fake is found and that's also where this indicator is not confirming price.
Here's the Igloo/Chimney price pattern in the SPY, note where 3C short term (timing) is not confirming, the exact same place although the two indicators have nothing whatsoever to do with each other.

 This is an example of TLT's relationship or correlation with the SPX which is normally inverse or opposite so I inverted the SPX prices in green so you can see what it should look like, nearly exactly the same. You can also see the difference in the ROC of price from drifting down (which is really up for the SPX, but down for TLT in blue) to lateral or flat which is where we usually see the heaviest underlying 3C activity (bases and tops).

Last week we thought TLT / bonds (especially on the long end) would bounce.

This is a closer look of TLT vs SPX today, you can really see how much TLT has broken that  which is the signal we look for as a leading indicator.

 This would be the SPX (green) since the last base (the 3rd of the year from 1/29 to 2/2) and 30 year yields in red, remember that equities are drawn toward yields like a magnet.

This is significant because of the change we are expecting and seeing in TLT and bonds. Yields move opposite bond prices so TLT / bonds moving up as we saw above send yields down and you can see the tight correlation between yields and the SPX, so a move down in yields pressures the market lower. Again, interestingly this is occurring at the point in which a Chimney (head fake and excellent price timing signal) is showing up on the averages and being confirmed as a head fake.

As a quick example, as I usually say "a head fake move is usually the last thing we see just before a reversal", here's one of the last and significant ones in which we were predicting the head fake (Chimney) days in advance, similar to this situation as well.
This was a well known rounding top with the "Chimney" head fake predicted days in advance, it turns out to be the last move just prior to a deep correction at minimum, a break in trend on a primary basis being even more likely as the market has formed a megaphone or Broadening Top in most averages since then.

*The last day of the chimney also corresponded with the F_E_D's Bullard making comments that the F_E_D "Should be willing to remove accommodation".

I only bring this up because of the article I wrote, The Plunge Protection and Market Correction Team which is a different take that is not only encompassing the PPT aspect of the F_E_D, but in fact, maybe a "too cozy" relationship indeed as Bullard alone's comments corresponded with areas we had already marked out as being in distribution or accumulation, the market doesn't just make money by going up, it makes it just as fast if not faster moving down.

First Bullard makes a hawkish statement aligning with our Igloo/Chimney top, sending prices to the October lows where EVERYONE was a bear. We had identified accumulation and even said this move was going to be so strong, you wouldn't emotionally want to short in to it even though you knew it was coming and why in advance before it even started with the "dare" to book mark the post and come back to it after the move had completed.

At the October lows when we were expecting this "Monster" or "Face Ripping" move up, at the same time sentiment indicators made new bearish records, Bullard changes to a dove saying the F_E_D should delay ending QE3. Weeks later his assessment of the economy has changed and he's back to a hawk and after that, barely a month has passed, but he changes his stance on inflation. You can't get any sort of read on inflationary trends in a month, it's statistical noise!

Again, I just mention it because of the indications, the price pattern and Yellen speaking the next 2 days. Who knows?


 Here's a closer view (intraday) of 5 year yields, note the "in line" status Friday and the divergence today.

And as you know, while QE was underway, input costs soared which caused the F_E_D to take action on commodity prices and the once excellent leading indicator became near useless, but since QE3 has ended at October 31st, it seems Commodities (brown vs. SPX green) are once again acting as a leading indicator.

Above you can see 3C negative and positive divergence vs the SPX. The largest divergence of this year is negative and right now.

 And as far as that "Chimney" goes, look at the larger than normal negative move in commodities right where we expect and got a chimney head fake move.

In addition, the Baltic DRY Index (the daily posted price to ship dry goods over sea) hit another new record low. This morning we found out that a 3rd shipping (Dry bulk carrier) will go belly up in as many weeks while China's COSCO decommissioned and scrapped 8 dry goods ships in January, an effort that cost them nearly double what they received for the scrap.

The price of commodities taken with the DRY Index which isn't traded and thus not manipulated, all point to the same thing, Global recession.

More on the way...

OPEC- USO=Front running

You may have just noticed a spike in oil, a definite spike in the NYSE TICK and to some degree in the averages, but not as much.

When I taught technical analysis for our county school system's adult education program, the first class, the first lesson was playing Cramer's "Street.com manipulation" video, after watching that video, everyone in the class looked completely dejected and hopeless, they grew up on the notion that value and earnings create price movement, when they found out how much the market was manipulated, they just looked like they lost their best friend and all hope.

That wasn't my intention, but to beat the market, you have to know what you're up against and I think the best way to beat it is to follow those who move it.

That brings us to oil just a few minutes ago as it spiked on news from the Financial Times that the Nigerian oil minister said OPEC may have an emergency meeting to deal with the slide in oil prices, whether true or not, it's too early to tell from the 3C charts, we know oil is likely in a consolidation and it does have the gas in the tank to move higher, but I would wait for the set-up and if it doesn't come, I wouldn't kick myself for missing the trade. You have to be willing to let a few slide past if you're going to go after the highest probability/lowest risk trades.

In any case, that wasn't what I was interested in, it was this...dirty, rotten front-running the Press statement...

 Just to visually prove today has been a dull day, the NYSE TICK has been ranging between about +/- 600 which is a ver flat range for internals. There were only two spikes, one down to about -1100 and then the oil spike to +1200.

Just the way USO's price was trading (flat lower range) would suggest to me that there was some underlying activity going on and you can see it intraday, someone was accumulating before the press announcement or what is otherwise known as "Front-running" on inside information.


You can see the same thing in Crude (Brent) futures.

This isn't a big enough divergence to suggest we are at our anticipated trade set up which is actually below USO's range...
 This is USO's daily chart, the move we are looking for is a head fake below the range (stop run), which "may" start today as volume is rising and the spike in oil was a classic pump and dump...

Here's the spike/pump and then the dump, but someone was front-running that press announcement and probably made a decent little bundle.


We'll see if price sets up a head fake, if it does with accumulation, a real OPEC announcement would have oil accumulated by the pros and on the cheap which would likely mean they knew about a real OPEC emergency meeting in advance, which would also be VERY interesting for our trade set-up.

There are a lot of "if's" and conjecture in all of the above, but it is a possibility that makes sense and would be a fantastic lesson in why we watch and follow what smart money is doing rather than just change our opinion with whichever way the wind is blowing.

Why again are the bulls so incredibly bullish? Is it the worst start with the worst negative surprises to macro data for the new year since Lehman or the ridiculous forward P/E's? Maybe a F_E_D rate hike or neutered F_E_D? The expanding war in Ukraine that involves the US and Russia on ground that Europeans are scared of enough that the US just sent A-10 tank busters over to Europe to calm nerves; planes designed to kill Soviet tanks during the height of the cold war on European battelefields? Or just because price jumped in a very silly way on Friday on an event that is almost pure downside risk?

TLT Update

I meant to include TLT (20+ year bond fund) in the last update, I had the charts prepared and just forgot to get them in there.

In any case, I believe last week I posted a chart of the inverse relationship we have seen , especially of recent between bonds and equities, specifically TLT and it's inverse relationship with the SPX especially recently. With TLT moving down over the last 3 weeks or so, you may recall that last week, I expected TLT to start to bounce soon, that started today.

When bonds move up, yields move down and as you know, yields are one of our Leading Indicators as they tend to pull equity prices toward their direction, so again, a move up in bonds/TLT means down for yields and last week I felt strongly TLT had hit a bottom and was ready for an upside reversal. This post is a day earlier and deals with the TLT signals looking like an upside reversal was on its way, TLT 20+ Year Bond Fund / Leading Indicator... and this post is more of a broad leading indicator post with an emphasis on TLT and is the place you can see it's correlation to the SPX and how it works as a leading indicator, Leading Indicator TLT Follow Up / Market Update

Today TLT is up, it is not out of the range area yet, but it has some encouraging near term charts and I say near term because we had some nice longer term TLT longs last year as bonds outperformed stocks, but I think that longer primary trend is no longer a ride I'm comfortable with as some of those longer term TLT charts have really fallen apart, but that's not where my immediate interest lies...

 TLT daily chart, note the rate of change has gone from down to lateral, more of a basing scenario.

The intraday 1 min chart looks good and looked good so I'm not surprised TLT is up today, but this is not the extent of what is so interesting about TLT, especially if you know what the SPX vs. TLT correlation looks like.

It's charts like this 10 min and a VERY fast, VERY strong leading positive divergence, but this is not even the extent of it...

This 60 min chart had a relative negative divegrence sending TLT lower, it's a respectable divergence, especially on a 60 min chart, but a relative divergence is a much weaker form than a leading divergence. Now, look at the right side of the chart and the 60 min leading divergence and the very short period in which it went ballistic. When I compare divergences, I'm seeing what looked like the planned, slow process of sending TLT lower, but not especially emotional or motivated, they took their time, it doesn't seem like they distributed TLT very hard (enough to do the job, but not a strong signal), then looking at the right side of the chart, it's almost as if someone is a bit more serious about getting back in to TLT a lot more quickly which is interesting considering Igloo/Chimney price patterns.

Quick Market Overview

I can see how the market would be a little tepid and roughly pegged in place in front of the Greek delivery list of their reforms and certainly in front of tomorrow's 1st of 2 day Yellen/F_E_D congressional testimony, but that doesn't mean there aren't still things happening below the surface, some are interesting as they gather some early momentum, some are interesting from a conceptual point of view as you can use these concepts in any kind of trading in any timeframe and just about any asset.

First the averages, they all pretty much picked up where they left off at Friday's cash close.

 The SPY ended on a sour note (3C) on Friday afternoon, it picked up where it left off on the cash open today. This small intraday divergence is well past by now (since this is a 1 min chart capture), but it does show that sort of "pegged" price action or non-action in waiting to see what's going to happen next.

However one thing I found interesting was last week we had the Q's forming the rounding top with a head fake or the pattern that looks like an "Igloo with a Chimney". If you think about the psychology of it, it's not hard to understand, when bulls see price losing upside momentum and starting to roll over, it would make sense that they start pulling back on positions, no longer being useful as a buyer or raher PROVIDING DEMAND, so you can understand why that "chimney" shows up, it erases the unease they start to feel as they see price's ROC die down and start to roll-over.

I don't think it is coincidence that one of the best price timing markers we have is this head fake chimney which usually directly precedes a reversal in trend (this works inverted also as rounding bottoms with a head fake stop run below the rounding bottom).

 While we had this pattern in the Q's last week, we didn't have it in the SPY yet, now we do.

I'm not sure if I would have discovered this pattern with out the 3C divergences that almost always accompany it. The price pattern is seen very often at key pivot points or inflection points, but if you don't recognize it as a recurring event, it's easy to overlook.

Breaking down the Q's Igloo with Chimney price pattern...
After 2 prior failed bounce attempts in the market for 2015, we had a descending triangle (bearish according to TA, but these patterns get manipulated so often because they are so predictable and well known) in place. You may recall as the base for the 3rd bounce formed between 1/29 and 2/2, our first initial upside target was ABOVE the descending triangle which happened and we had to re-draw the trend lines that gave us a rectangle range that stretched across all of 2015 to that point which makes a very juicy head fake target, it gets traders to move, creates demand, makes it easy to sell in to.

I don't know how many of you watch mixed martial arts, but if you do, you know when two fighters are grappling on the ground, there's often a series of small blows to the ribs or other areas that are meant to cause movement to create opportunity, none of the blows are strategic as in ending the fight, but tactical as in creating the movement necessary to reach a strategic goal and win the fight, that's more or less what a head fake move is and the Chimney on a rounding top of the "Igloo with a chimney" price pattern is akin to the same idea. "I w/ C" = Igloo with Chimney.

 The Q's ended the cash market Friday nearly in line, but VERY parabolic which is why I liked a small spec position, Trade Idea: Short Term Spec Puts...QQQ.

Intraday, as of this capture, the Q's also are pretty much in line and not too exciting.

You've probably heard me say in reference to 3C signals, "When in doubt, go to a longer timeframe", there's often something going on and sometimes you have to reduce noise and small signals to uncover a trend.

 This was the Q's at the time of capture on a 3 min chart when I started this post, this is the same chart right now (which of course will still be a bit old by the time you get it)...

Not only has there been deterioration in to Friday's parabolic move, but in a brief period of time this morning, it has increased substantially in what looks like an otherwise quiet market.

 The IWM ended Friday's cash close with a negative intraday signal and picked up where it left of this morning....

again on a slightly longer chart, you can see there's more going on here than what meets the eye. These are the kind of things I'm watching and keeping tabs on, you'd be surprised how quickly a nasty surprise can creep up in a market that otherwise appears to be quiet, this is why I always warn to be aware in a dull market.

As for some of our expectations, HYG's charts are continuing doing what they have been doing and it's getting to a scary point for HYG.

 The intraday trend has been negative in HYG, but as you can see, the rate of change or decay in 3C has stepped up significantly and this is with HYG already in a bad primary trend position.

The 30 min HYG chart and its primary downtrend. At each of the tops you can pick out the 3C negative divergence, now look to the far right at our current HYG move.

As for Oil, we had a trade set up we were looking for...USO Update
 You can check the update above or those from earlier in the week, this divergence tells me USO is likely to break below its consolidation/rectangle, so far it has added to that today.

You may recall, a move below lower support (potential head fake) is what I am looking for, it will need to show accumulation and I think it can, the point is however, we are moving closer and closer to that probability, as well as a nice potential trade, but I wouldn't jump just yet, let the trade come to you, lets confirm we are seeing what we expect to see. These are some of my favorite trades, they come to you on your terms, you pick your battleground.

As for Gold...
 We had been looking for a pretty serious pullback and that has occurred and is still occurring, but something is starting to change, GLD Next Set-Up

Again, this is a "Let the trade come to you" situation. It looks like GLD is starting to feel around for a bottom. I have stronger 3C charts than this, but I don't want to give the wrong impression as I think we still need to see more lateral trending/base-building as well as 3C signals in more timeframes, but I think we are getting close to a nice trade here at a nice discount and much lower risk.

I'll be looking at some more things in the market and keeping an eye on some of the charts above, but also opportunities that may be setting up. You may recall I saw several inverse ETFs last week making some impressive moves on the 3C charts as we expected Financials to rotate in Friday and FAZ to pullback. There are quite a few of these along with the individual stock names.


Monday A.M. Update

I hope everyone had a fantastic weekend, I surely did and I just wanted to say thank you for the many kind, supportive emails over the  weekend, most unexpected and I'm grateful.

The next couple of days promise to hold a lot of volatility and some very big issues.

It wasn't hard to predict that the leftist Syriza party members would rebel against Tsipras's "deal" with the Troika (I'm sorry, the "Institutions") as one of the most well respected and senior members of Syriza penned an open letter this weekend blasting Syriza's leaders for coming to this deal as well as apologizing to voters for Syriza's rolling over as he called the "deal" akin to renaming "Fish" to "Meat" and encouraged voters and others to stand together, stand strong and confront the Troika, something which PM Tsipras just found out is much easier said than done in the grand spanking that he received Friday with the market foolishly thinking this was good news.

Today Greece must submit the "Additional measures" that are to be "significant" with regard to what they are going to do to guarantee the loan is paid back, if the Troika/Germany were to accept these additional measures which from early reports it already sounds like this is going to be a huge NO, then it would have to be passed in Greek Parliament which right now is in upheaval with Syriza falling apart as the majority still want confrontation with the Troika and to get out of what they view as a "Debtor's colony".

From some early "Sourced" leaks, it sounds like the Greeks additional measures will include protecting primary residences from foreclosure, which the Germans will not accept. Additionally they would like to slowly raise the minimum wage until 2016, again the Germans will not accept this and they want to protect pensions, pensions which have been stripped by th "agreement" or bailout which again will not float with Germany. So the proposals to be submitted before midnight today are almost certainly a non-starter and Greece faces the imminent halt of all funds from the Troika and becomes insolvent within weeks.

This really could not have gone much worse and the idiocy of the market celebrates it on Friday!

The drama in Greece is far from over. All I can say to this is if you are going up against the establishment, you better be ready to do whatever it takes and not try to bluff your way through it with no plan "B".

What may be even more interesting is Janet Yellen's semi-annual 2-day testimony starting tomorrow (formerly Humphrey Hawkins) in front of Congress. Both sides, Democrats and Republicans each have a bone to pick. Generally speaking Democrats are uncomfortable with what they see as the F_E_D's "too cozy" relationship with Wall Street. Republicans are generally saying the F_E_D's monetary policy is too aggressive and looking to strip away many of the F_E_D's powers and oversight. This testimony , this week is being called the biggest threat to the F_E_D since Dodd-Frank nearly stripped the F_E_D of supervisory powers. 

There are numerous proposals from both sides of the isle including Rand Paul's "Audit the F_E_D" push, a potential bill that would demand that the Senate confirm the NY F_E_D bank president as it retains a permanent voting seat on the F_O_M_C while other regional F_E_D banks rotate in and out of voting in the F_O_M_C. The number of different proposals and potential bills to strip the F_E_D are too many to cover here, many are small bills with little support that will go nowhere, but otherwise, the only person the F_E_D has in its corner is the President, beyond that Democrats and Republicans crossing the isle to support bills to limit the F_E_D's powers is not out of the question by a long shot.

On top of all of that, the market will eagerly be looking for any hints as to what F_E_D policy in the near term may be as rate hikes are next, yet we have the worst negative surprise macro data for 2015 so far since Lehman.

In another record new low for the Baltic DRY Shipping Index, we have news of the 3rd shipping company in 3 weeks filing for bankruptcy, this is the real global economy, the F_E_D is between a rock and a hard place.

Meanwhile the Ukraine cease-fire is not only not holding and never even started, but it seems events are accelerating with Kiev saying the war is likely to spread and Kiev believes it will come up against Russia and is demanding the west send "lethal weapons" to support Kiev's current and very fluid situation.

On a side note, I just can't get past the "Mall" terror alerts days before the DHS is about to run out of funding...ironic timing?

We have a lot of macro data this week from across the globe, some political theater as well beyond Greece, but it looks to me as I said Friday, there's very little upside and just about pure risk moving forward from here.

I'll obviously be watching the market for signs of how the market is preparing and taking the Yellen testimony as well as the Greek situation.

As I also said last week/Friday, I didn't think the Greek "deal" was going to change the fact that everything (well lets just say many things) are pointing to the market rolling over and I have expected the next roll to undercut the October lows so I'll be looking at that closely and where the opportunities are.

The fireworks should be starting later today/tonight and certainly tomorrow through the rest of the week.

Market updates are on the way.