Wednesday, June 17, 2015

Daily Wrap

I'll be honest with you right up front, I'm not really excited about the market today. Even with a knee jerk reaction, the averages closed mixed with small caps taking the worst of it pretty close to in line with yesterday's P/V Dominant relationship, after all had it not been for the knee jerk reaction, all of the averages would have closed red as internals suggested yesterday.

Transports were the worst, the Russell closed red swell. If not for the knee jerk reaction so common to F_E_D events, the other averages were well on their way to a red close.

I think what is really tiring about today is the F_E_D itself, it may be listening to Yellen drone on for so long that did it to me, but I think it's more about the ambiguity in the F_O_M_C itself. A red-line comparison of the April statement vs the June statement will make you believe that the F_E_D is still very much trying to sell the "Transitory weakness" rap for Q1 and is otherwise telling us that things are progressing nicely toward their goals for a rate hike, but not quite there, certainly a more upbeat general assessment, but when you get in to details, it's all over the place. The economic forecast for 2015 GDP and 2016 were brought down, as well as the unemployment rate was adjusted slightly higher.

Then there's the 15 members of 17 that are for rate hikes in 2015, 10 of 17 calling for 2, 15 of 17 calling for at least 1, but their projection of where interest rates are at the end of 2015 fell from the April meeting, so there's point/counterpoint all throughout the statement and accompanying forecasts and projections. Perhaps I'm best served just ignoring all of it as it changes with the wind and the F_E_D is still obviously playing economic cheerleader to justify something they know they shouldn't be doing right now or perhaps should have done sooner or even better, perhaps shouldn't have done at all, like going to ZIRP and boxing themselves in.

I think the market grasped this too, but it wasn't the knee jerk move that's almost obligatory for a F_E_D related event that told the story, it was in the sharp intraday decline in the $USD- that's where the pros are and where they were expressing their opinion of the F_O_M_C today, not in equities.
$USD sharp intraday decline on the release of the F_O_M_C

I think a line a member sent me best described the entire scenario, economic projections fell while rate hike probabilities increased, which should just make it that much more entertaining to watch the F_E_D talk the economy up, while forgetting that the census/projections sheet they filled out shot the economy down. In other words, the F_E_D knows the economy is in poor condition, they also know something we don't that makes the economy irrelevant and the need to hike rates imperative, we can all guess what that is, but somehow I think we might be surprised.

My own take was that we'd likely have had a rate hike today if the Greek situation were not fluid and a deal had been clenched. To hike today just to have a Greek/Lehman weekend would have been tough to explain when the cows start coming home. Speaking of which, we should see that being discounted in the market shortly, I'm sure you've heard the talk of a Lehman weekend just about as often as rate hikes being referred to as "Lift off".

As to today's move and when it will be run out, it was a knee jerk reaction ad as I said earlier, not the most impressive one I've seen by far. Here are several non-confirming indications...

 Our custom SPX:RUT Ratio Indicator that often leads or confirms as it was doing mostly yesterday, fell apart completely right around the set-up for the knee jerk bounce, around the time I posted some of the evidence of it, Market Update and Initial Trade Plan

This divergence isn't just non-confirming for today''s knee jerk, but looks a bit sharp going forward, I'll keep an eye on it, it may be the start of the next move leading lower through all of this SPX 150-sma support.

 I am showing this to you a different way. All this week I have inverted SPX prices so you can see the out-performance of VIX and VIX short term futures. I decided to present it a different way today.

We all know that VIX/VIX futures should trade opposite the market, yet from Friday's close (where the green and blue trend lines start) through this week, both the SPX and VIX are higher than their Friday close, VIX should not be there under normal circumstances, translation: PROTECTION IS BID.

 Again with VXX this time, compared to Friday's close the SPX is higher and so are short term VIX futures, an unusual sight that doesn't need me to invert prices to see. AGAIN, PROTECTION IS SERIOUSLY BID.

 YIELDS WHICH HAVE BEEN LEADING THE SPX RECENTLY GOT A LITTLE SLOPPY TODAY WITH A PULLBACK IN TLT SENDING THEM HIGHER, BUT TO THE FAR RIGHT IN TO THE KNEE JERK REACTION NOTE THEIR MOVE LOWER.

Remember as a leading indicator, yields tend to pull stocks toward them, in this case down.

The exact same concept holds true for commodities as a leading indicator and again, they are in a negative position relative to the SPX.

 Then there's HY credit, it was NOT buying the move today and hasn't been since the May head fake/false breakout divergence with HY Credit.

Today just made it worse. So the last 3 days pros haven't been buying this market tells us what about the last 3-days?

Or we can just look at our Pro sentiment Leading Indicator...
 It has been selling off throughout, especially this week.

Of course it has been selling off since exactly where we expect it would, right at the false breakout at the SPX triangle head fake move in May. Note the deep divergence between it and the SPX this week to the far right.

 Finally I want to look ay High Yield Corp. Credit seeing as it was used yesterday to help ramp the market on an oversold condition which should have been enough to move it up as well as a short squeeze, but still needed HYG yesterday and today, look at the near perfect alignment the last 2-days, this is why they use HYG for short term manipulation.

Longer term like HY Credit, although much worse, HYG is deeply leading negative and like yields, except much more powerfully, it tends to pull equities to it (credit), thus the saying, "Credit leads, stocks follow" as you see on both the very short term and longer term charts above.

I just wanted to make sure there was no accumulation of HYG for a move anything beyond a knee jerk reaction, this is the 3C chart of HYG and it has been selling off the last two days in to the highs, it seems they're willing to use it for a couple of days, but don't want to be caught holding it any longer than that.

Note the special weakness in to the knee jerk today.

So the market hasn't been all that surprising this week, but I am hoping prices can hold in place right in this area for a day or so and let the charts give us some high probability, low risk signals for new trades.

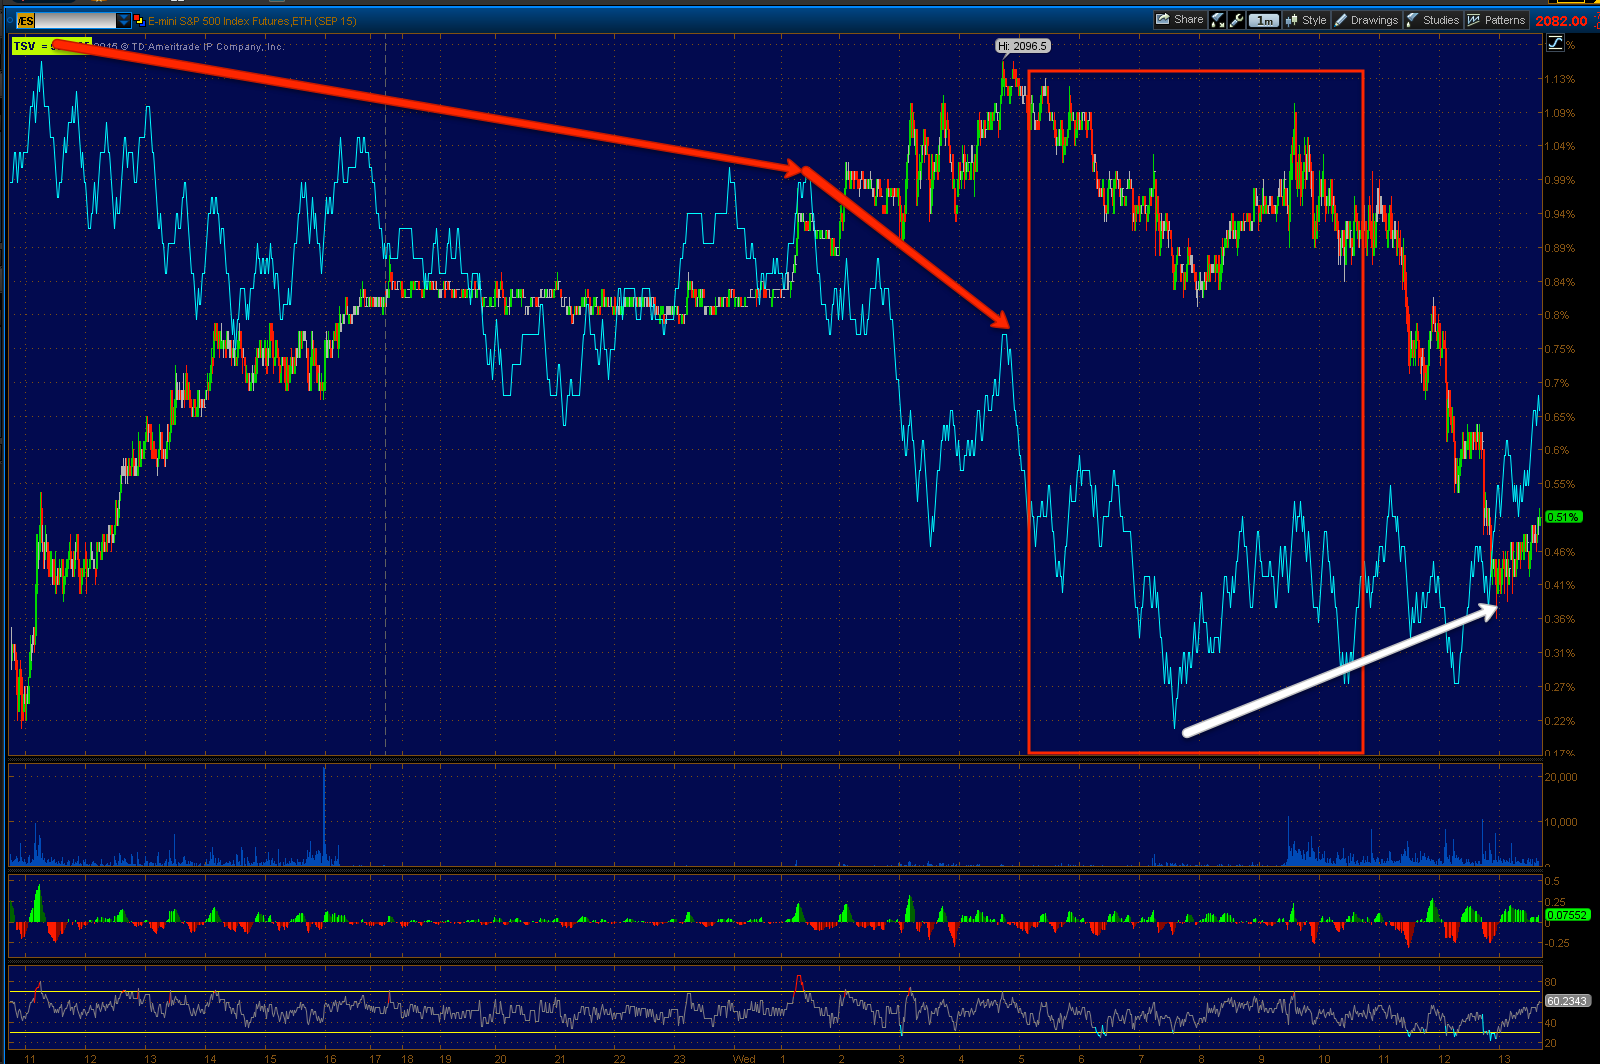
As for the ES/SPX E-mini futures divergence shown this morning in the A.M. Update which looked like this...
ES 15 min from this morning leading negative in to overnight price action.

I can't say it has improved much on our "Knee jerk" pop...
No response from the indicator at all at the Knee jerk pop this afternoon.

On a near term basis, as in Index futures right now, they did show the same intraday positive divergence at the lows which I posted as part of the examples pre-F_O_M_C in this post, Market Update and Initial Trade Plan

It's a little sloppy looking from all the movement, but...
Overnight ES bounce from a very far range earlier sees a negative divergence and send ES/SPX futures lower until just before the 2 pm F_O_M_C, see the same positive divergence posted this afternoon in the Market Update and Initial Trade Plan post.

The difference now is the knee jerk reaction saw a negative divergence which also brought it down off its highs and 3C is sitting near the intraday lows going in to the overnight session.

There's a pretty big mess of short term indications in the area, that's why I'm hoping for prices to trend flat or even just trend and let the signals all untangle from intraday charts. When we are ready to break this SPX 150 sma support, I want to be in place and have a high probability/low risk and most importantly as the other two are really already there, well timed execution.
This week I expected support to be formed or perceived support at the 150-ma of the daily SPX chart, as I said, "Where do you think all of the stops will be lined up?".

Note the candlesticks with the reversal candle in yellow and the confirmation candle in red, today's closing SPX candle is beautiful in that sense. The next move I'm looking for is taking out all the BTD traders who bought in to the 150-day m.a. support.

As for a Greek Debt solution before this weekend, I doubt that the ?Greek Debt Committee declaring all debt owed to the Troika being "Illegal, Illegitimate and Odious" is helping much. In addition as mentioned earlier, there is a huge rally in Athens, the people supporting their Anti-Troika/Anti-austerity government, so whatever political concerns Tsipras may have had in not reaching a debt deal, seemed to just melt-away. There's not a whole lot of motivation it seems on the Greek side at the 11th, 11th hour to get a deal done before they default and exit the Euro seeing off who knows what around the globe.

This week promises to get more and more interesting with every passing hour.


VXX Calls Still Green, Still Holding

Even after a knee jerk effect like that which seemed to be foreshadowed just before the F_O_M_C policy statement as seen in the Market Update and Initial Trade Plan post which included a VXX chart and intraday turn just before the F_O_M_C,  the position is still in the double digit green and is giving better and better signals since the pre-3 p.m. post linked above.

 An early intraday positive start to the day for VXX with a leading intraday positive divergence, then the pre-F_O_M_C intraday negative, now a return to a more positive tone.

Remember these are not like the stronger 5, 10, 15 min charts that still look very good for VXX upside, these are intraday steering/timing charts.

As for confirmation...
 The 2x leveraged UVXY shows all of the same intraday (1 min) signals with an even more impressive late day positive divergence as the knee jerk F_O_M_C move seems to be losing intraday support which it seems is all it ever had if even that.

And XIV, the inverse of VXX which moves with the market, with it's positive right before the F_O_M_C confirming the negatives posted right before in the post linked above and a confirming negative intraday divergence right now.

I'm not going to add to VXX at this moment. If price lingered in the area for a bit longer and the knee jerk didn't fade immediately, with continuing signals along this trajectory, I'd add at that point.

Market Update

I think Yellen has said pretty much everything the market will react to. I think it's very clear there's a knee jerk reaction, it's not the strongest we've seen, in fact it's not much different than a 1-day oversold condition, that's not a change in trends either price or underlying.

Greece appears to have gotten a reprieve from the ECB for the moment  regarding the Emergency Lending facility which means Greek Banks will open tomorrow, however a deal is not clenched, it seems we re no closer to a deal tomorrow, one is not expected tomorrow and there's a large rally in Athens for Syria to stick to its guns, whether they understand what that will mean 3 months from now or not is not clear. It also appears numerous countries in Europe are making plans to shield themselves from a Greek default, the UK is the latest today.

As for the charts, I would not say this is the time to jump in to anything, however there are hints that the time is probably not far off. There are initial signs after the knee jerk move that are not only telling us this is a knee jerk move, but that it is starting to lose some of its juice.

Since this is very early in this particular move, we have to go with what we have, which is why I believe patience is still the right course. Would I have chased the knee jerk move with sufficient evidence to call it a high probability? Not unless I could say I also knew what the outcome of the Greek situation will be with high confidence. Otherwise, you're inviting overnight disaster.

Here are some chart examples of early signals coming in... Remember these are intraday, not any different than the intraday charts posted just before the F_O_M_C, which covered pretty much all the same assets, Market Update and Initial Trade Plan...

 SPY intraday deteriorating

 QQQ intraday

IWM intraday

VXX intraday seeing some positive reaction building

ES is really unchanged from the overnight trend, as for the knee jerk it is deteriorating as of the time of this capture.

The TICK has lost pretty much any sense of trend.

I'd prefer to let things mellow out a bit more, give very clear short term signals, but I think there's very little reason to believe this was anything more than what Im always warn of, a F_E_D based knee jerk reaction which are almost always the wrong reaction and usually retraced within a couple of days, sometimes more, sometimes much less.

HYG Clue

We often see, one of the first levers the market turns to when it needs support or an end of day ramp is High Yield Corp. Credit. HYG was flat earlier this week or lagging, yesterday , while not very impressive, it improved enough to support the 1-day oversold condition bounce we had expected from Monday's oversold internals.

This is one of the first places I look to see if there;'s intentions on ramping the market higher. So far I don't see much at all to suggest that. I'll show HYG when I get a chance, but it is one of the dead give-aways and it's not flashing any screaming warning signs that a knee jerk move or anything more serious is being set up. If anything, the charts there are in line with HYG making a new primary trend lower low.

Quick Update

So far it looks like a knee jerk reaction, not a particularly strong one. The actual policy statement had some very hawkish (not good for the market) aspects to it, such as nearly 2/3rds of members seeing interest rates at the end of the year reflecting 2 rate hikes this year, all but guaranteeing a September hike.

We still have the volatility and knee jerk movement of Yellen's press conference, I think that's where we'll see the most volatility.

Keep your eye on the NYSE intraday TICK, it should give early warning and tell you a lot more about the internals of the move. For instance, things are moving fast right now, but you want to see a bigger trend, still it foreshadowed intraday weakness on about a 1-2 min timeframe.

TICK breaking the channel, price stalling. The market is getting nervous in front of the Yellen press conference, however as I said, I think that's where we see volatility, that's where we likely see the moves that set up trades that have strong probabilities.

Patience is hard with a market moving like this, but I think if you're not competing on an HFT speed table, you shouldn't try to fight that fight, you'll lose. Make the market fight on your terms.

Market Update and Initial Trade Plan

Since there's nothing we can really do to divine what the F_O_M_C policy statement is and more so, what Yellen says at her press conference after which can be just as moving if not more, I plan on waiting for the typical, likely knee jerk move and then looking at the knee jerk move and seeing if there are opportunities there, that's where I want to trade as the uncontrollable aspect will have past, price should move and we should be able to see if there's a strong trade set up.

As for the market, it got more and more ugly as the day went on, it could simply be fear in front of the F_E_D, or it may be the set up of a knee jerk reaction, while they sound random "Knee jerk", they are often set in advance as price movement is the fastest reaction to the F_O_M_C so that will initially define the perception long before anyone has a chance to actually read what the F_O_M_C said.

This should give you a rough idea, although there are too many assets, too many timeframes, too many charts moving too fast to cover this in depth, but I think this is a good basic example and shows the wisdom in waiting as outlined above.

First the SPY and ES which was showing negative divergences as was ES overnight in the A.M. Update with a 10 min negative and a lot of damage. I believe this is the true underlying trend, but that doesn't matter if they you can't hold the trade and they can shake you out.

ES
 Es 10 / 15 min leading negative , this makes sense with rice action today thus far, I believe ultimately it will make sense with price action after the F_O_M_C typical games (we see them almost all of the time, the last meeting was much more subdued though).

Es 10 min chart leading negative off the 150 ma bounce.

Intraday ES has been negative since last night and it has moved in accordance with the divergence, giving up considerable ground since the overnight session, however this is my point, see that small positive divergence to the far right? That may be nothing or irt may be the set up of a knee jerk reaction, remember they are almost always wrong and almost always retraced within several days, but when you first see them, they don't look or feel wrong and that's their reason for existing, knocking you out of the trade.

SPY
 SPY 3 min and the two bounces off the 150 ma (white) with two negative divergences off those bounces, remember yesterday's charts and internals, horrible for such a move.

 SPY 5 min also leading negative and price has moved as would be expected for that signal, the two charts above are the stronger signals, but the more immediate one is the chart below.

SPY 1 min negative in to today, confirmation n the downside and that same little 1 min positive to the far right.

VXX
 The 5 min chart leading positive in a huge way, but I didn't put out an additional trade/buy idea.

 The 10 min looking good here too, but just like ES, SPY and a num,her of other assets...

The weak, but more immediate 1 min intraday VXX chart event negative just a bit ago, which is why I would't put out additional buys yet.

Everyone is going to be reacting emotionally and moving al around, chasing the market if history is any judge. I think we are best served to stay patient, let the uncontrollable part we have no idea-the F_O_M_C- pass and the one jerk start if it will be there. Then lets see what's under the hood and let the trade come to us rather than chasing emotional games, again if history is any judge.

Unless we get a big fat rate hike surprise...

Quick USO Update

I'll be going to radio silence for the next hour or so in front of the F_E_D. News outlets already have the F_O_M_C policy statement , just on embargo, this way people like the WSJ's Jon Hilsenrath (notorious F_E_D mouthpiece) can have 600 word commentary out 3 minutes after the F_O_M_C policy statement is released and commentators can speak like they are intelligent on the subject on the fly, thus it's a good time to be looking for leaks, again it does';t have to be the board of governors, in fact I doubt they are, but a half a million from an investment bak to some schlep at a financial media outlet might look rather appetizing.

As for USO, mostly as suspected, API volatility, EIA knocks the upside down which may become a pattern with the API data in the thing volume hours after the market close and the EIA right smack dab in the middle of the cash market, but more than that, if there's an improving situation with 3 consecutive weeks of draws now, Wall St. will want in  and in bigger size, it sounds counter-intuitive to what Technical Analysis teaches about institutional buying, but they aren't  going to chase prices higher, they'll knock them down and buy as cheaply as possible which is why  I've been expecting USO to break back under the base area's resistance (top) trend line around $20.25 convincingly and finish its basing work there before a potential primary trend upside reversal that can hold.


 Note the 3C trend, it has been moving lower mostly in downside price confirmation. The little bump in USO didn't move 3C, it continues lower as if price should too and now price is, the hallmark of a small head fake move.

 Crude futures larger 10 min chart shows the same trend lower with a head fake move in crude , mostly on the API data, which looks like a nice little manipulation arrangement they've been using the last few weeks.

 As for the 2 min intraday USO chart, note the negative divergence in to the last EIA release on Wednesday the 10th and the one in to today which is much larger even before the leading negative divergence.  This is one of the reasons I've kept the USO puts and equity short open.

 This is the daily chart and base, note the head fake move above a flag-like price pattern, it's a channel buster of sorts (small).

And a closer look, usually channel busters once they fail, have a fast reversal (to the downside in this case), we already have a bearish engulfing daily candle, but I still would like to see a convincing break below the $20 area, then we can manage these trades and start looking at the next.

XLF/Financials Broad Update

I don't really have time to go over each of the charts because of the F_O_M_C and looking for clues, but this should give you some idea based on our concepts, based on the charts as to why I like Financials short, despite the talking heads that believe financials will benefit from rising rates.

 The 4-day chart (I usually use 5-day, but this was just a better fit for the zoom presets) . At "A" we have two failures to meet the upper trend channel resistance trend line, at "B" the sharp October sell-off, which as you'll see acted like a Channel buster for price just after which is a concept everyone should be familiar with, if you need information on the concept let me know and I'll get it to you. At "D" we have the triangles in the major averages and industry groups through most of 2015. Unlike the bullish looking SPX's ascending triangle, the Financials had a symmetrical triangle like AAPL which has no bias other than the preceding uptrend so it would be taken as a bullish triangle as well by Technical traders even though these are way too large to be consolidation/continuation triangles.

At 'e' we have the break above the triangles expected, the SPX ended with a head fake move in May on the breakout, failed and headed lower , below the triangle's apex. Financials are still in the area and I still consider it a head fake move, thus a decent area for entries which is why we added Financials short recently.

Here's the October low which is a channel buster here and produces the normal channel buster, high momentum reversal bringing XLF back from below the channel to the upper trendily which it had missed twice previously before the October sell-off. This led to the Sym. triangle and the same breakout above we forecasted for the broad market as well as forecasting it would be a head fake/false breakout.

Here's the SPX in white compared to XLF in green on a daily chart in the area of the triangle and head fake in the SPX. As I have said numerous times, most industry groups and stocks will follow the market directionally, at least 2/3rds so knowing what to expect from the broad market gives you a good idea  of what to expect from any individual asset which is why even intraday Market Updates can be helpful for individual or specific stock positions.


The 22-day moving average that we use in our X-Over screen has been holding well for XLF, which means the X-OVer screen is probably a good tool for XLF analysis.

You can see the last 2 candlestick reversal signals to the downside as well as support on increasing volume at the white arrows, remember it just has to be increasing over the previous day, which makes these reversal candles 3-4 times more effective than without the volume as we see to the far right at the yellow arrow,

The daily XLF 3C chart (negative).

Interestingly XLF's leading negative on a 60 min chart confirmed by...

FAS, 3x long Financials leading negative on a 60 min chart.

FAZ 3x short financials leading positive divergence on a 60 min chart.

UYG 2x long Financials leading negative on a 60 min chart and...

SKF 2x short Financials leading positive on a 60 min chart. That's a lot of good confirmation in multiple assets.

Starting from the shortest timeframes in XLF, the 1 min'
3 min

5 min

10 min

15 min

And 30 min.
The 60 min is above. We also have good multiple timeframe confirmation as well.

I like Financials in the area short as its an excellent entry and much lower risk than say something like an entry in transports right now.