I hope everyone had a relaxing, safe weekend.
I'll start where we left off Friday which is the 3C chart action in to the late afternoon on an op-ex day, it's never price that tells me much as the op-ex pin releases because most contracts are cleaned up by then and the pin no longer matters, it's the underlying action
because that is what I see most often, pick up right where it left off near the close on Friday.
That's the reason for
this post late Friday To save you some time I'll give you the gist, the first sentence/paragraph read as follows...
"If the intraday charts hold up through the close, then I'd say Monday opens up or in the area, however because of the significant damage already in place, I'd think the most likely scenario would be that it closes down, perhaps that bearish engulfing pattern I was talking about in PCLN, it would fit well in any of the averages as well."
Even though we don't have such an open so far in futures...
ES (SPX) Futures open Sunday night below Friday's closing print and move lower thus far.
The rule applies to the averages in regular market so the opening futures Sunday night wouldn't apply, it would be the early trade Monday. Looking at the closing intraday charts, it's a coin toss as some like the SPY held in to the close and others didn't, but all in all, I tend to agree with the basic assumptions of that late Friday post, once again with an additional area highlighted as well...
"If the intraday charts hold up through the close, then I'd say Monday opens up or in the area, however because of the significant damage already in place, I'd think the most likely scenario would be that it closes down, perhaps that bearish engulfing pattern I was talking about in PCLN, it would fit well in any of the averages as well."
One of the reasons I can see this is the charts (intraday late Friday), another reason is that SPX 1800 isn't that far away and it's a major psychological factor and it's less than 2 points away, that's a fraction of a fraction of a point away. Friday the SPX was up +.42% (less than half a percent ) on SEVEN and a HALF Points, we need LESS THAN 2 POINTS!
How can we not go there?
The Dow-30 is less than NINE POINTS away from 16,000, it moved 85.5 points Friday for a 0.54% gain. AGAIN MY POINT IS, THESE MAJOR PSYCHOLOGICAL MAGNETS ARE A FRACTION OF A FRACTION OF A PERCENT AWAY.
The third reason is in the paragraph above from Friday..." I'd think the most likely scenario would be that it closes down, perhaps that bearish engulfing pattern"
Something like this perhaps...
16k is hit, any orders above that can be taken and we "could" end up with a bearish engulfing pattern like this, that part isn't in the intraday 1 min charts, that's in the more important ones.
Those reasons can be found in this post from the EOD Wrap Check out: High Yield Credit in that post in to the close, or the 60 min VIX futures, the intraday VXX, the spot VIX Bollinger Band Squeeze, the ES 30 min chart in to the "Head-Fake" area or the NQ charts of the same, The IWM or QQQ charts, look at the Financial sector charts or Technology and DON'T MISS AAPL. These are the reasons a candle like the one above is not hard to imagine with the intraday charts from Friday in the post linked at the top of this one, I could keep going, but there are a lot of posts dealing with things more specifically.
As I look at the area I think is VERY high probability a head fake area after nearly 2.5 weeks of FLAT trade in the major averages (as we see head fake moves so frequently at reversals and especially important ones, which Is why I expected one after the range was so well defined after nearly 2.5 trading weeks of flatness) I also took a look at some other indications that I found interesting.
For example...
The cycle is clear across all of the averages, it started at 10/9 lows in all of the averages,
showed reasonable stage 2 markup after the stage 1 accumulation in to the 10/9 low and then the distribution area in to the flat trading range which is one of the most obvious places we see accumulation and distribution.
I typically say about 80 of all reversal in any asset and any timeframe have some sort of head fake move, "The Igloo with Chimney" which is similar to the SPX above.
The yellow arrow represents the nearly 2 and a half trading weeks of flatness/choppiness...
HOW FLAT? The SPX gained about 0.45% during that area of nearly 2.5 TRADING WEEKS!
The IWM is similar (Russell 2000)
except instead of a false new high breakout, the IWM put in a bearish "Channel Buster" which I think is going to be a text book example of how a Channel Buster works and one of the reasons I decided Friday to add an
IWM December $111 Put in addition to the SRTY (long) trading position.
The 3-day head fake isn't to a new high as the IWM was already trending down, but the 3-day head fake move is the same, it's just a different type of a head fake move.
 The NASDAQ 100 looks almost exactly the same as the SPX, the same range, the same 3-day move above the VERY OBVIOUS range and creating what would be the same head fake move we see at reversals which in this case would be called a bull trap rather than a channel buster.
If we look at the 5 min charts of the Index futures for these areas (where the head fake moves occur) we get a pretty clear picture of underlying trade not just in the averages, but Index futures.
ES 5 min 3C chart over Wednesday, Thursday and Friday, the same 3-days.
TF 5 min
NQ 5 min...
Notice a theme? You may remember the IWM charts as well, I sure do, they're beautifully formed.
BUT THIS ISN'T BREADTH, THAT'S WHAT I WANTED TO SHOW.
Breadth doesn't lie, it's a straight count of how many stocks did or did not participate and gives you a good feel for the strength of a market or weakness.
For example, as the SPX was making new highs Friday, of the approx. 2800 NYSE stocks, only 228 made new highs with the SPX making new highs!!! Would you not find that troublesome?
These are "Breadth Charts", they compare (typically) NYSE component stocks vs a comparison symbol which I have set to the SP-500.
Looking at the NYSE Advance /Decline line I see an A/D line (green vs SPX red) that hasn't cleared
last month's A/D high and certainly not with the SPX. THE LAST TIME THE A/D LINE DIDN'T MAKE A HIGHER HIGH IN AUGUST THE SPX LOST -80 POINTS.
The NASDAQ Composite (ALL NASDAQ listed stocks)
isn't able to clear last month's A/D high either...AND THIS WHILE WE ARE MAKING NEW HIGHS? With the Index 3C charts and averages, credit, Leading Indicators, etc,
it's not hard for me to believe these are the head fake moves we expected after the range became so clear (plus we hasn't seen a head fake move to that point) and the head fake moves that accompany a reversal so often (usually JUST BEFORE the reversal).
Looking at the
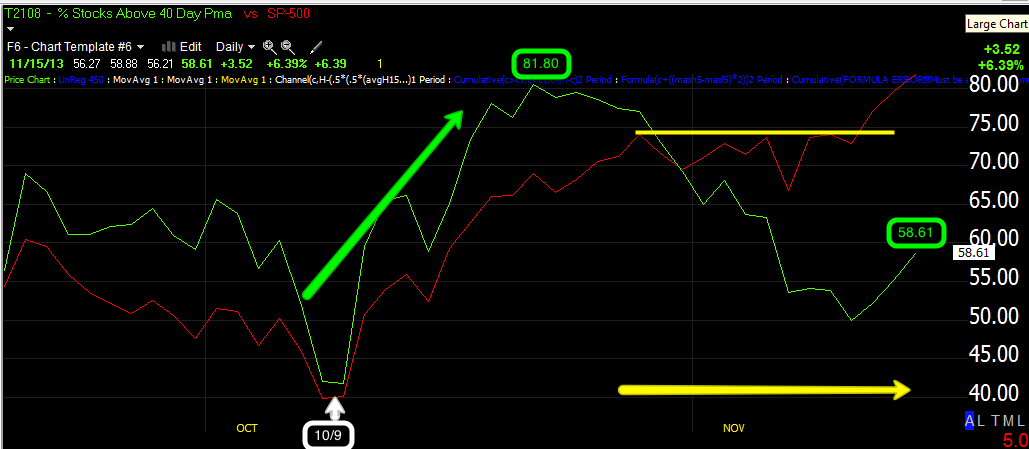
Percentage of NYSE Stocks that are ABOVE their 40-day price moving average, since this cycle started on 10/9 they rose as they should have in the "mark-up" phase to almost 82% of all NYSE stocks trading ABOVE their 40-day price moving average.
However, as the SPX breaks out the last 3-days above the range, that percentage is now 58.61%! Wouldn't you expect it to be at a new high above the former 82% high?
The Percentage of NYSE Stocks Trading TWO-Standard Deviations Above their 40-day Price Moving Average (these re typically the momentum stocks) has dropped from 42% when the SPX was actually lower (red) to a mere 17.13%!
Forget 3C, forget Leading indicators, this is cold, hard math, there's no interpretation here, there's no bias, there's just fact. You have to decide what you think of those facts, I've spent a good part of my trading career watching market breadth and this is not good, it's not typical.
As for the longer term 3C trends, I've showed you the daily Index futures and what has happened in 2013...
ES daily 2013...
NQ Daily 2013...
TF (Russell 2000) daily 2013...
Now look at the Percentage of NYSE stocks Trading Above their Simple 200-day Moving Average (a measure many use to determine whether an asset is in a bull or bear market)...
From the New year 81+% of NYSE stocks were above their 200-day moving average. In May that dropped to a HIGH of 75.43%, in July at the high, 61.12%, then 55% and now 53%.
Nearly half of the NYSE is trading BELOW their 200 day moving average, but more specifically, as the SPX has gained 5.18%, the percentage has dropped from 61% to 53%, at the lows, 43%.
I think there's more than just 1 cycle (timeframe) that we need to be looking at here.
As for what's ahead...
We have a lot of F_E_D speakers this week, an unusual number, I wonder why? Could it be the release of the F_O_M_C minutes on Wednesday? Remember the last time the F_O_M_C minutes came out and half the participants wanted to end QE by the end of 2013 and the market nearly dropped a... rock? Then after the close, Bernie comes out saying that "Accommodative Policy" is here to stay for a long time?
Then the market went nuts to the upside, I was saying the entire time, He's not talking about QE, holding interest rates low until 2015 as the market expected is "Accommodative Policy", "He's using ambiguous, plausible deniability" to counter-act the horrible F_E_D minutes!
Then after a few weeks Bernie said, "I never said anything about how long QE would be around, I was talking about holding interest rates down for at 6 months after we conclude QE" !!!!!
In any case, there's a lot of speakers there, a lot of chances for all kinds of knee jerk reactions as they are both doves and hawks.
In any case, there are a lot of charts looking really bad, really quick, I'll be looking at AAPL early in the week as it seemed to fall apart almost instantly.
Have a great week, I'll see you in a few hours.