Thursday, September 6, 2012

Risk Asset Layouts

Always keeping an eye on those things that others ignore, here's the Risk Asset Layout close and some bonus charts

 Commodities were off sharply today, part of that seems to be the SPR rumors as oil was hit hard. The core short in USO is now 0.23% away from a profit. Obviously this was more than just oil hitting commodities hard.

 Here's USO vs the SPX

 USO volume was quite high today, also note the churning candle at the red arrow which was on the EIA Petroleum release with a heavy draw this week of -7.4mm barrels, although I would have thought USO would have behaved the exact opposite.  This churning on very heavy volume could very well have been retail stepping in on the buy side given the heavy draw and smart money using that demand to move a lot of shares quickly. I feel good about the USO position as well as the XOM, although with IOC as well, there's a bit too much exposure to energy.

While the SPR rumors may be an added benefit to the USO core short, the primary reason for the trade is here and unless the SPR rumors were known and taken very seriously a while ago, I doubt they have much to do with this chart.
 4 hour accumulation/distribution cycle, this is the most common Wall Street behavior, buy cheap, mark up price, sell in to demand and then short, knowing there's little institutional support, a classic cycle and a great example of how cycles work (buying in to continued weakness as their positions are quite large and then selling after a mark up period, in to strength).


The 5 min chart shows an unusually sharp negative divergence so I don't doubt the churning was real on the EIA report.

 GLD, another recent short position on a move above $162.50 also looks like it should be paying off soon, the 30 min negative in to this week's price strength looks great for me.

On a tighter basis,

The 5 min chart is showing great distribution in to this move.

 The Dj-30 vs Copper on an hourly chart is a clear divergence, Dr. Copper. While this has been a good leading signal, it probably has a lot to do with 80% of manufacturing across the globe in recession.

 The Dow Industrials (green) vs the Dow-20 transports, another clear divergence as the manufacturing cycle accelerates in to contraction.

 The Dow 60 min vs Transports, this is a reasonable long term divergence, if yo see how well they have tracked in the past, it's clear there's something not right here.

 HY Credit selling off at the end of the day as the SPX makes a minor move out of the 4 hour range.

 Yields as you have seen before, once in line and confirming the uptrend, now negatively divergence, the SPX almost always reverts to yields, the question is how much further they drop on the way to reversion to the mean.

 The $AUD with horrible performance today, it's clear that today was not enough to encourage any kind of carry trade activity, thus this move today makes sense as the "buy the rumor/sell the news" I mentioned yesterday and which we saw evidence of in overnight trade.

 $AUD with a longer term divergence, I can't recall a serious divergence in the $AUD with the SPX that has failed to bring a reversal. There have been some reversals without divergences, but not the other way around that I have seen.

 The Euro, still close to resistance and still at 2012 record lows on short interest, there isn't much of a catalyst to move the Euro higher. The fact we saw short term reversion to the mean has me very interested as to whether we now see a move lower in both.

Energy in the afternoon performed badly vs the SPX as seen above.

Longer term Energy is dislocated with the SPX, the three most important rally sustaining sectors in my opinion are energy, financials and Tech, this isn't a good sign except maybe for our USO shorts. I mentioned ERY today as a leveraged short play on Energy, it's worth a look.


 Financials saw some late day pressure as the SPX tried to make a move, the SPX has the most exposure to financials of the averages at about 22%.

Tech also saw some late day weakness as the SPX tried to get something together.

I'll be positing more, I will look at Treasuries, Volatility, FB, BIDU, currencies and several internals/breadth I'm interested in after seeing today's weakness in breadth, it's actually rather amazing the market made this kind of move on such poor breadth including AAPL (relatively speaking).

After-Market Futures

 ES positive divergences around the European open last nigh, negative divergences through the day, worse in after hours.

 NASDAQ futures w/ positive divergences at the same time around the European open last night and negative through the day on exceptionally weak breadth readings on the NYSE and NASDAQ, much weaker than I would have thought to look for if members hadn't pointed them out (both members sent their emails individually before breadth was brought up on the site).

Yesterday I suspected a buy the rumor/sell the news trade, thus far today it looks like that i exactly what we have seen. I haven't gone in to what Draghi said, but I did listen to his press conference this morning and there are, as usual, some glaring problems. The market's reaction clearly doesn't understand these problems, if indeed the market was discounting Draghi's plan, but I doubt that's the case, I think it is more likely this was set up in advance as the accumulation in both futures occurred between 4 and 5 hours before policy was announced.


A Look at AAPL

"Lost in the lines" is still a theme, I was talking about this with a few of our long term traders today and the reality of the markets. I tried to show this once before by showing you a portion of trading action in the SPX without any context and the trend was unidentifiable, then showed the entire trend with that area highlighted and if you hadn't looked at the highlighted area by itself, you wouldn't have seen anything other but an uptrend.

Getting lost in the lines can be on an intraday or a daily basis, it's really about being able to understand a historical chart by putting yourself in the moment, if you can do that, you can understand current price action much easier, you can understand that there are few things in the market that are events and most are processes. While finding the best entry/exit is always a goal we look to attain, you can see when you look at the big picture, whether you entered a percent or 2 higher or lower is irrelevant to the big picture.

In many ways AAPL is starting to take on many of the charecteristics of the original/current BIDU core short.

I know at what level the trade was entered, but I don't remember the exact date ( I can find it, but it's not really important).

Here's the area BIDU was phased in to on average at $150 for a +25% profit, the SPX during the same period has returned about 20% of that. Looking back, as long as we knew we had a high probability trade and an edge, 5 months later a day or a week doesn't matter much. The profits from BIDU as a short go in to the account unlike a long which allowed me to pyramid up the position for about another 16% gain on the profits! You can't do that with a long and over this time period, how many trades are out there that can just be tucked away and maintained once a week?

Remember also that this is a core short which means it is about 15% of the overall portfolio value and at this point carries virtually no risk.

Here's why AAPL is starting to remind me of BIDU.

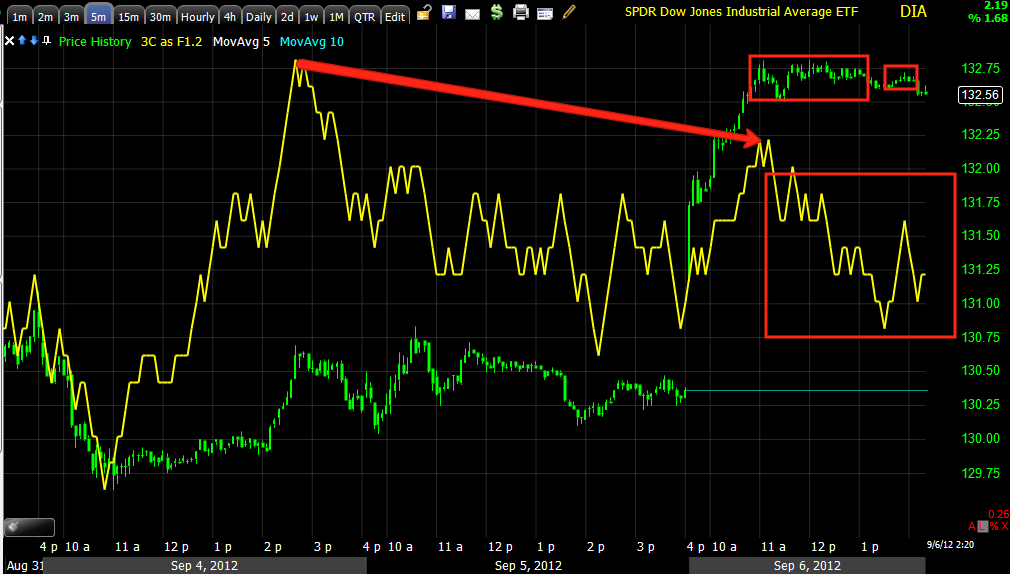
 This is a bit confusing, but there's a pretty big churning day at the red arrow, this is when strong hands deliver shares to weak hands, it's the opposite of capitulation and like capitulation, is usually a defining moment even though the stock can move a bit higher (just like with capitulation of a downtrend often sees marginally lower prices).

The $675 level represented by the white line is where we see the intraday high made for AAPL and it hasn't been able to pass that $680.87 high (remember I wanted to add to AAPL >$680). From the blue arrow to present, AAPL has moved +1.12% over 2 trading weeks, for all intent and purposes a dead, flat range. If you feel like AAPL "keeps moving higher", consider that, an average gain of 0.12% a day.

From the range that developed above $675 in yellow, AAPL has moved a total of 0.10% from close to close, from intraday high to close, it's even less, a loss, less than a percent, but a loss. The point is, this area is similar to the yellow highlighted area on the BIDU chart.

 Adding a few indicators and looking from the original core short entry to present (position is still open at a loss of 10.61% on the position and about 1% of portfolio value), we see some bearish divergences. These are simple, yet effective indicators that can be used on any asset in any timeframe, in the price window is Rate of Change which shows divergences that are useful probably as well or better than any conventional indicator. In the bottom window is simple Wilder's RSI, both show negative divergences at both top areas and ROC even shows a positive divergence at the EXACT area where we saw the strong accumulation in AAPL at its lows.

 Using a daily Trend Channel (for AAPL this is good for swings of decent length), we have a stop at $659, a close below that changes the outlook for AAPL significantly for probably at least a month and it could be much more. I try to always use a closing basis stop on a daily chart. One small hint that will help you with any channel whether Bollinger Bands, envelope channels or my Trend Channel is the "Channel Buster" which at the time (Don't get lot in the lines) seems like a bullish event as volatility picks up, but it almost always is a bearish early warning, the channel buster in July brought a 6+% pullback, furthermore if you were long you not only missed a better swing exit, you probably sat through 3 weeks of opportunity cost. More important to me than the opportunity cost is the risk factor, it doesn't matter what asset/stock you own, whenever your money is in the market it is at risk' look at Mortgage Backed Securities! Who would have thought an investment tied to real, tangible property in a rising market would be the investment class that nearly destroyed our economy and we are still not much better off 5 years later. If I have money in the market, no matter how safe I "think" the investment is, I want to have a really good reason.

 Looking at the 2 min chart of AAPL not only the trend is leading negative, but the intraday trade was as well. From a trend perspective today, AAPL DID NOT perform well; it underperformed the NASDAQ 100 by 1.25 percent and it made a series of lower highs/lower lows. AAPL's +0.91% gain looks good as a function of percent, but looking at the bigger picture, it's not a gain that is worth the risk of today's performance.

 The 15 min chart has a few regular concepts, the breakout from a triangle that failed, but what I really wanted to point out was the fact BIDU was flashing distribution from a larger triangle and we waited for a breakout knowing that the environment was negative and shorting higher prices was a high probability/low risk trade/ AAPL is taking on some of the same characteristics as it flashed distribution in the triangle and at the breakout like BIDU. We have a small positive divergence and a run up in AAPL; I was hoping for $680, but the 15 min negative leading divergence changed my plans, AAPL still hasn't made a higher high.


 The white trendline represents resistance, again the 30 mi chart shows the same theme, distribution already in effect at the triangle and deeper distribution as AAPL was sold/shorted in to strength. This most recent run that didn't make $680 (at least not as of now), is also flashing warning signals.

 The 4 hour chart shows the same theme, except even worse on a more important timeframe.

 Again, today's 15 min chart showed price strength, but at a high cost of a 15 min lading negative divergence. There's only so much institutional support that can be removed before AAPL is standing on one wobbly leg.

 The 5 min chart shows the same BID theme, except in a smaller version which is fine as March-May 1 was a major topping area whereas this is more of ca counter trend move.

Finally on a close up view, the 1 min chart is leading negative.

All in all I feel fine about shorting or being short AAPL in this area and while trying to pick tops is a fool's game, we do try to get the best entries/exits based on data, but there's a risk of losing out on the trade if you are too fancy with entries. I'd much rather have entered BIDU at $148 and still have a great profit than to have missed that nice trade altogether.

This is why I said what I said about AAPL today.

ERY Also W/ Bullish Reversal

Large volume with a hammer like candle-lower prices rejected. This tends to be a turning point.

NQ/NASDAQ Futures

Volume is churning there, not bullish

 5 min fallen apart on NQ

1 min still horrible and volume is picking up on plain volatility, looks like churning

Energy Falling apart

ERY is a possible play on energy/USO-this is an inverse ETF.

Energy Falling apart

ERY is a possible play on energy/USO-this is an inverse ETF.

AAPL Just Hitting Intraday stops <$675.50

Timing?

Without going in to all of the charts of the Risk Asset Layout, intraday signals from the Risk Asset Layout do work in multiple timeframes.

Right now commodities have fallen way out of sync intraday, Credit is doing the same, the Euro is starting to break down, the $AUD is also starting to break down, AAPL wasn't able to make a higher high, it failed and it' starting to fall apart a bit, the Energy sector is flashing red lights, just be aware these are diverging, they are excellent leading indicators and big picture they are at the divergence that they have been at in the past with reversals on a strategic outlook or longer term as reversals are not events, but a process.

I'll try to get some charts so you can see, but be aware this is happening now.

This is why I like the idea of some leveraged Ultrashort or 3X bear ETFs to grab quick coverage, they can be rolled out later when sector rotation becomes more apparent, but they give you directional exposure and the market is so highly correlated any way, it probably doesn't matter a lot. FAZ was an example from earlier today.

Addendum

What I wanted to mention in the last post was an idea I first mentioned yesterday, I alluded to it today. Yesterday I said with the ECB event coming and the EU events are always headline driven then the holes in the plans come out and the moves from EU headline events are faded, it happens almost every time.

In any case, the left out part was my feeling yesterday there would be a buy the rumor (ECB leak from Bloomberg yesterday) and sell the news. If you look at the NASDAQ Futures chart, you can see that happened overnight, in fact right in to the European open as the earlier charts with more history will show the positive divergence around the European open, we have the price move an all indications that it is being sold.

This is as old as Wall Street, but it is particularly relevant with EU "Grand Plans" like the leveraging of the EFSF, the Greek Bailout, the Greek elections, the Spanish Banking Bailout Bazooka of $100bn Euro was a great example and that was faded as bond traders realized all their holdings would be junior to the Spanish banking bailout from the ESM.


Market Update

This is a pretty big update, I'll try to keep comments to a minimum, I through in the occasional trend chart so there's some context to the intraday charts (today). We've seen confirmation in a number of long stocks, earlier today FB was an example so that's what you should see as prices move higher, when there's a lower 3C reading, there's less money flow in to the issue, more out of it, that's the simple idea of it.

 DIA 2 min trend already leading negative, no confirmation at all.

 the same chart intraday close up. Note when the divergence picks up, price stops and is flat, there's no short term buying pressure to move it higher.

 DIA 3 min intraday shows a small acc. area.

 DIA 5 min trend

 DIA 5 min intraday

 DIA 15 min trend, remember the break above the downtrend line was set up before hand with a positive divergence to the left, currently leading negative.

 IWM 1 min trend, green=confirmation, meaning expect that price trend to continue until  divergence interrupts it. This is a bad leading negative trend now.


 IWM 1 min intraday

 IWM 2 min over several days

 IWM 2 min intraday.

 IWM 3 min

 IWM 5 min

 QQQ 1 min, remember the breadth in the NDX today.

 QQQ 1 min intraday


 NASDAQ 1 min intraday mini futures.

 QQQ 3 min intraday

 QQQ 5 min trend

QQQ 5 min intraday

NASDAQ Futures 5 min with an intraday leading divergence

 SPY 1 min trend

 1 min intraday

 2 min intraday


3 min intraday


SPY 5 min intraday