Wednesday, April 6, 2011

Stochastics could be depicting a major top

First of all, I'm not a fan of Stochastics. The idea is when stochastics is above 80 or so, it's overbought and we have been taught that we should expect a correction. However one of the most successful trading systems I've back tested only bought overbought stocks and only shorted oversold, the opposite of how the indicator is supposed to work. It worked because stocks can stay at extreme levels of overbought and oversold for a long time.

Stochastics overbought for several months and didn't produce a reliable reversal

However, tonight as I was tinkering, I noticed something interesting, stochastics combined with RSI can give some impressive, somewhat rare, signals.

 Here with AAPL, RSI is negatively divergent, AAPL made higher prices, RSI failed to make higher highs and the Stochastics signal called the first top, The RSI divergence continued and stochastics called the second top.

 Here in 2007, the first part of the top, ending the uptrend saw a RSI divergence and a good stochastics reversal.

 Here on a weekly chart we see the top of the bull market, RSI is clearly divergent and once again, stochastics calls both tops.

 It's been sometime since we've seen an RSI divergence as you can see, that is until now and this one is worse then the 2007 divergence.

Here a slight RSI divergence and stochastics turn down calls the Feb. top. Now we see an even worse RSI divergence with stochastics in overbought territory, in fact if you look close enough, it's already crossed over its signal line. It's possible that the combination is calling a major top as this divergence is worse then the 2007 top's divergence.

The example of the first top of 2007 had a divergence of -14.25%, the current divergence in RSI is -22.5%. When  use a weekly chart, the 2007 top divergence in RSI was -5% compared to now at -16%

I'm comparing Granny Smith Apples to Pink Lady Apples, but the scarcity of major divergences at major tops forces the comparison. Still, there seems to be something to it.

Channels Broken?

At least in after hours the are. The averages have put together classic bear flags today, this is one reason I said earlier I'd expect a top side break of the chanel and  then a bottom side break down.

 The DIA channel is a bit more difficult to draw because of the 2:20 dip, but I think this channel connects the most dots. You can see the two light blue hash marks next to price below $124.10, that's the after hours bid ask, so they are trading below the channel in after hours. In my opinion, there's still a decent chance of a gap opening or something like that early tomorrow that breaks the channel to the upside. As you will see, the bear flag is very well defined and the channel is tight, it would seem to me that the opportunity to break it to the upside before a downside break (during regular hours) would be irresistible.

 The Q's channel was broken at 3 pm


 Here's an example of a well developed bear flag in the Q's

 The daily chart of the Q's which has traded laterally for the last 6 days, actually down about .25%

And the SPY channel close to support or a possible break. Again, in after hours trade, it's already trading below the channel.

Precious Metals

Here's last night's final word on the PMs

Here are today's charts...

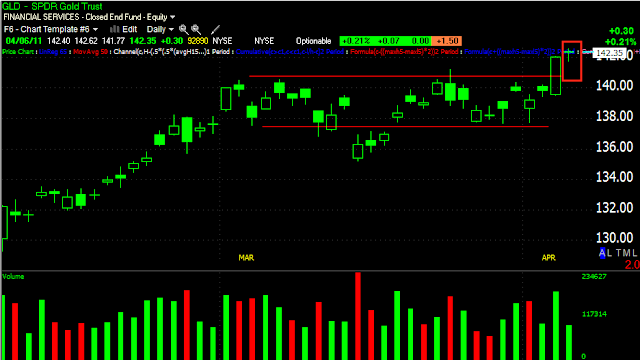
GLD
 Yesterday was a strong breakout move, today is very weak follow through

 Here's GLD's 1 min chart, with distribution on the gap, a little accumulation late morning and what looks to be the first signs of a negative divergence starting.

 This is the GLD 5 min chart and the contradiction I mentioned yesterday, just like today's price action failed to show strong follow through buying, the 5 min chart is also not confirming late yesterday or today.

 Nor is the more important 10-min chart which is why I'm suspicious of this move.

SLV
 SLV started with a weak breakout, yesterday was strong, today again, no follow through strength and volume looks like it will surpass yesterday's

 The 1 min chart is essentially the same as GLD's

 and there's the 5 min chart contradiction I mentioned yesterday

and the 10 min.

Fundamentally I think buying in the PMs makes sense right now, it's just curious that we are not seeing strong follow through action or confirmation.

SPY and QQQ

This is probably a bit premature, but I'm releasing it as early warning is what you expect and because SMH just showed it's first crack of the day.

 QQQ 1 min.

 SMH 1 min finally moving away from confirmation.

SPY 1 min, this may break out on the upside of the channel before a decline and XLF is still looking pretty strong intraday.

Grappling With the EUR/USD Pair

I have to admit, I don't quite understand the dynamics or fundamentals right now between the Euro/Dollar.

As for the Euro, today Portugal issued 6 month treasuries at an interest rate of nearly 5.12%! The last issuance from Portugal was 3 weeks ago at 2.98% which was stunningly high, this is nearly 72% higher in 3 weeks. It's more then clear that Portugal is expected to default and come begging for money from the E.U.'s bailout mechanism.

It's also clear by the way elections are going in Germany that anyone who supports more EU bailouts will not be elected. This leaves a very big problem should Portugal need a bailout and a catastrophe should Spain and Italy also need bailouts (which is not that far fetched). Yet the Euro is higher.

On the US side, we're facing a government shutdown (including the IRS!)  if a consensus on the budget that was supposed to have been passed last October isn't passed by Friday. Although the last minute game of chicken here in the US is getting down to the wire, I'd think that it would be unlikely that a shutdown will occur and if so, not for very long. There's also the issue of the debt ceiling which by most accounts will be breached, especially as tax refunds start to flow out of the treasury. Again, politicians allowing the debt ceiling to be left in place and the effect it would have as the US would be in full fledged default on debt again seems highly unlikely, (I know I'm not doing justice to the totality of the fundamental issues, but these seem like the more pressing immediate issues in a nutshell) yet the Euro breaks out and the Dollar breaks down.

There are some hints though as to which way this is going to go.

 While the Euro (FXE) did breakout through the local highs...

The Dollar did not break down through the local lows. The Euro gained more then the Dollar lost if that makes sense.

FXE
The FXE 15 min chart is negative

 The Dollar 15 min chart (UUP) is positive

 FXE 5 min chart is negative...

The dollar 5 min chart is positive.

So are we seeing a false breakout n the Euro? Right now it appears that way. It also appears that the US fundamental issues are expected to be resolved (from looking at 3C).

I guess we'll find out son enough, however, should FXE fail to hold that breakout, there's likely to be a decent swing short setup. Failed breakouts tend to fall pretty quick, at least on a swing basis. You might want to set an alert to let you know if that happens and you might consider the short trade on the Euro (FXE, currencies, options.)

If any of our economy buffs want to comment on something I'm missing fundamentally, feel free to send me an email.

AAPL Update

Even at 12% of the NASDAQ (that's the guesstimate for AAPL's revised NASDAQ 100 weight), it's still the most influential stock in the NASDAQ 100. Lately AAPL's performance has been relatively weak.

 Here's AAPL vs the market (via SPY) and as you can see, AAPL has been trending down for about the last 7 days completely diverging from the broader market. I don't use the Q's as a comparison because of AAPL's effect on the Q's. This is what you'd call VERY poor relative strength. However 7 days is a bit of a long haul and could certainly be throwing AAPL into an oversold condition, it also happens to be at a support level which has shown support Monday, Tuesday (albeit on a false break below support, most likely to get a mini short squeeze for this morning's gap up) and has found some support again today in the $337.60 area, so relief bounce? Very possible, it doesn't change the picture too much for AAPL too much though. Should this level of support be broken, there's minor support at $335 and major support at $326. I suspect there will be some volatility around these levels, but ultimately I believe AAPL is heading for a test of $326 and ultimately I do think it will break below that level.

The bigger picture via a 30 min 3C chart. There's been distribution (whether in the form of selling or short selling) at all 3 reactionary tops. I say reactionary because AAPL is in at least a broader sub-intermediate down trend making lower highs and lower lows since the false breakout on 2/16. A move below $326 will make the 3rd reactionary lower low and put AAPL into a solid intermediate downtrend. I remain bearish on AAPL's bigger picture, even if it should bounce.

Being AAPL is a bellwether for the market, the action in AAPL should be checked on daily even if you have no intention of trading it.

PCLN Example

PCLN went through the same thing as the market and serves as an example of what I thought was happening and what I think may still happen, it's just a little more extreme and developed.

 On the daily chart we have a series of small bodied candles indicating a loss of bullish momentum, yesterday we had a sort of double whammy candlestick pattern. On Monday there was a hanging man reversal signal, Tuesday a doji which in itself is a type of reversal signal and that Doji fell in the middle of the hanging man's body from the previous day which sets up a 3rd, although poorly formed, Harami reversal. Today PCLN gapped up allowing selling/short selling into strength and trapping bulls, the current position engulfs not only the doji from yesterday, but the hanging man from the day before as well. PCLN could close even higher and still have a very strong reversal/confirmation signal. So I'm watching for the market to close with a similar daily candle like we see in PCLN today.
As for 3C, it's almost exactly the same as the market except this is on a 5 min chart. There was distribution into yesterday's highs and then small accumulation into the close, then the gap up and a failure to hold.

This would be a pretty good spot to try out an initial short on PCLN, especially if we get an intraday bounce to short into on some strength. From the looks of the 1 min chart, I think we will see that intraday bounce along with the market.

I'm going to live!

The doctor didn't say that, but I'm pretty sure you can't die of herniated discs.

OK, to te market action, so far, this is what I suspected. Yesterday we had late day accumulation into a falling market which did not move the market up on a 1 min 3C chart. This usually means that they are accumulating for another reason and that was to take advantage and sell into this morning's gap up. A few things that led me to suspect this, the accumulation was an afternoon only on a 1 min chart, it didn't continue today, instead the market gapped up, so in essence, the relative size of the position was small. If the market continued down this a.m. with continued accumulation, I'd think they were accumulating for a bigger move, that wasn't the case.

Here are some charts of the SPY.

 Today's gap up could be the first component in a bearish engulfing candle, which is a reversal candle. If the market closes where I drew in the yellow portion of the candle (above the arrow on this daily chart) then we have our bearish candle/reversal signal, it's actually a confirmation as yesterday's shooting star-like candle is a reversal signal. So the first component is the gap up which is filled and fails, so far it's about filled.

 Here's the intraday action and once again, if we get a bad or lower close, then this mornings gap up was the typical false move we see before 85% of reversals. Note the heavy sell side volume.

 The 1 min chart failed at 10:45, right now there's a slight positive divergence which may alleviate an intraday oversold condition as we are close to support (yesterday's close).

 The 5 min chart has been nasty, it went negative at yesterday's highs and only late in the afternoon did we see 1 min accumulation, it never made it to the 5 min chart and the gap up was very negatively divergent as 3C didn't even try yo move up. Right now it's in a leading negative position.

The 10 min chart shows the same selling at yesterday's highs and again, no movement up today.

I'm a bit surprised SMH hasn't come down yet, we'll see though as the day is still young.

This looks like a classic set up to sell at higher prices and trap some bulls.

Yesterday's Late Day Accumulation

We are seeing that strength I talked about in this post yesterday  saying, "If some strength doesn't materialize into the close, I'd be looking for it on the open tomorrow. "


We did not see that strength on the close, just continued accumulation for this morning. 


 AMSC is set to gap down nearly 50%

 The Q's to and other averages to gap up

 SMH to gap up

SPY to gap up.


What will be of interest is to see what happens in SMH first and then the market. I don't see anything in the news particularly strong about today, but something was happening late yesterday. We'll see if these gaps are filled in short order.


I have a Doctors appointment at 10 a.m. for my 4 herniated disks, but I should be back around 11 a.m., 'll be watching my email and the market.