Monday, December 6, 2010

Well maybe one surprise.

Checkout the article from the TeleGraph on julian Assange's arrest warrant.

Here's the truly surprising bit... Let me preface this by saying rape is a horrible crime that I think is as bad if not worse then murder, I'd treat the two the same. However, it is surprising to see this bit:


"His details were also added to Interpol’s most wanted website, alerting police forces around the world."


Hmm. Sounds like more then meets the eye.

No Big Surprises Today

I'm going to be out for a few hours, any emails I'll answer when I get back. Tonight is my wife's birthday and being she's from Hungary, today is the day they celebrate Santa Claus-Mikulas.

All in all, as I pointed out last night, the fading momentum (like the first example I put in a red square box) is very much in line with resistance and a reversal so today was more or less what I expected or rather how the market typically responds-momentum on a bounce, fading momentum, a stall and a drop from the stall. Friday and today (more so) with negative returns on the averages, represent the stall and in the zone of resistance for a "Kiss the channel goodbye" bounce.

There were a few interesting events today and possibly some good trades opening up, I'll cover those tonight.

See ya soon.
 SPY 5 min deteriorating

Note the obvious triangle, a break below the red arrow would show this to be manipulation of another common pattern black-box programs seek out as traders react to the breakout the way they have been taught for nearly a century.  Thus these black-box programs manipulate obvious patterns like this triangle, they profit in many ways-order execution, running stops, volume rebates, etc.

A tight vote in Ireland

Just got a boost-from the NASDAQ 


Follow Up Post

Friday, I posted this article on the Euro/ US dollar. It looks like for now, the consequence I was looking for has come through today, but before I'd go knee deep in correlated positions, the Ireland vote tomorrow could influence the outcome.

However, this is a good lesson for trying to time pullback entries. As you'll see in the post, the first pullback of a move tend to be to the 10-day moving average, the second around the 22 day moving average. As the trend progresses, typically the pullbacks get a little deeper. If today's reversal holds, we should see a new low in FXE, a new high in the dollar and the next pullback should be solidly to the 22 day moving average.

Watching a Real Time Fight

Between Blythe Masters of JPM and the Silver/JPM vigilante-viral crowd and who knows who else may have a dog in the fight. As I said yesterday, $29- and maybe $30 is a line in the sand it appears. It may be above that level JPM gets margin calls on their "supposed" naked shorts. Naked shorting means that you are selling short assets you have not borrowed (you can not do this), that means in a short squeeze they need to go into the market and find the supply. So this looks like a real time fight between the two sides.

 the 1 min chart looks like someone came in with some firepower trying to knock SLV down.
The 5 min chart shows this may be an uphill battle unless they can really ear apart that 1 min chart.

Buying a Silver Miner

I listed several Silver Miners over the weekend, if you want broad exposure you might consider the SIL ETF.

Here's information about the ETF and its holdings.

Update

Something I just noticed on all 3 charts using the 5 min 3C.


NFLX on the Radar

This stock was run up so high in a ponzi-type fashion during the earlier QE regime, there is the possibility of significant downside should it break down through it's normal volatility range.
 Here's the cross over screen (daily chart), you can see in the green boxes the long signal, we are still on a long signal, but there has been technical deterioration. The pullbacks on NFLX lately have been deep, all the way to the red VWAP, a break below that VWAP around $175 would be the area in which I would consider this a decent risk:reward trade, although some traders may wish to phase in earlier.

This is my volatility based Trend Channel I use for stops and reversals, interestingly the daily stop as of now is around the same area @ $175.

The daily 3C chart shows where the technical deterioration has come into play. The green arrow represents confirmation of the uptrend, just recently it's seen it's first negative divergence and remember last week's disclosure that the CEO just sold 100,000 shares and is left with approximately 56,000. I believe there have been a number of former sales as well by insiders.

 This morning's 1 mn chart, not too important right now.


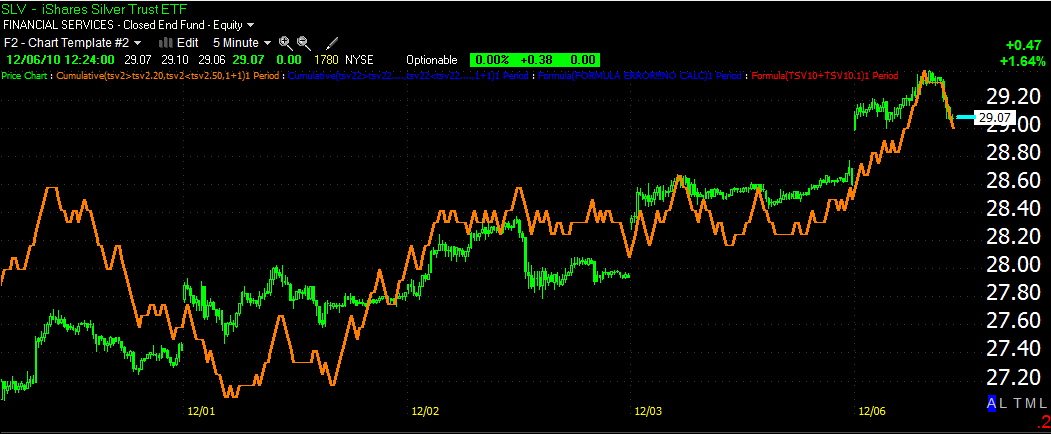
 The 5 min chart shows a negative divergence around the same area we see it on the daily chart.

The 15 min chart shows confirmation (green arrow) and then a negative divergence the same place as the other 3C charts.  This one also shows a negative leading divergence and I threw in a long period TSV showing the same.

Keep this one on the radar.

Black Friday Flash Crash

You may remember I was surprised to see quotes coming through after 1 p.m., I figured it was a data error with my charting system, apparently not.

http://www.zerohedge.com/article/presenting-reason-thanksgiving-after-hours-melt-down-another-electronic-glitch