Monday, September 10, 2012

Probabilities...

As was posted later in the day today, the S&P and NASDAQ Futures on a 1 min 3C chart put in a positive divergence.

 The positive 1 min divergence in ES was right on, it completely halted the decline which was growing more and more parabolic in to the close and at the start of after hours. I can't confirm any positive divergence past this 1 min timeframe, it could grow from here a bit and put in a decent move, either intraday or.... (depending on whether the divergence grows or this is it).

 There's little doubt significant damage was done to an already very weak chart as all of that negative leading divergence was from today alone on a 15 min chart which for futures are much bigger positions and more important signals, this would be similar to a 30-60 min negative divergence on a SPY chart.

 The NASDAQ mini Futures 1 min positive divergence also halted the slide and has grown to a leading positive divergence, this would make me think that we should see some upside from this area, even if only overnight.

The leading negative divergence on NQ is out to 60 min, like a 4 hour chart for the QQQ, so again, significant damage was done today to a chart that already had been under distribution for some time.

As for the usual averages...The story is the same among all of them with slight differences.

 I can find 1 positive divergence on all of the averages like the DIA 2 min timeframe which is a weaker relative divergence, but...

 move to the next longest timeframe (3 minutes) and there's no hint, in fact quite the opposite. As you know a divergence starts on early timeframes and if it is strong enough it will migrate to longer timeframes, there is no migration here, but it may also need more time. It appears to me that in most cases, the divergences started around 2:30-3 pm today.

 IWM 3 min relative positive, the IWM has also had the VERY BEST looking underlying trade.

 Yet the 5 min is solidly negative.

 The QQQ 3 min with a relative positive (the divergence didn't start at 11 a.m., that is merely the relative comparison, it started closer to 3 pm.)

 The next longest timeframe, 5 min is solidly negative and leading to lows below price last week.


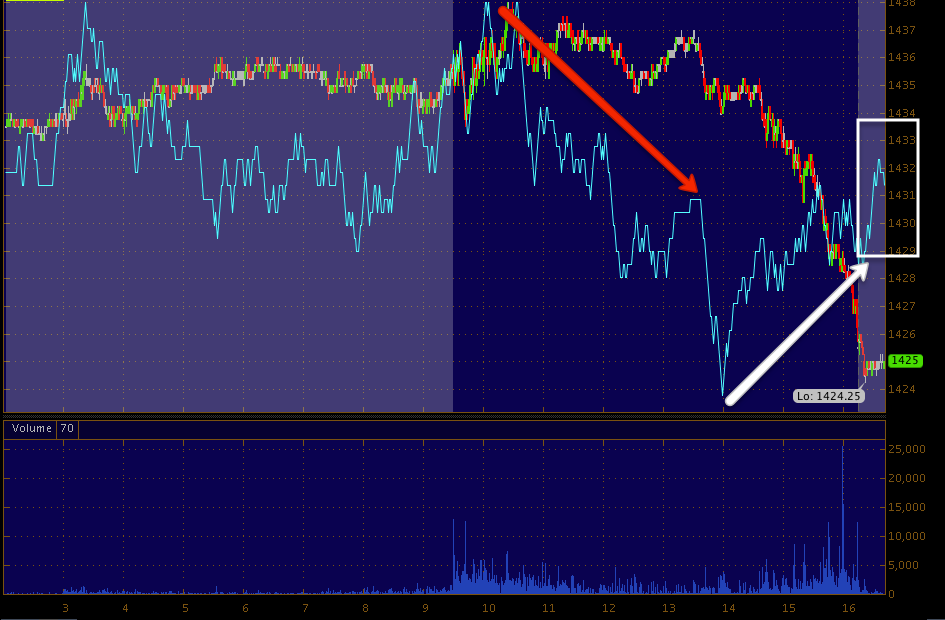
 SPY 2 min relative positive...

The 3 min is very negative.

I suppose the Futures overnight will give us our first clue as to whether these averages see more building or not, but I would think with some positives in place, as minor as they may be, futures should hold on at least until the open (in underlying trade).


With the I-Phone 5 coming out Wednesday, we have some interesting information today on the back of a -2.63% drop in AAPL and another -.40% in after hours trade putting AAPL at $660 ($3-$5 away from some stop congregation levels). We learned today that in a poll conducted, 88% of Americans said they can't afford AAPL products and another 51% relied on credit to purchase an AAPL device.

Later in the day we learned that revolving Consumer Credit is on the decline with the largest sequential (2 month) drop since Q1 2009. Whether this has anything to do with AAPL's performance today, I have no idea and I don't really care, but it is curious.

As mentioned earlier today, I've been waiting for AAPL $680 to fill out the newest Put position which was completed on 9/4. The September portion of the position is close to breaking even, the October portion is up 17% today as AAPL closed red for the month today.

A weak relative positive divergence on the AAPL 5 min chart can be just seen, beyond that, damage.

 AAPL 5 min in a deep leading negative 3C trend with a small relative positive divergence
Note I used a 10 min chart from Telechart which has less history, the 15 min is solidly negative, but the 10 min is the next timeframe and I can't get it on SF, you can see there's significant damage here.

So the bottom line is how do the Futures 3C trade (not price) hold up overnight? Do they build of just maintain position?

In either case, major damage was done today to an already large divergence and period of heavy distribution.

Curiously equities underperformed just about every asset class out there, they have also been the most extreme in their moves higher. It seems that the best case scenario was priced in already and is being re-priced, but that is not the way we have found the market to work. More typical is the moves needed to get buyers to step in and create demand are sold in to by smart money and that appears to be exactly the case here as we can see divergences worsen right at specific breakout levels.

I find it strange that there are macro-fundamental events that "could" have a big effect on the market coming as soon as Wednesday, yet risk is apparently off the table well in advance of that, when normally a holding pattern would be more appropriate. I can't help but wonder if smart money is a bit smarter or better informed that the law would provide for.

As for some other positions performing well, UNG, our 1 favorite long position acted well today in the face of a melt down, up over 5%, but we expected UNG to strengthen this week.

I can not due the ECB issue justice in this piece alone, but first lets review what the ECB did and did not do. They did not adjust rates, they were left unchanged. The SMP bond buying program is effectively dead, replaced by the new bond buying program which is drastically different, here are some of the highlights (keep in mind that the German Constitutional Court's ruling this week could significantly impact the ECB bond buying and could make conditions attached to it different than originally intended -even though we have few details on those conditions).

-The ECB will purchase sovereign debt in the secondary market (much like the F_E_D, the ECB is forbidden from participating in initial auctions).

-The ECB will buy debt only up to a maturity of 3 years (when EU countries have sought bailouts because rates were prohibitive, effectively locking them out of debt markets, it has always been the 10 year bond that has been the benchmark-what the ECB thinks they will accomplish with 3 year debt that is beyond me).

-The ECB will HOLD the debt until maturity with specific caveats. This is where Germany has a major disagreement as the ECB's charter prohibits the financing of a sovereign nation.

-After buying any debt in the up to 3 year space, the ECB will sterilize the purchase, meaning they will sell an equivalent amount of bonds/securities so no new money is put in to the financial system which is supposed to contain inflationary pressures from non-sterilized buying-essentially what QE was)

-The ECB will NOT buy any debt (no matter how out of control the yields become) unless the issuing country first requests the ECB buy.

-Any country requesting ECB assistance in buying their debt to hold down yields will have to submit to a memorandum of understanding and meet certain fiscal/financial conditions or otherwise known as an adjustment program

-The ECB will now accept any collateral pledged for credit lines with no minimum credit rating (all of the decent collateral has already been submitted in LTRO 1 and 2 so there is little decent collateral left).

Initial problems I see:

The 3 year space is essentially worthless, these countries need cheap credit for 10 years to give them time to right their fiscal house. Whenever default of a PIIGS country is discussed, it's always revolving around 10 year rates, I've never heard any distress over 1-3 year rates. Secondly, Spain which is the domino that the EU cannot afford to fail, has already made clear they WILL NOT accept any assistance tied to fiscal adjustment programs, therefore it becomes very difficult and much more unlikely that sovereigns will tap this ECB program as once they do, they have essentially given away the last shred of sovereignty and politically that is suicide as G-Pap in Greece found out and as Greek parties like Syriza and now even the Neo-Nazi party in Greece have learned as they are seeing a huge swell in support as they oppose the Troika striping them of their sovereignty with the most recent example coming last week in which the Troika demanded Greece make labor reforms including a 6 day work week and effectively disbanding the labor unions which are culturally embedded in Europe far greater than Michigan or Chicago ever dreamed.

The 3 year language is especially interesting as it sounds like the 3 year banking LTRO program, perhaps the ECB will sacrifice the LTRO and let banking problems run the course they have run in Spain, let them become sovereign problems and then deal with the sovereign. LTRO was a huge failure as it did nothing that the ECB envisioned.

The details regarding the fiscal adjustment countries MUST submit to are unclear, Germany will almost certainly require a standard so high that no one uses the program. Furthermore, if after the ECB buys the bonds the country does not stick to the fiscal adjustment program, the ECB will sell the bonds, a sort of punitive clause.

Argentina tried a similar tactic including sterilizing purchases, like many in Germany have warned, the ECB's program will cause inflation. In the case of Argentina, it caused hyper-inflation.

Today we saw sovereign debt yields rise for the first time since Draghi announced the program last eek (initial knee jerk reaction was lower yields), bond traders are smart cookies and know something doesn't smell right here. This could all be a moot point of Germany shoots this down as unconstitutional as the ECB is made up of each Euro-zone country's central bank and the only one with any real cash to put out there is the German Central bank, affectionally nicknamed, "BUBA". I'm not quite sure why Draghi has put himself on a collision course with Merkel other than the fact that the ECB is virtually a puppet of Goldman Sachs who was the one in fact to leak to Bloomberg the day before the ECB announced its decision, EXACTLY what the ECB program would look like, most likely because Goldman designed it. Remember where Draghi comes from... YES, he comes from Goldman Sachs.

Also don't forget why the Euro-zone exists, many think it was US-envy, in fact it exists for one reason only, so the manufacturing juggernaut that is Germany has a completely free trade zone in which to export their goods, this is why countries have to meet minimum standards before being accepted (they have to have a stable economy that makes their entrance in to the Euro worthwhile to German exports).

Once Germany sees no hope of the EU facilitating exports or it becomes clear that the costs outweigh the benefits, say goodbye to Germany and if the EU puts enough financial drain and contagion exposure on Germany, the politicians will leave the Euro zone long before they are kicked out of office.

Why do you think Germany is so willing to let Greece leave or kick them out of the EZ? They serve no purpose in German exports.


The Close

We didn't even get to talk about what I believe has turned the initial positive ECB knee jerk reaction to a negative in the market's eyes; this was already taking shape over the weekend and as has been the case for the last several years, everything the EU and now the ECB do to stem the bleeding, makes matters worse. In the context of EU policy action, it seems more like pure incompetence, a rush to do something, very little communication with key players, a hastily thrown together plan and no one considering the obvious holes in the plan that are clear as soon as they announce it. For example, when the G-20 demanded the EU do something and do it before the G-20 meeting (a week or two out), the EU came up with their grand plan to leverage up the EFSF (European Financial Stability Fund) to a trillion Euros over a weekend meeting, assuming the Chinese would be the financial white knight, perhaps they should have had more or some discussions with China as the first auction to raise a mere $3 bn Euros for the fund was a technical failure that couldn't raise $3 bn, how would they get to a trillion?

One of my favorites was the Spanish Banking crisis (still ongoing) with the weekend conference call in which the EU thought they'd hit the market over the head with a proverbial bazooka and come up with $100 bn Euros for Spain which at the time was thought to need about $60 bn, surely this 1-day plan would impress the market, except it didn't; as I remarked the very next day, the EU went from having a Spanish banking sector bailout to a probable full-scale Spanish sovereign bailout as the ESM (European Stability Mechanism-successor to the EFSF) would retain seniority over all other debt, which immediately made Spanish bond buyers and holders thing, "Greek Haircut" as their holdings went from senior debt to subordinated debt over 1 phone call. Bond traders started selling the Spanish 10-year sending it from 6+% to over 7.5% in weeks and putting the entire country at risk of default.

The ECB issue, which is just as full of holes (I can't decide whether through incompetence, by design or as an order from Goldman Sachs themselves) needs to be discussed and it will be as the initial Central Banking policy knee-jerk reaction is fading in Europe and has failed in the US today.

Here's what some key markets looked like at the close.

 This is one reason I say, "Don't get lost in the lines", we want the best entry possible, but often in retrospect it's not that big of a deal as AAPL took out 12 trading days of profits today alone.

 The NASDAQ Composite put in a Doji reversal as it broke above closing and intraday resistance.


 The Dow-30 with a Doji/Bearish Engulfing reversal formation.

 The NASDAQ 100 with  confirmed Harami reversal

 The SPX with a bearish engulfing reversal formation.

 The VIX surging today after having been at 5 year lows in complacency just less than a month ago. These are the charts you look back in retrospect and hardly notice the 3 weeks since the 5+ year low, I'm not saying you should, but when all is said and done, getting too lost in the lines can make you miss a great opportunity.

The Dominant Price/Volume Relationship for all the major averages today was Price Down / Volume Down, this is also the most common relationship during a bear market and while bearish for the internals of advancers/decliners, a close with higher volume would have made a short term reversal to the upside more likely, this is a less oversold situation


It still appears a bounce is coming, I'll have to look at the averages/3C and other things to see if it is likely to be overnight or through tomorrow, the 1 min AAPL divergence was run over.

 Both S&P and NASDAQ mini Futures have decent 1 min positive divergences, as mentioned, this could lead to an overnight bounce relieving any oversold conditions or it could (if it builds) lead to a bounce that runs in to the open tomorrow. I'll try to narrow that down.


Right now I have a skype call I have to make, as many of you know, my wife has been struggling with some health issues, we booked a ticket to send her to Hungary where she is a citizen (US resident) as she has free healthcare there and the ticket was less expensive (even last minute) than the deductibles, medication, etc. here in the US so she left Saturday night and had a long 10 hour layover in Berlin so this is the first time we will talk since I put her on a plane Saturday night.

I will be back as I have nothing but time right now :)


Currencies: Euro, $USD, AUD

I had a request for currency analysis and I was very proud to receive it, members are looking at what moves the markets and not moving averages and every other indicator that all retail traders are looking at (where's the edge in knowing what everyone else knows?)

Here they are...

 The EUR/USD pair since opening trade this week

 Since the 9:30 N.Y. open a series of lower highs/lower lows and an area of support that could influence a short term bounce on a legacy arbitrage basis, although these correlations have been much weaker than in years past. Since capturing this chart 10 minutes ago, the Euro has plunged through this support level to make a new lower low.

 EUR/USD daily, remember the most recent data I've seen anyway, shows Euro shorts at lows for the year so the idea of a powerful Euro short squeeze is pretty much moot, there was enough of a move to break resistance, but that seems to be a failed or failing move. Remember failed moves create very fast reversals.

 Euro 1 min intraday, you can see why it's not performing well.

 3 min chart-not only shows migration of the negative 1 min divergence, but also increased deterioration.

 The $USD seeing  1 min leading positive divergence, this should effect risk assets like stocks, oil, metals-although gold is more driven now by QE sentiment than arbitrage correlations.

 $USD 2 min leading/migration

 USD 3 min leading positive


 5 min leading positive

 And as the other side of the SPY 15 min leading negative, the $USD 15 min lading positive.

However the currency with excellent leading indications, the Australian Dollar, shows bad deterioration in underlying trade, this is not a good sign for the market.

 3C shows the recent bounce in the AUD as being under distribution

 The 2 min chart confirms both the set up cycle for the bounce and the distribution in to the price strength.

 That arrow should be red for distribution on the 3 min AUD chart, the leading negative divergence should also be highlighted with a red box.


 Here's what it should look like on a 5 min chart, also note the migration from the 1 min scale to the 5 min scale.

Most importantly is the 4 hour chart which doesn't have the detail of day to day moves, but shows the trend clearly, if we judge by the last negative divergence in February (thereabouts) we have a much more serious move now. As a popular half of a carry trade pair (AUD/JPY) this would not only confirm the carry trade is over, it would also confirm the very weak underlying institutional trade in the market averages, which many breadth indicators have already confirmed as well as our leading indicators, it also speaks volumes to the situation in China which we first identified weakness last year on commodity weakness, within the next 2 weeks we had Chines and HSBC PMI Manufacturing data confirming contraction in Chinese manufacturing. Recently Chinese manufacturing has seen 3 consecutive months of contraction with 4 consecutive misses to consensus. Today we get additional information in which import growth was expected, but instead we saw import contraction and 22 month lows in crude imports, all of which confirms the PMI data from last week with the 16 biggest manufacturers in the world (countries) all in contraction and 80% of the world in manufacturing contraction. Taking that thought 1 step further, US manufacturing PMI data from last week showed another month of contraction with the sub-indicies showing contraction in new orders, exports and what may be one of the biggest factors in F_O_M_C  policy this week, input costs rising, along with consumer inflation in food/gas.


Market Update

Other than AAPL with a relative positive intraday divergence (relative divergences are weaker than leading divergences), the only other place I can quickly find an intraday positive divergence in in the NASDAQ e-mini Futures. Any momentum in the other averages (if we get it), would simply be correlation draft.

 The NASDAQ futures have a 1 min relative positive and slight leading positive divergence, this is an intraday timeframe so I think it's only objective to show what else has happened today.

 This is the NASDAQ mini Futures on a 60 min chart, while there are worse looking charts, I think this shows the most 1-day damage done on a significant timeframe since futures opened for trade this week, note the nasty leading negative with all of that damage done today on a 60 min chart!

 The same can be said for the S&P 500 e-mini futures, there are worse looking charts, but on a 1-day basis, the leading negative of the 30 min chart is pretty extreme.

 The DIA 1 min shows little reason to expect a bounce so if it participates in an intraday move, it's simple market correlation which has been running very high, although the NASDAQ is changing that today.

 3 min leading negative DIA with today's damage alone.

 QQQ 1 min shows no positive divergence

 Here's the intraday view, nothing except confirmation of the move down.

 15 min QQQ damage

 SPY 1 min shows very little reason to believe in a bounce and lots of damage.

SPY 15 min with an extraordinary amount of damage done the last 2 days.