Monday, November 10, 2014

Daily Wrap


Early today I showed the VIX Whack-amole which is usually saved for the end of the day ramp,  which is interesting too, but this is what it looked like earlier today...

From Market Update

 Spot VIX has already been whacked lower , note SPX hasn't caught up to VIX's smash lower.

The same was true of short term ?vIX futures, interestingly this is usually saved for the end of the day ramp, not so early in the day.

As for EOD...
I have inverted SPX prices (green) so you can see the normal correlation and the VIX spike in to the close despite the SPX.

Among Leading Indicators, for the most part, the signals were negative today, but the really interesting part is the larger view of the signals from Leading Indicators, we forgot how volatile the market was just a month ago and how quickly it set in,. These leading indicators FAR surpass the leading positive indications for the October rally, a move I said would be a face ripping move that you'd feel scared to short in to and challenged you to bookmark the page and this was while everyone was still at nearly 100% bearishness, before the first day of gains.

The point being, even back then I expected a stronger move down once this move up was complete, Leading Indicators are SCREAMING for a very strong move down.
 As 30 year treasuries came down, 30 year yields were one of the support mechanisms lifting the SPX (green), however there are numerous indications of 30 treasury futures and TLT, being accumulated, which would send yields lower and stocks with them,.

This is the Macro trend of 30 year yields vs the SPX, the last major divergence was far left at the August cycle's head fake chimney move leading to the October decline, the divergence now is several times larger than the August cycle's, this is what I used in part to forecast the strength of the move to the upside as yields led the SPX.

 TLT (20+ YEAR BOND FUND) with positive intraday divergences and...

After a negative at the October SPX lows (left), a new leading positive at what I'd call the November SPX highs.

There's also the same evidence in 30 year Treasury futures.

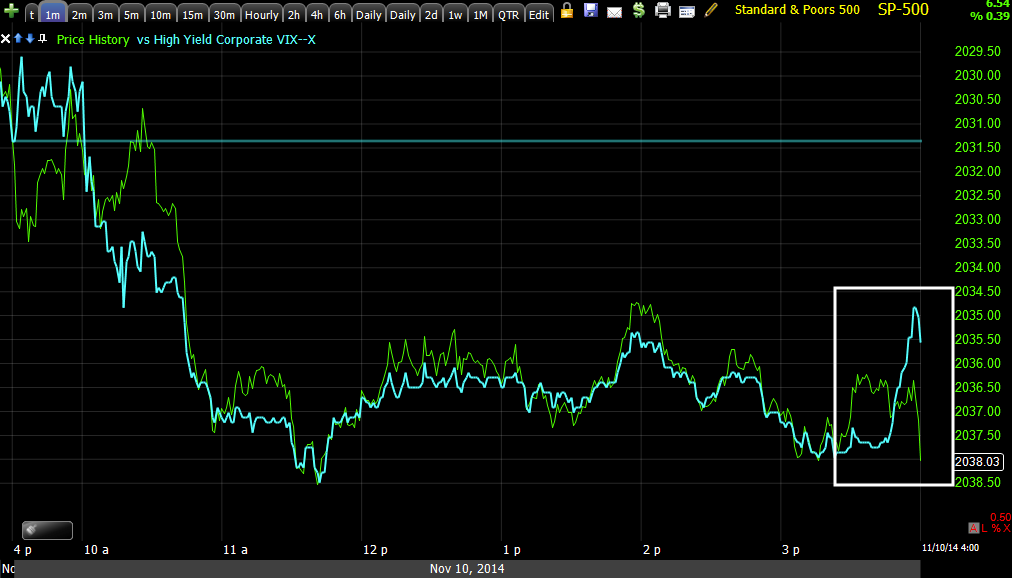
USD/JPY was a big part of market support today in addition to the SPY Arbitrage that ended the day looking like this.
At the end of the day the SPY Arbitrage lever was worth about $1 SPY. This market is not moving on its own or through demand, it's trickery manipulating VIX/VXX as you saw above, HYG and 30 year treasuries/TLT, although we saw it early today in VIX/VXX, you can see it clearly above on the Capital Context SPY Arbitrage chart.

In fact, liquidity was so low today...


From NANEX, lowest volume in E-moni's since 8/27.

The other big supported was USD/JPY, which is like a dead man walking.

 This is the overnight positive divegrence in the USD/JPY in to the loews at the European open, it headed higher from there all day.

However, this is what 3C looked like as it moved higher...
 You can see the European open to the left at the lows and the US session to the right with a deep leading negative divegrence.


The green arrow is the US cash open, purple is SPX futures and candlesticks are USD/JPY.

I can't see how this can hold on overnight.

Other Leading Indicators...
 HYG 1 min intraday, part of the SPY Arb, as long as it holds in line or moves up, the arb works with TLT and VXX moving down.

However looking beyond intraday, HYG doesn't look set to hold up much longer, this is the 2 min chart leading negative.


 Pro Sentiment continues to be risk off, more selling again today, it's the trend though that is outstanding, volatility is going to jump in a huge way.

This is the trend of the same indicator, the last time it dislocated was at the head fake August cycle top and the SPX made a new low, look at the dislocation now, it's insane and this is only 1 of the 2 we use for confirmation.

The second Pro Sentiment Leading Indicator
 Is not only making further lows intraday, but the trend....
 Again, the last time there was a dislocation was at the August cycle's rounding Igloo top with a head fake chimney, the dislocation right at the chimney sending the SPX to a new lower low. The current dislocation again is by far way bigger and even though this led the SPX at the lows, that divergence doesn't even show up vs what we have now. THESE ARE THE SIGNALS THAT ARE SCREAMING THAT SHOULDN'T BE IGNORED.

And HY Credit also making a lower low and dislocated as even the flight to safety Investment grade credit sees selling.

Intraday trade was kind of dull, famous last words, every time we have a dull market something big happens right after...
 intraday there was barely anything to show, I suspect algos were following HYG, VIX/VXX, USD/JPY 30-yerar rate correlations , thus the small "steering" divergences.

 The trend however is VERY clear and the larger timeframes/highest probability resolution are clear as well.

SPY 30 min negative at late July for the early Aug lows, positive the first week of August for the August cycle, negative at the Igloo with chimney August cycle top, positive at the new lower lows in to mid-October and an even worse leading negative divegrence now .

Near term $USDX strength which came from CAD and JPY weakness is what the market is all about, as the $USDX loses its footing, USD/JPY comes down, the Index futures have been tracking the pair pretty well today.

However for the bigger picture, strong accumulation in TLT or /ZB (30 year bond Futures) as well as the ongoing leading positive VIX futures signal will be where the action really is and the volatility gets extreme, also lifting option pricing.

$USD weakness should translate in to PM strength, perhaps oil too. I'm not ready to go long Gold right now, but I also can't pretend I didn't see these charts...
 60 min gold futures

intraday 1 min gold futures

GLD intraday 

This is clear evidence of someone consciously accumulating gold. Silver too...
While I'm not fond of silver (too much manipulation), there's a very clear change from a negative divegrence to in line confirming the downtrend to a leading positive divegrence in SLV and on a 15 min chart!

These are definitely 2 to watch, I'd like to see a clearer, bigger, more organized base.

Internals saw a mixed Dominant Price/Volume Relationship, the Dow had none, the NDX1-- saw 48 at Close Up/Volume Down, the most bearish of the 4 relationships. The R2K was just barely dominant at Close Up/Volume Down at 700, but not far behind was Close Up/Volume Up-both are actually short term overbought signals, typically seeing a close lower the next day.

The Russell 3000 was clearly dominant at Close Up/Volume Down with 1135 and the SPX was Dominant at Close UpVolume Down at 223.

All in all, this is the most bearish of the 4 possible relationships and considering...

volume and liquidity were so low today.


Of the 9 S&P sectors, 7 closed green, again flip-flopping with Healthcare which came in last place Thursday in first place today at 1.01% and Energy lagging at -0.90%.

174 of 238 Morningstar Industry and Sub-Industry groups closed green, these are not the most overbought internals I have seen, but they have been consistently overbought, which is the same thing that happened at the October base lows, consistently oversold several days in a row before the move up started.

Breadth hasn't moved that much, but that's actually what is significant about it. Breadth during the August rally corrected itself and repaired for 10-days and then went flat, soon after the market rolled over and it made a new lower low.

We are at a similar situation right now with the macro scenario looking a lot like the 2007 top as posted last week here, Now and Then

For example, this is the NASDAQ Composite's Advance/Decline line...
 The A/D line was moving with the Composite through 2013 and early 2014 and then broke lower with more stocks declining than advancing relative to the Composite';s value (red). Note the lower highs in the Advance/Decline line (green) relative to the higher highs in the NASDAQ Composite (red). That's major breadth trouble. in a world of stocks, that' more and more stocks declining in to a climbing market, most by the magic of weighting which is proprietary at NASDAQ unless you pay the $10,000 a year subscription.


And many of the other Breadth Indicators like this "Percentage of all NYSE Stocks Trading ABOVE Their 200-Day Moving Average" in green vs the SPX in red, clearly shows any improvement in breadth over the last 6 trading days has been NIL, ZiIP, ZERO, NOTHING! That's 6 days without any improvement in breadth.

Also of interest given other averages have given sell signals, like the SPY/SPX on my custom DeMark inspired buy/sell indicator and others below, make sure you see the last chart...
SPY with sell (orange/red) signals and Buy /Green signals with the last Buy right on at the low and larger sell signals.

 The DIA also calling the Igloo top and Chimney (head fake) for the August cycle as well as a buy right at the lows and a sell signal now.

The NASDAQ Composite, again the rounding top and head fake both had sell signals and the very lows were called as a buy signal

The IWM just put in a sell signal.

This is why this chart is so meaningful today, as you know the VIX moves opposite the market...
Here's the VIS's sell signal at the October market lows and a current buy signal at what I'll call the November highs.

And finally, while the SKEW is just in the danger/elevated zone (+>130), it's the recent ROC in its level that has caught my eye, I've caught these changes in character early many times in the past with SKRE and book mark this post, I'm wiling to bet we'll be in the 140's within a week, remember this is the "Black Swan" Index, events like 1987 or 1929.

SKEW >$130

A quick look at futures and it looks like USD/JPY will be coming down any moment on Yen strength. 

ES is leading negative too right now...
 ES/SPX Futures leading negative in to highs and bad right now

Also the Russell 2000 futures just went leading negative in to their highs/

TF/R2K futures/

I'm also looking for broader weakness in Index futures, ES/TF/NQ and short term strength in VIX Futures, The Euro, Oil and 10/30 year treasury futures (market weakness)...
 10 year intraday futures flying leading positive, this shouldn't be good for index futures, along with a fall in USD/JPY and a rise in VIX futures, it shouldn't be good at all.

Tis is just near term, remember though how fast the TLT 3C charts went from 1 and 60 min positives only to migrating out to the 5/10 min charts in a day. As a reminder, this is pointing to massive stock weakness.

The 30 year Treasury bond futures...

We'll see in the a.m. or perhaps before that...

Nikkei futures look like they are about to get very volatile, longer term signals are negative there as well, mid term 5 min charts have looked pretty good for a bounce, but intraday charts are falling apart quickly. If there's anything exciting I'll post it.


Quick Update

It looks like we're going to see some downside in to the close. The USD/JPY which has been holding the market all day is right at critical collapse, I don't know how it's even standing.

Also the SPY Arbitrage assets are moving or accumulating/distributing in such a way that the SPY Arbitrage will be an ineffective lever, TLT will likely see an upside move, HYG a downside move and while I don't much care for trading VIX / VXX, I suspect an upside move there as well.

This is ES right now as TICK is going south quickly.

Es / SPX 1 min E-Mini futures. When you see this overlaid on USD/JPY and the 3C chart for USD/JPY , it all starts to make sense.

Looking like this is a fracture line in intraday trade.

I'll have more charts out, I just needed to get this out quickly.

Alibaba (BABA)

I've had some inquiries about BABA (Alibaba) recently and this recent tear it has been on. I personally would not consider this stock a short whatsoever, however it may be building up to a pullback that is worth a swing trade short (or options),  it's on that pullback that we'll know what kind of shape BABA is really in.

You may not recall, but this was one of the stranger IPOs of recent memory, for quite a few reasons, but one being shares held by insiders and the underwriters of the IPO that are not locked up as part of the boilerplate 6 month lock up for these types of shares on a new issue, which smelled fishy.

Right now I can't say there's anything other than strength in the underlying trend, as short as it is (historically)...however there are signs of a change coming which is likely a pullback. This pullback may make for a nice long entry or it may tell us something is starting to sour with BABA and to look for tactical positioning. Movement is the key, it tells us a lot.


 BABA daily chart shows price peeling away from the trendline in a "seemingly" bullish way, however this change of character more often than not, leads to a bearish change in trend.

In this case the move is called a Channel Buster and they often reverse to the lower end or break through the lower end of the channel just as fast as they breakout of the upper resistance trendline of the channel. As such...

Here's the same trendline drawn as a clean channel and the Doji star pause right at resistance followed by a breakout above the Channel. There's no doubt this looks very strong, very bullish, but history has shown us again and again, these types of moves are a red sign flashing that a change in trend is coming.

 On a weekly chart, just to boil the trend down to the basics, this is as strong as anything out there, a decline in volume on the price decline, a rise in volume with the price rise and an exceptional candlestick with strong volume. Volume should ALWAYS expand on a move higher, one of the big things this market has been missing for years.


 I can show you on a daily Bollinger Ban although it's a lot less data or on a 60 min like above, BABA walking the upper band is very bullish, there haven't been any breaks of the middle moving average.

 The 60 min X-Over screen shows the long signal which remains in effect currently. Honestly, this screen looks great.


The 2 hour 3C chart with accumulation at the lows and confirmation since.

The same on the 30/60 min charts

The 10 min chart is the same, but also the first place we see a significant change in character with a negative divegrence in the area of the Channel Buster. I'd suspect if insiders were selling non-locked shares, they'd be doing it here.

 The 3 min chart shows the same trouble in the same area,  so I'd expect a pullback. HOW BABA ACTS ON THE PULLBACK TELLS US A LOT, whether this is a potential long opportunity of whether the show is over already.

You can keep an eye on the 30 bar 60 min moving averages, I suspect it will be broken on a pullback, you might want to set some price alerts there.

And the 60 min Trend Channel had to be widened out as a daily channel doesn't have enough history. If you are using the TC, just widen the width (standard deviation) setting from 10 to 20-2 SDs.

This channel held all of BABA's move including the consolidation. Again, look for a pullback around the 60 min 30 bar moving average, we'll see what underlying trade looks like there.