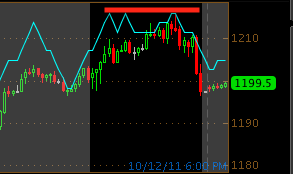
As you know, 3C and futures is a new feature just added so there's going to be a bit of a learning curve as you know 3C is complicated as it contradicts price and shows the underlying accumulation and distribution, but what better market then ES to see what the big guys are doing that is moving the market. So here's a look.
First off, US futures are more or less flat, between +.03% to +.16% , futures in Asia are higher and futures for Europe right now are flying for the most part (the range is .05%- +4.39 with an average around 1.5 to 2%), the fact the US is lagging so bad is interesting.
different timeframes represent different trends, there can be an intraday downtrend within a stronger daily trend within a weekly and monthly trend, each can be different, I'm looking at the near term. Remember Black chart backgrounds are market hours, grey are non US market hours, traded 24 hours a day during the trading week.
This is a series of 1 min charts from Tuesday night, I can't fit the entire thing on 1 chart so there are 2 starting from the close on Tuesday of the regular market right up t the open of Wednesday a.m. I didn't include Wednesday regular trading hours because there was nothing to see, just in line trade.
So here's the close of the market Tuesday to the lest and ES trading from 4 pm on. There are several accumulation zones in white.
Here's the next chart, which would be a continuation and the black is Wednesday's open. More accumulation and as you an see, ES moved higher off those accumulation zones, lifting the regular hours trade today.
This is tonight so far on a 1 min, first distribution into a rising ES market, remember very small moves here are worth a lot of money, there was some accumulation in to the lows and a brief pop in the green box, a new low and more distribution as prices rise off the low. I'm not staying awake all night to see how this plays out, but I'll show you tomorrow.
This 5 min chart shows ES pre-Tuesday regular hours, then Tuesday in black, then Tuesday night Wed. morning in grey and Wednesday regular hours in black and a bit of Wednesday night in grey at the far right. Tuesday we see ES distribution through the day, this was noted in 3C during market hours, ES prices fell at the close Tuesday and beyond at the 1st orange arrow. Then accumulation of the lows at the white arrow, the green arrow shows ES futures moving higher in price. Then Today/Wed. in black where ES is under distribution again and a significant fall at the orange arrow at the end of the trading day today-this is a huge move for an ES contract. Remember, they trade 50x the value of the S&P-500 and well over a billion contracts a day. So the distribution in ES during regular market hours was heavy. So far in the post market trade at the far right (grey) we have a pretty flat futures market, note 3C moving down and making new lows for this chart. Also remember what I said about US futures vs. European, a huge difference.
GOOG reports tomorrow a.m., that will drive initial morning trade I'm sure, after that, we'll have to see what happens, but you know my opinion, summed up as a "Head fake"-we saw two today, there's a bigger one just a few points below us. Should be interesting. The model portfolio is holding all inverse ETFs -positioned short.
Hang in there with me on this ES stuff, I'll try to make the harts easier to understand, you can always click on them for an expanded view.
Is interest rates about to start going up?
-
Yes, I know - it does not make any sense - FED is about to cut
rates...but....real world interest rates are not always what FED wants it
to be.
6 years ago


