Friday, September 19, 2014

Daily Wrap

It seems the F_E_D's Red Haring didn't work. For weeks the market has been worried about the F_E_D taking out the "Considerable time", defined by Yellen once as 6 months, the time between the end of QE and the start of interest rate hikes. The market has been discounting the removal of the lkanguage expected because dovish and hawkish F_E_D speakers alike have all said it's time to do away with it, yet it remainned making the F_O_M_C statement seem that much more dovish, however in the press conference, Yellen absolutely stripped the phrase of any meanaing at all and actually tried to define it as "incoming data" which is a pretty neat trick if you can pull it off. However it is clear that this language was left in to distract from the fact that the "Dots" or median forecast for interest rates at the end of 215 and 2016 keep rising, which not only means higher rates, but likely a sooner start to get to such rates by the end of 2015. Thus the red herring was left in, but did it work? Not looking at small caps and transports or the IWM...

After going through some more indications that I have to update after the close, I feel pretty comfortable with today's, The Week Ahead which I'd encourage you to check out, even if you've already read it, just from a charting perspective, there are a lot of charts that fit together amazingly well. I'm not looking to make a match when gathering objective data, I'm just looking for a pattern. The market will give you pretty much any data you want if you look at it just right, to draw any conclusions you want, that's why I ALWAYS refer to data as "Objective", I don't care whether we make money long (like MCP today) or short, just that we are on the side of the highest probabilities and in this case, I think a historic trend to emerge and with that, historic opportunities that will make the Bernanke put look like child's play just as the 2008 bear market made the previous 5 year bull look dull.

Call it coincidence, call it whatever you like, but we've had an incredible run with the Dominant Price/Volume Relationships. Last night's Daily Wrap contained the following (keeping in mind, after the Dow and SPX closed at all time new highs which usually see next day upside follow through)...

"There was a Dominant Price/Volume Relationship, 20 of the Dow 30, 63 of the NASDAQ 100, a smaller ratio of 643 of the Russell 2000 but still dominant and 234 of the Russell 2000. Of the 4 possible combinations, today's Dominant P/V Relationship across the board was Price Up/Volume Down which is the most bearish of the 4 relationships and often sees a next day move lower or over the next couple of days."

Considering the new highs and usual follow through, with the Alibaba IPO today, one of the most historically over-hyped IPO's ever (in which it surpassed Walmart's market cap in intraday trade), was it coincidence the averages ended almost all in the red?

 The SPX and NDX closed marginally lower, the Dow closed up by +0.08% and the Russell 2000 lost -1.09% today.

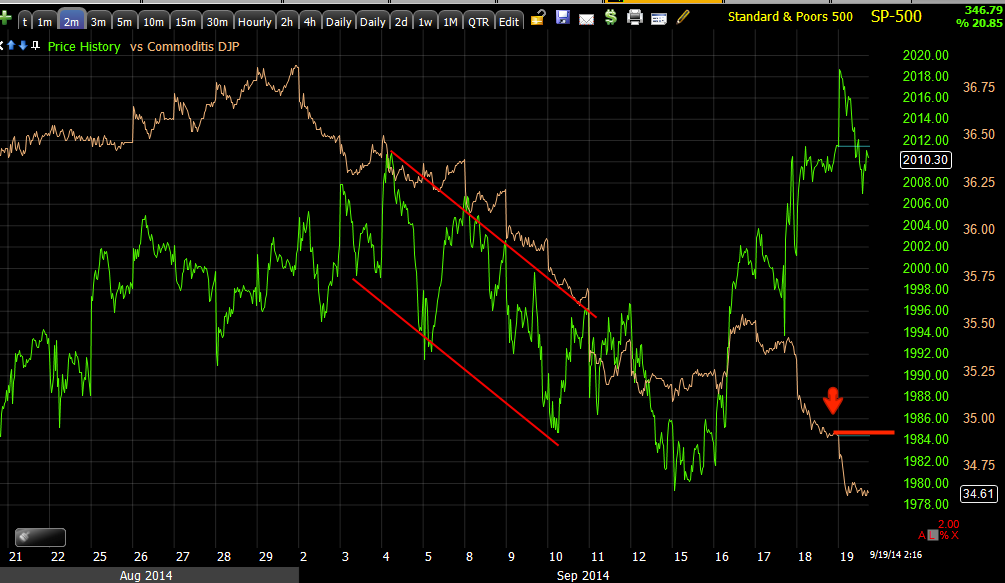
It almost looks like on a longer term August cycle basis, the Russell is moving to catch down to HYG's stage 4 decline and the SPX really doesn't look that far from doing the same.

Since Aug 1, the R2K in white is catching down to HY Credit, the SPX put in the Igloo-with Chimney topping head fake pattern.

Especially hit hard were small caps and Transports which erased ALL FOMC gains.

 Small caps...

Transports...

And how about the Russell 2000?
The Russell 2000 reversed all F_O_M_C gains today alone, in fact, nearly erased all gains on the week and is now down -1% Year to date and near 6 week lows, I'd say we can probably call that stage  4 of the August cycle.

However the Knee-Jerk response is not just stocks,
 5, 10 and 30 year yields lost all gains from the F_O_M_C as well, recall our recent posts that TLT was about ready to end its pullback and move higher, well it did so today with a +1.27% move and that's with giving quite a bit back this afternoon as we forecasted earlier today for a short term correction allowing a long entry.

Yields on the day didn't look very good either with a wide range that closed lower in the 5, 10 and 30 year.

And there's the F_O_M_C / F_E_D knee jerk reaction in live action, as almost always, the initial knee jerk move (although muted), is almost always wrong whether it's up or down.

Perhaps, this in "part" may explain the destruction of the Most Shorted Stocks / Index(MSI). Normally we'd be looking for support from these as they are easy to squeeze, but since July 1, the squeezes have gone from weeks to hours to minutes and today, absolute destruction as the Index headed lower meaning these heavily shorted stocks were in significant decline today.

The MSI (yellow) vs the SPX. I'd say this chart alone is the market speaking pretty loudly about its condition and things to come. This is why I suggest looking at the Week Ahead post as there are more charts that are important.

Interestingly, although there wasn't a lot of movement in the average beyond the Russell 2000, they did manage to put in some ugly bearish reversal candlestick patterns.

 All of the averages have negative divergences (well in a lot of indicators) in the RSI like U.O.

The SPX put in a bearish long wicked Star candle on the close in to the divergence.

The NDX is shown with the same indicator on a 60 min chart with a positive divegrence just like my SPX/R2K Ratio in the "Week Ahead" post, at the base of the August cycle to the left and a negative divergence now. The daily closing candle for the NDX was a bearish Hanging Man.

The RUT also shows a similar divergence at its top and a very  bearish Engulfing Candle that swallowed the last two days entirely.

The Dow 30 has the same divergence with a bearish "Shooting Star", the Japanese call this candle, "Trouble ahead".

Transports put in a confirmed Star/Bearish Engulfing candle today.

The $USD is doing amazingly well. Remember what the $USD did during QE or Dollar destruction via printing? Well it's signing a different song, a telling one at that as well.
For all those who believe the F_E_D has got their back? What's the opposite of QE's Dollar destruction? How about the $USD closing up for a 10th consecutive week at multi-YEAR highs? What's that telling us about the F_E_D balance sheet moving forward?

Have you ever seen the correlation between the expanding F_E_D balance sheet and the SPX? Remember, the F_E_D is no longer going to hold assets until maturity, they'll be reducing the size of the balance sheet, although they are keeping this aspect very grey and fuzzy right now.

As you might expect, dollar denominated assets have been pounded during this $USD strength, again see the "Week Ahead " post, but...
On the week, USO is the only asset here closing green, gold is down, although you know we are watching gold, GDX/NUGT for a possible reversal, however, look  at silver in white! Silver has long been manipulated and this week as it puts in a 4 year low, I suspect it is still being massively manipulated, not my favorite asset to trade by far.

Today we had an especially Dominant Price/Volume Relationship, 17 of the Dow 30, 82 of the NASDAQ 100, 1323 of the Russell 2000 and 257 of the S&P-500, all were Close Down/Volume Up.

Usually I'd say this is a strong 1-day oversold event, however today was quad witching and the much higher volume is to be expected, so whether we get a 1-day oversold bounce Monday is up in the air, I tend to dismiss this one just because of Quad-Witching today.

As for the S&P sectors, 8 of 9 closed red, only Utilities closed at flat 0%, the worst performing sector was Financials, the short we were looking at on a slight correction. This does look more like an oversold event and is in line with the near term forecast of the Week Ahead, as in Monday.

Of the 239 Morningstar groups, a very paltry 47 of 239 closed green, again, both indicative of a 1-day oversold event, but also indicative of massive destruction in market breadth, far beyond what most of the averages showed in price action (except the R2K).

Breadth was all in all HORRIBLE. Stocks 1 and 2 standard deviations BELOW their 200-day moving average are just as high now at a near new SPX high as they were during a deep pullback that ended early August, major trouble.

The A/D lines for the NYSE, Russell 3000, Russell 2000, Russell 1000, NASDAQ 100 and the NASDAQ Composite all closed disproportionately lower today except maybe the R2K which was in line with the massive decline there.

Let me explain it this way, the extraordinarily deep breadth decay of the last decline in late July is now seeing as bad breadth readings, except the market averages aren't in decline, the SPX and Dow just made new all time highs, the point being, it was  bad when the market was seeing a 4-8% decline with breadth that destroyed, but now it's nearly as bad during a rally, in other words, that pier's pilings I've been talking about went from bad earlier in the year to really bad in early August to unbelievably bad currently. I'll look back at 2007 and 2000 again, but I don't think there's anything that compares with this.

Finally, as I said in the week ahead forecast, I think early Monday we'll see some weakness, perhaps in to a bounce later in the day and maybe in to Tuesday, I expect HYG to decline from there as it has already started falling apart. If the 3C charts don't put together an intraday positive after Monday morning, the market will be in nig trouble fast, however based on breadth like the S&P and Morningstar sectors, I'd expect at least 1 day of correction to allow them to try to work off some of that oversold tension, but oversold can quickly turn in to bear material, that's how this market will end.

Have a great weekend.


MCP Follow Up

I hope someone got filled on the Trade IDea: (short term options) MCP,  I didn't, but if I had, I'd be looking at a +25-+62% gain for 40 minutes of market exposure. (* I just got word that at least one member got in the position and is at a gain)

Wednesday, MCP Bullish Signal was posted with an interesting day yesterday, but a day that again is a micro version of a macro concept, that's the beauty of these concepts, they are fractal in nature, able to be used in any kind of trading on any timeframe in just about any asset for the simple reason that human emotion , including how technical traders react to certain events, is the same no matter what duration or asset they trade.

MCP spent 6 days inside the range of the 9/9, which was forming an obvious support level which makes it more likely a stop run will be forced before an upside move, or a head fake which occurred yesterday and was not a fund day being long there, but the one thing I was looking for rather than panic and just sell it, was increasing volume, larger than the previous day, with some signs of positive divergences which were showing up. A Hammer close would have been nice as well, especially on that volume.

I say this is a micro version of a macro concept based on volume. Think about the Dominant Price/Volume themes I track every night. Close Up and Volume up, the most bullish of the 4 possible combinations, but almost always leads to a 1-day overbought event which closes lower the next day. It's not the move up, it's that with the high volume. Conversely, Close Down/Volume Up, is almost always a sign of a capitulation event and a 1-day oversold event with the market or asset closing higher the next day so yesterday's rising volume, often indicative of stop runs, was a welcome site with price looking the way it was.

 This is the intraday MCP move with a strong close on volume
.
 The daily chart looks like this with a +12% gain on the day. You can see yesterday's large volume which is the only reason I didn't close MCP yesterday. Today's candlestick taken with yesterday's also forms a bullish Harami reversal pair, called "Mother with baby" in Japanese or an inside day here in the west, it's a bullish upside reversal candle.

 There was a clear support area yesterday that was tagged with huge volume on the stop run, note that it was accumulated. This was interesting, but not yet enough for an options trade.

Today's leading divergences on charts like this 3 min and the 5 min below...

are ultimately what made me decide to take on MCP calls even though it was up nearly 5 % on the day, it closed over +12% on the day with bullish candlesticks, a head fake move and strong 3C divergences.

Good luck to those who took it on, I suspect you'll be very happy very soon.

The Week Ahead

I wanted to make sure I had ample time to look over everything for this post as this sets the tone for the following week and how we want to use that tone.

Last week's Friday afternoon, The Week Ahead was pretty clear within the context of the way things were left off at the close Friday, the SPX was in a downtrend, for most technical traders, this means follow the trend, the trend is your friend.

Here's what it looked like.
 Last Friday the 12th, in white, the SPX was in a clear trend of lower lows and lower highs so last week's forecast for this week, while not perfect, was significant.

I can only give you the probabilities based on objective data and you have to decide how you want to trade those or use them.

Here's the forecast from last Friday...

"HY Bond flows were actually positive going in to the early August base, a sign that we were probably looking at the bounce expected from the Daily Wrap of July 31st. However this week we have 765 million in HY outflows on top of last week's 198 million, in other words HY credit, just like before the August rally, is giving a tell signal again. HYG's bigger picture chart is giving the same tell signal and in the SPX we have lower highs and lower lows, but the market rarely makes it that easy.

HYG's positive divegrence this week is still there and it's not for nothing , it's not a coincidence.

While I can't pinpoint the exact moment, my guess is HYG is used to boost the market, maybe even our head fake move because the market itself just doesn't have the positive short term divergences to do it alone. However after that, I'll say HYG will be headed straight back down and I'm guessing this happens before the policy announcement on Wednesday. Judging by the scramble toward our set-up targets in several of our short set up plays today, despite a red market, it looks like they are in a hurry to get that move in place and I suspect HYG is going to help early in the week and then retreat before the market."

While most of the forecast was right on, especially coming from an established downtrend, I think the HYG divergence wasn't for the F_E_D or anything else, I think, as posted yesterday it was support for Alibaba as there is a lot of money to make in those non-locked IPO shares, nearly 1/3rd of the shares weren't locked up, which makes supporting the market to sell those shares at $90 something rather than the initial planned $6-$68, is a big difference, I figure off the top of my head, worth another $4 billion dollars.

While the timing around the F_O_M_C was not correct, just about everything else was as you saw the market all of this week, except for today, have a higher correlation to HYG more thoroughly than any other asset.

The head fake move that we have been anticipating for weeks now as the market has been in stage 3 was fulfilled as forecasted above last week. I've drawn the Igloo/Chimney so many times before it actually happened, it's pretty hard to argue against the concept that we have been expecting going on 3 weeks.

And here's te head fake move or Igloo with a Chimney that was forecasted last week for this week. All along, HYG acting as support.

I think other aspects of that forecast are still correct although haven't happened yet, such as HYG leading the market down as it has led the market every day since August 1st, so the deterioration there is important.

You may recall I've brought up the subject of deciding how much weight to place on top-ticking position entries vs just getting in. As the big picture goes, a couple percent here or there will not make a lick of difference 6 months from now. While I think that was an important decision for each trader to make, I now think the market is giving us such a strong message, it shouldn't be ignored and in my view, it leans heavily toward, GWT YOUR POSITIONS IN PLACE,  leave some wider stops/take on fewer shares, but get them in place. 

I'm looking forward to seeing what the HY bond fund outflow / inflow was for the week, but it's obvious from last week, they are already preparing for something big and since them this week, nearly everything has confirmed that. I have focussed on breadth a lot,  but the 16 point gain in SKEW in 2 days right after the F_O_M_C is sending a strong message. I no longer think this is a debate, but a necessity and the only debate is how to do it (whether phasing in, adjusting for wider stops by taking on fewer shares initially, etc.).

So I wanted to make sure to look at as much as I could before putting this post out, my conclusion is there's no support for this move as we never expected there to be and it's in a fragile position. If you think the IWM taking out all of yesterday's gains, all F_O_M_C gains and almost posting a new low on the week today is something impressive, wait until you see a break in the market in which weeks and sometimes months of longs are taken out on an opening gap. I think it's not a rush today to chase lower prices, I don't ever want to do that, but I think there's very little time and some assets we have already positioned in are already breaking down, Transports for instance (IYT) have put in a bearish reversal candlestick formation, and our entry is just below this area, SCTY is breaking down, HLF of course continues to work at a +30% gain since our June entry, our recent FXI short (FXP long) is looking like excellent timing on the entry, NFLX's entry has us in the green. As I said the last few weeks, different set-ups will be ready at different times, but a move down in the market is going to take most stocks with it.

Here are the charts I've been putting together the last hour, I may revise some of this after seeing the closing breadth figures, but I think the general concept is sound.

 This is a new custom indicator I'm using, VIX inversion on the bottom and SPX/RUT ratio for confirmation in the middle vs the SPX. As you see, there's a clear longer term dislocation and non-confirmation and a very near term one as well, multiple timeframes are aligning.

 On a closer look in the "Chimney Area", we also have non-confirmation of the move, in fact with a new low in the indicator.

 The HYG/SPX move predicted last week has been right on and not just a day or two like the carry trades, this wasn't accidental or coincidence, this was clearly set up.


Today something changed in the correlation as seen above, but I still expect HYG to break down first and lead the market.

High Yield Credit called out the July Decline as well as the early August base as did the credit inflow and outflows, we have massive outflows the last 2 weeks and there's a VERY clear dislocation on this week's move in which High Yield Credit , other than the lever HYG, wanted nothing to do with.


 HYG's 3C charts are breaking down as well, even though they were much larger and should have provided a much bigger move than they did.

The yellow arrow is a micro version of the macro concept of a head fake move right before a stage change or reversal, they are one of the best price based timing indications and that's exactly what the "Chimney" move in the market/SPX is on a macro basis.


HYG continuing to see 3C distribution

And an especially sharp move today now that BABA is out and trading.

 As for our Professional Sentiment Indicators, again, they called the July decline as well as the August base and are calling a very clear negative dislocation now.

Here's the second one we use...
 The same thing, it is leading the market, but especially not wanting to have anything to do with this week's move which turns out to be the head fake move we've been expecting for almost 3 weeks now.

Yields as a leading indicator worked perfectly, price was drawn to them like a magnet, so looking forward, I suspect some declining yields.

 The daily TLT chart with out initial post calling for a TLT pullback on 8/26 , the pullback and recent posts calling for an upside reversal which we got today. This should send leading yields lower and the market is attracted to them like a magnet as we saw this week again.

TLT's 30 min chart looks like the pullback is over and it's moving toward higher prices.

Here's another more timely chart of the pullback and reversal of the pullback, but...

On a very short term intraday basis, TLT looks to pullback offering a nice entry for any longs, but also suggesting some early market strength Monday, although I'll have to verify that later, I suspect it stays in the chimney area with a few exceptions.

Commodities are getting hammered telling us something about global growth. I do however think GLD and GDX will see upside, they need a little more time to put together their base.

 The Most Shorted Index is the market speaking to us, not only no squeeze, not in line, but these shorts are moving lower.

The TICK with declining breadth as well.


 I suspect the IWM might try to break the downtrend early in the week and head lower.

This should make for a nice SRTY long entry.

 intraday IWM with some repair


 I suspect the Q's will try to break this flat resistance trendline before heading down, allowing a nice entry in SQQQ long.

 And some early evidence of that...

 The SPY I don't anticipate anything other than widening out this area so we don't have a sharp "V" reversal down.

I'll make any changes to the forecast in the daily wrap, but they'll only be short term intraday ones, the macro or larger expected trend for a move lower next week as the head fake is wrapping up is the main forecast.


MCP Correction-October 18th $1.50 Calls

Going with the little longer timeframe.

Trade IDea: (short term options) MCP

I'm going ahead and entering an MCP October 3rd $1.50 call position. I'll have charts out in a bit, but I expect the move to be a quick one. The MCP long equity position will stay in place.

Trade Set-up (Swing or Longer Term ) FAZ

I'll have some charts out in a few minutes, but FAZ long (3x short financials) looks pretty darn good in the area for either a new position or filling out a partial position. If intraday signals hold, you can probably pick it up for $12.50 or less, but ultimately anywhere below $16 is a choice entry so you might want to set some price alerts.


BABA is on its own, HYG breaking and fast

 HYG 2 min

And intraday, the break is happening fast, it appears smart money is no longer supporting the market for BABA

Futures Update

Hopefully we'll get a little bounce in the area today, whether we do or not, if you are looking at positions as longer term trend/position trades, I really don't think a bounce intraday makes that much difference (going back to weighing the attempt to top-tick the market vs just getting in at a good area and sitting tight).

The TICK Index is flattening out, although at the bottom of today's downtrend after poking below -1000 multiple times.

SPY is putting in an intraday positive divegrence on the 1 and 2 min charts, the 3 min is destroyed on the day which is in line with price movement which has taken back virtually all of yesterday's gains, the 5 min chart is leading negative to the levels of earlier in the week when the positive divgerence on Monday and early Tuesday was put together, which was our "Week Ahead" forecast for this week from last Friday, with decay in to or just after the F_O_M_C.

There are a lot of things not visible on the headlines like "S&P makes all time new high", such as a 16 point advance in the Black Swan Index since Wednesday/Thursday putting it near all time highs since the indicator has been publicly published by the CBOE, meaning there are some very scared deep pockets out there willing to buy deep out of the money puts, and there's only a couple of reasons you do that and "The market is going higher", isn't one of them. Breadth is another one you won't see on the headlines, in fact often you'll be told to ignore it, these are the things that are clearly apparent after its too late.

In any case, the Q's which have remained fairly strong in underlying trade for the week off Monday/Tuesday's positive divgerence are now coming apart a lot faster, a lot of damage on the 3 min chart and migrating to the 5 min. Intraday its 1 min chart , like the SPY is trying to get a positive divgerence going, these are not significant timeframes, in fact we pretty much use them only for intraday signals and price moves, next to a 5 min chart, although the difference doesn't sound large, it's an enormous difference.

IWM which is one of my best performing shorts (other than HLF at present), short via SRTY, is pretty much in line on the downside, no attempt there to put in an intraday positive divgerence.

Finally the Dow is also trying to put in an intraday positive divegrence.

One of the uglier indications today is not only the lack of a short squeeze, but the actual decline of the Most Shorted Index, now looking like this.
I would call those shorts moving lower an important near term trade signal, while I'd call the 16 pint, 2-day gain in SKEW, big trouble on virtually any timeframe.

As for HYG, it's still providing as much support as it can (price only) intraday, I'm pretty well convinced that this was prep work to get the market out of an ugly place as SPX had a solid trend of lower lows and lower highs last week and in to a more pleasant environment for one of the biggest, over-hyped IPOs ever as BABA traded high enough today to eclipse both Chevron and Walmart's market cap.

I'm pretty well situated on my market analysis and what needs to be done now so I'm going to get to that which is individual asset positions, but I wanted to give you a broader overall look so you have a context to place these in as price movement is deceiving. I'm going to start with the macro picture in Index futures and work to the shorter term which encompasses the mini cycle of this week in which the stage 1 base was Monday's divegrence and the first couple of hours of Tuesday, obviously meant to work hand in hand with HYG's support as they have run together tick for tick all week until today. Hopefully this will make you more comfortable with where the market is at looking at it from a different perspective.

 ES/SPX Futures 4 hour chart which is the macro view. The first red divegrence (arrow) was the decline that cost the SPX 4%, 2% down on July 31st alone. The IWM on the other hand was down 8% on the same divegrence. The dip to lows right after that is where the 1 week base/accumulation for the August cycle was put in. This was in my view (you can read the July 31st Daily Wrap and see my opinion of what was coming and why, a full week and a day before it came), bases entirely on a wickedly oversold market that shouldn't have been that oversold (all market breadth) on such a small S&P decline, the August cycle in my view had very little to do with moving price and had a lot to do with repairing breadth. Unlike the 2007 new high in the SPX which marked the top of the bull market to the day, breadth this time around has deteriorated since about the same time 3C has deteriorated in the red box, showing that there was no fundamental market strength, none of the gains in the averages were based on more stocks in the average moving up together, in fact more stocks were moving down during the process. Could this be Alibaba related? I can't say to what length these 5 banks would go to ensure they rake in a fat payday of historic proportions, but perhaps, they definitely don't want an IPO launch in to the preceding downtrend that was in effect,  but everything about the August cycle says, "Ginger Bread House" as internals either didn't hold repairs and failed to make adequate repairs and the fact they actually declined.

 NQ/NASDAQ 100 Index futures look similar, the key is to the far right as the August cycle has led to a new leading negative low, this isn't some errant 3C signal, breadth charts support everything you see above. If you compare price at the white box and where 3C was at the time and compare price now and where 3C is, not only is breadth rotten, but 3C money flows are as well, of course the two go hand in hand, stocks don't decline without money flowing out of them. We are in a very weak position.


 TF/Russell 2000 futures on a 4 hour chart show the right shoulder as I have the IWM drawn in a slanting H&S and the decline from there, it's not far from the neckline at all.

My SRTY position is acting very well, especially on days like this, but more importantly the trend which you'll see below.

To 60 min charts, which are not as strong as the 4 hour, but important in determining where a turn occurs, multiple timeframe analysis combined with multiple asset confirmation.

 This is the Es/SPX futures break and negative divegrence of the Aug. cycle's stage 3 top which stated a downtrend of lower highs/lower lows, the positive divgerence is the anticipated move this week from last Friday's week ahead post. The turn in 3C right now out to 60 mins. shows there's a problem right in the area as we fulfill the upside Chimney/head fake move/target.

 The NASDAQ broke the downtrend like the SPX which were last Friday's predictions, however you can see the first divegrence to the left and a really nasty leading negative position right now, again confirming this is less about price than either breadth or BABA as there virtually no repair in breadth with somewhere around 47% of the NASDAQ Composite's stocks in a technical bear market, HALF.

 And the reason SRTY has been so good to me as the Russell 2000 trend is pretty clear, even with the bounce it fails at the trend line.

As far as short term timing of this week's move, HYG is still key and the 5 min charts, but the Index futures on the week show a lot of deterioration today alone, so it seems next week's trend is likely going to be very different from this weeks and on a longer term basis, considering the 4 hour charts, this is the start or primer in fulfilling the ugly signals there. By the way, this is ES.


NQ/NASDAQ 100 futures are loking similar, sudden sharp ugliness today.

And the Russell 2000 futures showing the same. This should just get worse until prices turn, which means I need to get busy as many assets we are looking at shorting in to higher prices that have long term chart weakness, are going to turn around the same time.