Tuesday, September 7, 2010

I'm OUT!

For a couple of hours, I have a meeting; I will be back to post tonight's wrap. Today was a good start, but as I said over the weekend, even after we get the reversal, which looks like we got today looking at the candlesticks alone, never mind everything else, they are still going to shake the tree as hard as they can.

I know exactly what I want to show you so I'll have the post up within 30-45 minutes of getting home later.

We are in a good place, but not an easy place. Everything has panned out as expected/hoped, but we're not in the clear, just headed in the right direction. So I didn't forget about you, I will be back, there will be a post and you will be prepared for whatever comes this week.

In the meantime, review today's trading action and the updates. There's a lot you can learn about manipulation in the market from today's trading action. Heck, the timing of the Euro Stress tests in and of itself is a lesson. After the divergences seen on Friday suggesting they were wrapping up the bounce, could you really (after all you have seen) believe that the timing of the press release was just happenstance? If you do, then I've not done my job and you are not yet sufficiently paranoid. I know the connotation the word carries, but you can't be paranoid enough in this market because we are just seeing the effects of their manipulation.

I have seen some things that I'm sworn to secrecy over because someone's job depends on it, but suffice it to say I've seen things that I didn't exactly understand at the time and now I'm understanding what they meant. This is why I say you can't be too paranoid because after what we have seen the last few months, your imagination can come up with some pretty good ideas of what really goes on behind the closed doors of smart money's trading rooms. Now take that and multiply it by 10 or even 100 and that's probably closer to the reality.

We've been brainwashed our entire lives so anyone saying something different then what we have come to know the market as, is kind of a kook in our view. This is the reason that most people lose money in the market and Goldman Sachs can give an average $600,000 bonus per employee and remember, like any big organization, that includes mail room clerks, data entry, secretaries, janitors, etc-not just traders and board members.

So I'll be back-but please study the action today and gain an insight into how it really works. These are your own eyes looking at real objective data, not a kook's paranoia so you WILL if you take the time to look and have an open mind, make your own discoveries that prepare you for the realities of Wall Street. Then and only then will you be in a position to take these guys on toe to toe and walk away with a pocket full of cash.

I've heard some great successes from a lot of emails today, people heard about the divergences on Friday, bought and made nearly 7% today alone!

GREAT JOB

See you soon!!

LAST UPDATE for the Trading Day

We have confirmation of the hanging man I mentioned this weekend in the MEGA-post, I hope you were able to stay awake through it. So at least in the near term we have a trend reversal. That's all Candlesticks in this case are god for. The ugliness in the long and mid term 3C charts suggest the whole "malicious Bounce " concept is on track. That does not preclude some real intense volatility as they shake the tree, just know that in advance. We need to break the gap from Friday, then we will have some good momentum on a daily chart. I think the plan is working so I'd stick with it-

short term, 3C confirms downside price action which is all we can ask for. More later....

Mission Accomplished


I know there's a lot on this chart, but when you get some time, try to read the posts below and take a look at exactly what happened, you'll learn a lot about how the market is manipulated and what you should be on the watch for. Basically if you have been using T.A. like I have for a decade, you need to retrain yourself to think like smart money. Remember, Technical Analysis is very popular (too many people on one side of the ship), so smart money would be foolish not to use it to their advantage as they did right here.

As of now, we are seeing that intraday increase of volume and the downside momentum as we cut through SPY $110. Watch the volume as traders put their stops and orders right there. Watch the false move into the bear flag getting anxious longs (and make no mistake-after last week, they DO NOT want to believe that this rally is over, they are "HOPEFUL" and any perceived failure of that bear flag, their all over it-that may be what created the former highest volume spike of the day in red on the chart above (it was big before we saw the recent higher volume).

Now they'll start selling at a loss, that will snowball until the most hardcore long sells, at that point shorts will continue the selling and the entire idea of this "Malicious Bounce" that we talked about in late August, will finally all be clear to you.

On an unpleasant note, the WOWS site is quickly filling up-the same with the groups that send out the updates to your email. If your payment hasn't been made or hasn't cleared I'll send you an email-I understand as I forget things all the time, but without a timely response/resolution I'll have to remove your access as there's not a lot of room left and I need the space for new members.

Thank you to all of the WOWS members, this is a great group of people and I couldn't ask for better. I just want you to know how much I appreciate the trust you have put in me.

Mission Accomplished?

OK, they got price into the bear flag, because we see two 3C positive divergences on the 1 min chart (market makers), I'm assuming this is not random price action, but rather a bit of manipulation. You can now see the two red negative divergences and 3C is a bit more clear as we've had an hour of a trend rather then the see-saw up and down inside the bear flag.

You'll want to watch volume in reference to price moving down. The biggest volume spike of the day was at 2:15, 2 minutes later we saw the start of the reversal of that small uptrend into the flag. I'd think that this will lead to a pretty fast sell-off once the longs start selling losses-(this is relative when I say "fast" as we are looking at a one minute chart, but it has to start somewhere).

Any way, keep an eye on volume and price-$110 on the SPY is going to be a psychologically important area and it's bound to have all kinds of orders on the books there as it's a whole number. I'd think any real volume spikes and acceleration of a downside move would occur under $110 SPY.

Bear Flag

Here's our bear flag, it's not unusual for there to be a retest of the bottom trendline once it's broken. However, a form of manipulation that would actually be bearish would be to run prices back into the bear flag, thus giving longs and shorts the impression it failed-it would benefit the market makers as well as stops are now lined up just above that lower trend line.

If they have the impression it failed, longs may re-enter or hold their positions, as the market goes lower, especially if they entered or added to longs, the worse their suffering and eventual selling become-which creates the snowball effect. Again, this all comes back to the "Judo Concept" which  Wall Street uses Joes (the little guys) momentum and conventional understanding of technical analysis against them to create opportunities and to move the market without using their (smart money) capital

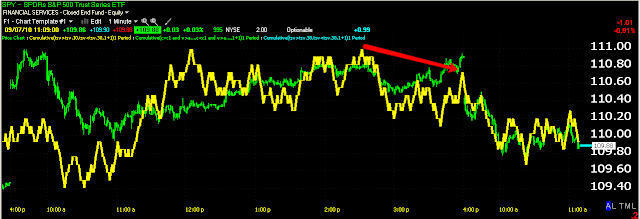
3C in the SPY shows a small positive divergence just before the retracement, the IWM, QQQQ and DIA all look far worse (bearish). The Q's look the worst, they may lead the way down.

The more reliable (bigger picture) 5 min 3C on the SPY just put in a negative divergence.

Remember, indicators get whacky when they are inside consolidations zones and this bear flag lasted nearly 3 hours, so readings are not always the clearest until we clear the zone.

Watch the Dollar

The short term 3C charts on the dollar just got shaky, one of our members sent me this

http://www.zerohedge.com/article/fed-monetizes-27-billion-worth-5-year-bonds-submitted-accepted-ratio-drops-58x

-not too sure I agree about strength in the market but this could be having an effect on the dollar. Long term (maybe medium term is better) 3C shows the dollar is resuming it's uptrend.

Like I said, it's looking shaky, I don't show confirmation in all 3 1 minute charts so it may be a momentary pause. I'll keep an eye on it.

3C 1 min. continue to confirm price trend in the market's it's following price almost exactly so there's no positive divergences really and I wouldn't expect to see a negative divergence unless we saw an intraday rally.

I think we're on target for our reversal, all signs as of now point to this.

Update

Still no positive divergences-price trend (short term down-which should roll into sub-intermediate down) is confirmed. We just saw a bigger bear flag develop. The break of the bear flag at this point to the downside would occur at $109.90 which I think it's doing as I type (Darn my two fingers!).  In any case, normal operating procedure for Wall Street would be to breakout the bearflag to the upside before letting it fall, -manipulation- they haven't done that so again, like lat week, they are creating a friendly environment for short traders and one that's not too friendly for longs. They are putting short term manipulation on hold in the interest of moving prices down.

ARNA

Interestingly, the ARNA long broke out today-nice.

I'm Adding to Shorts

When a plan works out, I take advantage of it. As I mentioned, there's likely to be volatility in the coming days, but it seems the path of least resistance -or literally of least support, is down.

Here's what 3C looks like right now and it's not surprising. The idea today, I believe will be to get the recent longs into the red, this creates the downhill snowball effect-the Judo Concept-what this was all about in the first place.

The charts....

Above a 1 min. 3C chart of the SPY-the red arrow shows Friday's close going negatively divergent. Right now 3C is in line with price, confirming the trend down.

This is the 5 min SPY chart you saw last week showing them selling the rally the entire time, the white arrow is accumulation so they'd have something to sell. There's nothing unusual here, except that for some reason you can't see the leading negative divergence 3C is in, that's why there's a red arrow pointing down. I somehow got a bad screen capture, but 3C is at new lows, not in the current position on the chart above.

Here's the QQQQ 1 min 3C, there's a small negative divergence right before it broke out of this morning's bear flag to the downside. Usually a pattern like this would be manipulated and you'd see an upside breakout to knock the shorts out and then it would fall-it seems right now they are giving the shorts a pass and creating that "friendly trading environment for shorts" and an environment that encourages longs to sell-thus far.
Above is the 5 min QQQQ chart. Again you see the big negative divergence-remember I said that the Q's and Russell outperformed, you can see they started distributing the SPY before the Q's or at least to a greater degree. Again the white arrow is the accumulation of stock/inventory to sell into the rally-extra money in their pockets. Again, this time the chart shows it correctly, there's a new low in 3C creating a leading divergence-this is showing extreme distribution and is in-line with price action this morning.

A 1 min. chart of the SPY, I think that gap may provide some temporary support-perhaps intraday, we'll have to see how fast we fall, but there should be at least a consolidation in the area. If it slices right through on heavy volume-as you can see the volume rise as it fell out this a.m.'s bear flag, then that would be extremely bearish and a snowball down will build momentum.

This is the end game of what was started at the end of August so consider using your advantage, just be on top of risk management. We have had an amazing prediction here, but we are not invincible.

EDZ/FAZ

I know I mentioned accumulation in EDZ last week, FAZ should do relatively well too. MSPD is one I've talked about and has swung pretty far north, but there was a flag there that saw a false breakout so it's definitely one to take a look at on the short side.

We See the Game Now, We find Out the Name Later

3C shows us the game is afoot, but as I have told you, it's often only later we find out how all the moving parts come together.

A story reported in the Wall Street Journal Tuesday brought back into question, the questionable results of the European Bank Stress tests. I had written back then that they were viewed skeptically when they were released. Apparently today there were some legs to that skepticism.

Euro Banks that hold risky government debt more or less found ways to keep it off their balance sheets or disguise it as something else entirely.

The release of the story sent European markets tumbling, earlier Asian trade had been largely up as follow through of the US rally on Friday, so this story is the one that brought down Europe and this morning the US markets. If you cant access the entire story then do a Google search for "Stocks fall on fresh European bank concerns Wall Street Journal"

Here are some key effects of this and see if they sound familiar:

"The dollar strengthened against the euro and investors bought U.S. Treasurys on the new European bank concerns."

"With investors worldwide moving out of stocks, U.S. bond prices climbed"

Any of this sound familiar? 

Since August 30th, the analysis here has been right on, we've just been waiting for the catalyst to reverse the market creating a Bull Trap after the shorts were squeezed last week. 

The release of this information on Tuesday, after there was apparent accumulation in the dollar and treasuries last week is a little odd in its timing isn't it? Remember I thought the bounce would last through last week. Last night I didn't see any economic releases that could have been a catalyst for our move down, but a few hours of sleep and BOOM! There it is in the morning.

Do you suppose that this caught Wall Street off guard after all you have learned and witnessed here at WOWS? I don't think so. As I have said many times, the media is complicit, whether willing or unwillingly, they are used to help Wall Street pull off these scams.

You know that even knowing and seeing what we see, the game is still a difficult one, can you imagine how 99% of the Joes are able to play this game when they are totally blindfolded. Apparently Bill Cara was even caught off guard although in his post sent to me this morning, he sounded quite irate and blamed this on obvious manipulation. We saw the start of this manipulation last month!

So, I know it was tough to hang in there, we may have more tough days ahead, but I hope you feel you got your money's worth and I hope you don't chalk this up to paranoid coincidence, THERE ARE NO COINCIDENCES ON WALL STREET.

This and That

I don't have a lot to say that I didn't already say, we'll see what happens. As I mentioned last week, there was a positive divergence starting in the dollar, so the pullback there could be coming to an end. There was also a positive divergence in Treasuries-short and long so look for some action there this week as well. As you know I haven't like Gold for awhile, but now the 10 minute chart is in a leading divergence, I'd watch for a continuation of Friday's downside move. Silver should come under pressure too, it's showing a 1 min and a really nasty 5 minute negative leading divergence, I'm not sure why it held up Friday, but I don't expect that to last.

Oil is starting to look indecisive, except on the 1 minute timeframe, there it looks bad, those could be a reflection of the accumulation in the dollar. The longer term charts seeming in disarray may be a switch from one sentiment to another with the 1 minute leading the way, we'll have to see if those charts come into line.

The 1 minute on the SPY is in a negative position, it doesn't look horrible, but it's not confirming the recent uptrend. It's the longer term charts that look bad there whereas they looked good before the bounce so as you know, I'm expecting a change there soon. The one minute chart may need to go into a leading negative divergence before we see that change or it may not, that could happen in half a day.

It's largely the same for the IWM and DIA, but the QQQQ has one particularly large negative 5 min leading divergence, I'm wondering if it is going to be the weaker of the 4?

In any case, will wait for some confirmation before acting too aggressively on the market, the treasuries, Dollar and precious metals may be something you want to take a look at now, maybe get your toes wet.

I don't see anything important on the economic calendar tomorrow.

I'll see you in the a.m.