Thursday, February 2, 2012

What's Up With AAPL?


AAPL as most of us know, posted what can only be called a “BLOW OUT Quarter” when they reported on January 24th after market. The respectable gap up of 6.24% the next day was entirely due to after hours and pre-market trading, by the way, AAPL had hit an after hours high of about 14% so a few people got left holding the bag on the open the next day. Since we know that institutional money doesn't chase and they certainly don't chase in the thinner extended hours trading, the gap up came from essentially dumb money.

What happens next as far as AAPL adding to those gains,, would be a matter for smart money, retail traders alone don't have the firepower to support a rally in AAPL, as devout as AAPL longs are. In the days since earnings, AAPL's lack of follow through has been noticeable, they've had a gain of 1.88% over the last 7 days and volume as of today has fallen of 81% since the gap up. That's huge volume on the gap up day, but it didn't drive AAPL higher off the open, AAPL actually lost nearly 2% from the intraday highs, which would suggest there was a fair amount of churning going on (strong hands selling to weak hands).

The trade since these blowout earnings has been a point of interest for me. Blowout earnings, a big gap yet no follow though.

We all know earnings can be strange, a company can beat and get sold off or they can miss and rally, a lot of it has to do with guidance for the next quarter. Wall Street looks at earnings in this light, “Earnings we're great, but can thy do better next quarter or have they peaked?”; it's called sentiment.

So in light of the trade in AAPL and because AAPL is arguably the most important stock in the market, with the largest weighting on the NASDAQ 100. If you want to know the true weight from the NASDAQ, you can pay $10k for their weighting schedule. However through a lot of number crunching, we know that AAPL had a weight of 18.4% in 2010, the next stock was MSFT with a weight of 4.5%. At the time, AAPL's weight on the NDX-100 was about the same as the bottom 50 weighted stocks combined, so if you want to move the NASDAQ, you move AAPL, which also means AAPL is a bellwether stock.

So I did a little digging around as to what was behind AAPL's blow out quarter that came on the heels of a very rare AAPL miss the previous quarter. Here's what I found...

As many of you know, AAPL introduced the I-phone with a 5-year exclusive rights contract with AT&T, that meant if you wanted an I-Phone, you had to go with AT&T which could basically had a monopoly on pricing of the plans. That changed this quarter; there are quite a few people who prefer Verizon, Sprint or T-Mobile. For the quarter just reported, AAPL added the 3 carriers mentioned above, that may explain the miss in the last quarter, why buy an I-Phone last quarter when you can wait a few months and get an Iphone on the carrier of your choice? That's pent up demand and as mentioned, probably contributed to the rare miss, but added substantially to the quarter just reported, the thing is, that pent up demand times 3, is a one off event, it came, the demand was satisfied and it passed.

Also the delayed I-phone update (which again probably contributed to the rare miss), just so happen to come during Christmas, obviously the biggest seasonal factor contributing to sales.

You may recall there was some initial disappointment with the I-phone 4S, while it was an upgrade, it wasn't the monster upgrade I-Phone fans were expecting, which also means that minimal changes were made to the phone, they were a camera, OS and a chip upgrade. On an Apples to Apples basis, the I-phone is actually technologically about a year behind the Samsung Galaxy SSI Series. When AAPL releases the next upgrade, it won't be so cheap. Among expected upgrades (just to get in line with year old Samsung technology) new and more expensive: Camera, Screen, a Quad Core CPU Plus Graphics Chip, More RAM/ROM, and a new battery. Samsung and Motorola both have significantly better batteries, AAPL will have to pay up so they don't fall behind.

In short, AAPL's R&D is going to have to step up expenditures to stay competitive with Samsung and even some Motorola phones. Doubt the supremacy of the Galaxy? According to the leaked specs and a comparison, the Samsung phone is about 2x more advanced then the current I-phone. Just a few examples: 1080p video recording, a battery with twice the capacity, half the size and half the weight, competition has cameras from 10-16 megapixels, higher screen resolution, quad-core processors, as well as external memory chips and more.

As far as the tablet market, Android has moved from 9% market share to 40% in less then a year! During the same time, AAPL dropped from over 90% to 60%.

AAPL has some R&D catching up to do and Cook made mention of it, saying” Don't expect the margins from last quarter again.”

AEO Trade Idea

Something is amiss in this sub industry and I'm sure I'll find more candidates.

 AEO daily bear flag

 As for a high probability Swing Short entry, I used a 2-day chart just to clean up the trend and see where the pivot was. The red trendline is the pivot and a move below that, even on an intraday basis, will likely make for a good swing entry, even if you want to treat this as a trending trade. I don't see this gap being filled, which makes it a rare break away gap and very bearish at that.


 Here's the idea, sell short AEO on a move below $13.70

 The 2- day Trend Channel holds the Trend here pretty well, so my initial stop would be at the upper channel which is $14.50, that's too obvious a number so I'd pick something like $14.63 or $14.41. In any case, the risk isn't too bad on this trade and the probabilities look good.

This is the first Apparel in the "Specialty" sub-industry I could think of, ANN, and it's not looking too good today either, so I assume when I look at the sub industry component stocks, I'll find a bearish trend developing and probably some more candidates. If any one is interested in this as a short and maybe wants to run a pair trade, let me know and I'll look for a long hedge for the pair.

What's moving the market today

Keep in mind the sector rotation and specifically Energy as USO moves up intraday to fill the gap.
 Financials are sliding in the afternoon...

 Tech has been sliding all day, probably partly explaining the 3C IWM/QQQ charts looking the way they do.


And in red, Energy is tracking or I should say leading the SPX nearly tick for tick, but largely on a gap fill.

Afternoon Sector Rotation, a bit more defensive

 As you can see, the risk sectors are losing their relative strength, like Financials, Technology, Materials and Industrials, the more defensive sectors like Health Care and recently Staples are coming in a bit, are rotating in, I suspect this is in advance of tomorrow's Non-Farm Payrolls, I personally think given the data we have seen this week, they come in a bit weaker then expected, but you never know with the Bureau of BS, I mean the BLS (at least you don't know until the next reports downward revision). Note Energy is staging a bit of a late day comeback, which is what any potential USO shorts want to see.


 Natural gas/UNG is making quite a show of it today, up nearly 8% on volume, remember when we first started seeing the changes in character to a more bullish tone, I warned, "Don't expect a V shaped recovery", UNG will likely base a little, so I have no problems with UNG's performance this week.

 Here's USO's daily candle off its lows, remember there's that gap I mentioned this a.m. and that is where I'd want to start a position or add to if I didn't already have coverage there.

In yellow, that's the gap. USO isn't exactly steaming full speed on volume, but it does look like it is targeting the gap.

Technology is significantly (for the day's volatility) off the morning highs, Financials look like they'll put in their second star candle in a row (this indicates a loss of momentum and indecision, leaving it open to a reversal). Volume is also off in Financials.

I'll show you the internals after the close, there are some interesting developments there.

ES is hugging it's VWAP so I'd suspect orders are being filled, probably in anticipation of tomorrow's NFP.

The QQQ has put in, thus far, a near perfect Doji Star on a .29% gain, no follow through from yesterday as it was seemingly about Greece or at least that's what they wanted us to believe.

The SPY is very close to a near perfect doji star at a .16% gain, again, no follow through as I pointed out in last night's post, yesterday was an uncharacteristic day, that's not just an observation, it's a clue.

The DOW is also putting in a doji star and is off on the day at, slightly red.

All in all, where are the bulls from yesterday?

Market Update

First don't forget, tomorrow's fulcrum event is the NFP.

 The IWM recently is looking the worst near term. It is now leading negative.

 The Q's have all the same similar divergences at the same time, they don't look as bad, but they don't look good, remember what the IRE chart looked like when there's good confirmation of a move.

 The SPY seems to be just coming apart since yesterday's highs.

The NYSE TICK Index (number of NYSE stocks advancing minus declining) looks a whole lot different today with readings hitting almost -1300.

IRE Update

I never thought I would recommend a long trade in an Irish Bank, but I did in this post on Jan. 31

So far IRE is up exactly 18% from the post and in the last 2 days, it's right at a decent size gap (resistance) and also at the point where it could make a stage 2 breakout.

When I mentioned the trade, I said I would treat it as a position trade (longer term, with a wider stop) so if you are in the trade or if you would like to consider getting in, this is your update.

 The daily chart with an RSI positive divergence, excellent volume on a rounding bottom and the white arrow is the entry, which is a swing trade entry method, there's a link on the WOWS site under the risk management link about these Swing entries, which I prefer as the probabilities of the trade go way up.

 Using the daily Trend Channel as a stop at this point guarantees at least a break even trade and allows some room for consolidation/pullbacks. This is my preferred stop, but an 18% gain in 2 days isn't bad either, I leave that to you.

 The 10-day average was the first pull back, the second may be a bit deeper, but the question is whether it breaks out to stage 2 before pulling back.  If you are not in the trade, the two entries I would favor would be 1) a breakout above resistance at the gap that is being filled today, but the volume should be huge, nearly double what we have already seen, this entry gives you a high probability entry, or a pullback which gives you a better risk profile, or you can blend the two with a partial position and an add on a pullback, although I would wait for a breakout before buying,  you give up some percentage points, but you make up for it in probabilities and this could easily be a 300% trade.


 The close within the range as you can see has been very high and bullish lately.

 The daily chart suggests this has a lot more upside, that's also why I think it hasn't hit mark up yet.

The 60 min chart's accumulation...


 The 15 min chart in perfect confirmation, this is what a healthy move should look like.

 The problem is, even the 1 min chart is in near perfect confirmation, so it is not hinting that a pullback is being planned, at least not yet.

Here's the breakout to mark up, if we get a pullback before then, it's a low risk entry, if we get a breakout on high volume and it needs to be watched, then I would consider at least a partial entry there and leave some room for an add to on a small pull back.

If you are already long and want to look at stops to protect the gains you already have (tight), then just email me.

I've been running some scans and have some other trade candidates that I'll be positing today.

ES and VWAP

Late in the seeion yesterday I suspected ES would break below VWAP (Volume Weighted Average Price) and VWAP is an interesting indicator because it is one of only a handful of indicators Wall Street uses, primarily to determine the performance of a market maker/specialist's performance in filling a large trade. The middle men, market makers on the NASDAQ and Specialists on the NYSE (The typical image of guys on the floor screaming out orders) represent about 30% of the trade in any given stock for their own accounts, they have many advantages we don't such as naked short selling, but they are also bound by rules for those advantages, such as they MUST fill a market order if they can't find a match for your order, even if you place a sell order in a cratering market, they must buy from you (which is the last thing they want to do, buy inventory in a market that is falling sharply), so they influence intraday trade more then you may realize, although High Frequency Trading is overtaking them. They also will hold stock or sell short, depending on which way they see the market going as they have a full view of the market order book (well beyond what you see in level 2). Many times when we see small 1 min 3C divergences, it is simply a market maker/specialist, accumulating stock for an intraday move which they may sell later, all the small trades, the difference they make on the bid/ask spread and volume rebates they receive, all add up to a nice chunk of change.

However, a lot of intraday trade you see is misleading as the middlemen work to fill large orders, typically at VWAP. For example, a sell order may come in, they want to sell this large order in smaller chunks as to not drive price down against them, when price does go down against them, they will "work the bid/ask" increasing it, they will flash bogus big block orders that get traders to think a large buyer is coming in to the market and then pull the order, all of this to drive price back up to VWAP so they can sell the next small chunk and on and on it goes until they finish filling the order. Morning trade can be especially deceitful as they can take advantage of limit orders and stops set by part time traders who have to head off to work.

Any way, I've had problems capturing the ES chart today, but I finally got the VWAP for today thus far.
VWAP is in pink, the other two lines around it are 2 standard deviations above or below VWAP. It's interesting just to note the activity, the candles and momentum at different areas. For example, in pre-market (lighter shade to the left) WVAP is hit and sell orders drive price down two standard deviations, we see a hammer candle and the next move toward VWAP begins. On the open the red series of red candles move price below VWAP, remember the early 3C 1 min positive divergence near the open?  That accumulation drove ES up 2 standard deviations (if they are selling a large order, selling up here is much more desirable), but again ES breaks through VWAP on a strong series of red candles that are pretty large bodied. VWAP acts as resistance and price moves again to the lower channel at which it finds some support, again the support can be created by the many tactics the middle men use, flashing big block buy orders and pulling them, etc. Since I captured this, as I was going to say there will likely be another move to VWAP, there has been, but it fell short. This is a huge difference from yesterday's market in which trade remained above the VWAP almost all day until the final 30 minutes or so when the pros come out.

Here's yesterday, you may want to look at last night's post and the breadth indications and other indications that led me to believe that VWAP would be broken yesterday.
Yesterday's market and the close below VWAP.

When I have some time over the weekend, I'll try to discuss some of the HFT trading tactics, such as "pinging for icebergs".

They are all just pieces of the puzzle.

EIA Natural Gas Report

First I should mention that UNG announced yesterday that there will be a 4 for 1 reverse split. I have had some questions about reverse splits, there's not a whole lot of influence in UNG's case, there does tend to be an initial disappointment among investors on a split as I have alluded to earlier in the week, traders feel more empowered owning more shares, but whether you own 4 shares or 1 share is irrelevant, the percentage gain is all that matters. It can be good on several levels, first if UNG were to fall below $5 there would be margin issues that may dissuade some investors. Some funds also have a bias against lower priced stocks, I remember one trader giving an interview saying 'Never buy stocks below $15.00'. In companies that are trading at a very low level there can be possible exchange de-listing ramifications, that would not be the case for UNG. All in all, I would say it doesn't matter that much, but if I had to come down on one side of the fence, I would say it's a slight positive.

The EIA report today was more significant.


Released On 2/2/2012 10:30:00 AM For wk1/27, 2012
PriorActual
Weekly Change-192 bcf-132 bcf


The actual draw was 132 billion bcf leaving supplies at 2966 billion bcf. Consensus averaged a draw of 130 bn bcf, so there was a slightly larger draw then expected which moved UNG today.

During sluggish economic activity, demand for Nat Gas is not expected to be strong, so even a 2 bn bcf draw is seen as bullish for UNG/Nat Gas.

We have had quite a few experiences in the past with obviously leaked EIA reports, mostly in crude as that has been what we had been most focused on in the past. I can't say if this was leaked, but there was clear accumulation of both the recent pullback as well as the lows yesterday.

This large volume spike is exactly 10:30 when the report was leaked, the candle went to intraday lows to a trend moving up, these large volume spikes whether they be at the top or bottom of a trend, typically are a churning, or exchange of shares from weak hands to strong or vice-versa.

 The 15 min 3C trend during the pullback has been leading positive indicating accumulation.

 Here's the positive divergence on a 10-min chart at yesterday's lows

 Relative positive divergences and a strong positive divergence at yesterday's lows and a current leading positive divergence which is stronger then the relative divergences.

And on a 1 min chart, we have a beautiful example of what upside confirmation looks like.

ES Update

For some reason I couldn't capture the ES chart earlier on the SPY update, I've got it now...

GALE Pair Trade

If you want to run a pair trade in biotech with QCOR, take a look at GALE, while a very speculative trade, I do like the look of the chart and I do like the idea of a pair trade here (short QCOR/ Long GALE).

 Gale RSI positive divergence and a long X-over signal. Obviously a pullback would be great, but again, a phased in approach might be the best approach with GALE. The position size should certainly be much smaller as this is a speculative stock, but in the same sub-industry group as QCOR.

 The candlestick indicator (still no name) has shown a bullish slant lately with candles closing in the upper half averaging around the top 75% and up to the highs of the day.

 Long term daily accumulation and a rounding base.

Longer term 3C leading positive.

It's not easy to buy a 12% gain, but that is where the phasing in works, allowing some room for a possible pullback, I would use the Trend Channel as the stop or just below it ($.60 area).

Bernakacide's Testimony on CSPAN

This is worth playing in the background, here's the CSPAN link.

SPY Rolling

The S&P is rolling over a bit faster then the Euro here, although we are just exiting morning trade. ES is also negative here.

 Early trade, 1 min early positive divergence and a relative, then leading negative .

 Yesterday's late day sell-off shows confirmation, the 2 min chart hasn't confirmed the small bounce this a.m.

The 5 min has been deteriorating since mid day yesterday.

QCOR Trade Idea

QCOR looks like a nice short set up, it has broken down badly from a long term up trend and is showing many changes isn character. The trade is probably very close (letting it come to you) to a high probability/low risk trade and very close to a stage 4 trade. In a long trade stage 2 mark up is where the trend and easy money are, in a short trade stage 4 is where the trend and easy money can be found, the difference being that stocks fall a lot faster and harder then they rise. QCOR has had a great run of over 9000% in the last 5+ years, but something is changing the tone.

 Volatility spikes are often a warning that a top is forming, my custom close within the range indicator has also been quite negative with the average being between 25-50% and not much above that. Think of this as a long term candlestick chart and the trend is a candlestick with a long upper wick and a close in the lower end of the range, like a shooting star.

 RSI has been negative and it both broke and filled the gap on the same day on heavy volume.

 Here's the recent x-over signal

 QCOR is now sitting on some long term support (150-day m.a.), so it's very close to a major break, but also in the area where we can probably short in to some short term price strength on a bounce off support.

 There are many smaller divergences on the chart, but the biggest ones are what are important, the positive divergence in 2003-2007, the confirmation since the stage 2 mark up began and recently distribution and quite strong on a daily chart.

 The hourly chart shows the same, from confirmation to distribution.

 As does the 30 min chart

 And the 15 min

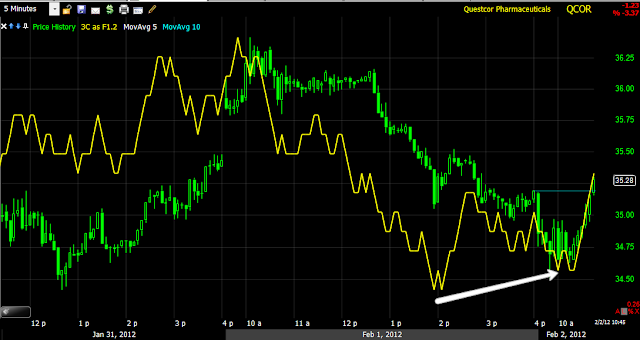
 Near term we have a small positive divergence, this is the bounce we want to look at shorting in to on some price strength to lower the risk of the trade for risk management purposes, which may also allow you a larger position.

The Trend Channel and the 22-day moving average would be my rough targets and considering where they will be, I'm thinking somewhere in the $36.50 area, although you may want to consider a phased entry in 1/3 or 1/4 size positions once you figure out your maximum position size and risk management.

I would expect to see a move to the long term trend line, in the $20 area. Email me if you have specific questions about the idea.