Yesterday was the day I thought was best used to buy some VXX calls and IWM puts, expecting the market had hit at least for now, a short term top in what I believe will be a choppy road ahead. Both positions that were added yesterday as well as a number of positions closed which I didn't put out the P/L for due to time, were closed and opened right on time.
All of the major averages closed red today with the R2K (IWM put opened yesterday) down the most at -0.64%.
Another equity short we opened yesterday was IYT (Transports) which is in the green today as well as our other new positions.
IYT opened yesterday as an equity short. The candlestick pattern isn't a perfect Harami or evening Star reversal, but the gist is a bearish reversal set up in the candlesticks with today's open near the top of the range and close near the bottom of the range, providing an excellent reversal confirmation.
We have a bit of a gap and some support coming up around the yellow line so we'll see what it looks like in the area, possibly go with something with a little more leverage.
The R2K had a similar bearish reversal pattern, two strong days up, but the second with a smaller range followed by a star and today's confirmation candle, again opening near the top of today's range and closing at the bottom, this is what you look for in Candlestick reversals.
As far as positions closed yesterday that I didn't have time to put out the P/L...
FSLR was closed nearly at the perfect time as it was down -3.18% today, that would have killed all option/call gains, you know I still like FSLR and we'll be looking at it on accumulation through a pullback.
With a cost basis of $4.80 and a fill of $6.05, FSLR was good for a quick gain of +26%
XOM was a core short, it was closed out and opened as a long as I expected a counter trend bounce, that means I'll be looking to get back in to XOM short at some point. I decided to close the September Calls since expiration and Theta decay is becoming an issue and I left the longer Oct. Calls open which are still at a gain, even though I expected I'd suffer some drawdown there as XOM was down nearly 1% today.
With a cost of $2.88 and a fill of $3.80, the September XOM calls gained a nice +32%. Notice that I don't use options to try to hit home-runs, that's more like gambling, you make a big hit and then die a death of a thousand pin pricks. I only use options when I feel there's a strong set up, but it's lacking the trade length or profit potential to make it worthwhile, so we have pretty high standards for option positions, but options are used as a tool, not a main-stay technique and certainly not a Lotto Ticket.
TECL was also closed right on time as today's +.017% gain which I suspected, just wasn't worth the risk. In fact yesterday I even said that there's probably some more upside in TECL, but so minimal that it's not worth the risk. If I wouldn't have bought it yesterday, I see no reason to hold it.
TECL had a cost basis of $61.01 and a fill of $66.06 for a gain of +8.27% which isn't spectacular, but it was a short trade.
MCP was DEFINITELY closed at the right time as an equity long as we closed the calls near the highs; with a loss of -4.51% today, the signals were coming in loud and clear there and the timing was near perfect for the trade vehicle (calls should have been closed the day before). This is another I like as a longer term long position, we'll be watching it for a continued pullback and accumulation in to that pullback to start a new long position, assuming the signals are there to justify it.
With a cost basis of $6.07 and a fill of $6.77, the short term trade made +11.50+% so a lot of nice little singles and doubles in an otherwise choppy and you know, DANGEROUS market.
The IWM puts, VXX calls and the IYT short equity positions from yesterday are all at a gain, now we have a few like Gold miners to pop.
Early today in the pre-market update, I noticed a few things and then later when the Initial claims came in. What is interesting is Syria is definitely effecting the market more than other MENA revolutions like Tunisia or Egypt and I know what you're thinking, the US wasn't contemplating a strike there, but it was exactly that situation in Libya and I recall very clearly it had almost no effect on the market and very little effect (surprisingly) on oil, considering Libyan crude is sweet and what Italian and other European refineries are set up to handle while the Saudi oil that was promised to make up for any supply disruptions in Libyan crude is sour, it takes nearly 4 barrels of Saudi Crude to get the grade of fuel Italy/Europe needs vs. 1 barrel of Libyan crude,
the point still being, even though we intervened there we did not see the same kind of reaction Syria is giving off.
This is a 1 min chart of Crude Futures, early in the morning around 4 a.m. EDT crude spiked on a very small 3C divergence indicating it was likely a fundamental news event that the market was discounting, I believe it was the same time two shells fell inside the Golan Heights in Israel, even though they were thought to be errant shelling.
Then you can see a clear negative divergence around 9 a.m. as Assad came out saying that he'd follow a Russian diplomatic plan to end the crisis sending crude lower as the war premium was discounted.

This is an intraday chart of ES (SPX Futures), note there's no reaction at all to this morning's beat due to technical glitches in Initial Claims, however when Assad started making demands like Israel give up it's weapons of mass destruction and the US stop supporting terrorists, the market clearly reacted.
The market seems much less interested in the September Taper of QE3 than Syria.
As far as currencies,
you may recall my currency post earlier, here it is if you missed it. Actually, to be more specific, this post was a look at several assets including Treasuries, Credit, volatility and currencies to see if there was any likelihood a carry pair or SPY arbitrage could move the market, my near term conclusions was no and that's partly why I left yesterday's positions in place as they were originally going to be closed today.
This is the USD/JPY 5 min chart and one of the potential market engines, I thought it wouldn't have what it takes to lift the market, I did mention though that I thought good support was right at $99...
The 1 min chart shows the low of the day at $99.004, SUPPORT! The current 3C divergence, even though only a 1 min, is negative.
Most of the rest of what I want to show you is leading indicators and as I said late in the day, "Don't get lost in the lines", step back and look at the big picture because it's getting very ugly. I'll show you leading indicators and then some of the longer term Index futures / 3C charts.
Leading Indicators (Leading Indicators will always be compared to the SPX in green unless otherwise noted)...
This is a longer view of Commodities vs. the SPX. I showed you earlier today what the SPX's performance would look like since late 2008 without QE or operation twist, every time since 2009 that there hasn't been a F_E_D program running, the market has lost a substantial amount in a short period, however while the programs are running, the market gained a substantial amount, this should tell you something about what the market will look like when the F_E_D starts to taper QE3, (many think the taper will be announced in Sept.),
even worse, about 6 months after QE is completely done, rates will rise and the market has always dropped in to a bear market on rising rates, the F_E_D has a huge balance sheet unwind and no one alive has any idea of how bad this will be because it's unprecedented.
The point here though is simple, commodities are risk assets and they were bid up and bought just like stocks until they weren't, that's when we correctly theorized that something bad was happening in China and weeks later we got the first contractionary PMIs from China. I also think Bernie told the Primary dealers to make money, but just not bidding up commodities as numerous businesses were seeing rising input costs resulting in margin squeezes.
This shows Commodities vs the $USD, here you get a feel for the natural correlation between the $USD and commodities such as oil, precious metals, copper, etc, its an inverse relationship.
The point being, commodities are a window in to the global economy, it's not doing so good and we have never had a serious bear market in which we had so much of a F_E_D balance sheet to unwind nor have we had it with the global economy so connected and in such bad shape.
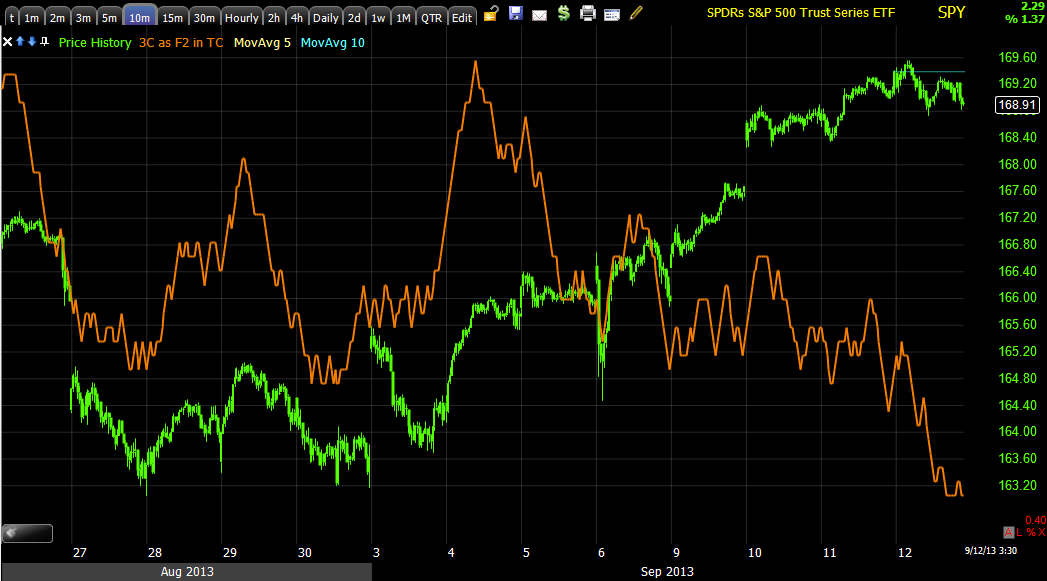
Yields act like a magnet, pulling stocks toward them until they revert to the mean, above we have a short term 5 min chart showing yields reverting to the short term mean, this is one reason I think we are in for some near term market chop, however...
On a longer basis you can see Yields pulling the SPX to them, right now they have a larger negative divergence pulling the SPX toward them to the downside, another reason I decided to let yesterday's new positions ride.
This is a longer term look at our Pro sentiment indicator, you can see by the trendlines that it's off already, but the recent move almost exactly opposite the SPX spells major trouble and while we play long and short trades, the core positions I have been talking about are the most important to establish and this chart should give you that sense of urgency.
When the accumulation cycle for this move started, the upside move was expected to be strong, but also to be distributed in to which it has, when this comes down, it's not going to be the break finally, it's going to be the next leg lower.
This is out of order, but Yields again on a short term basis, they look like the SPX should see downside in the next day or two so the shorts from yesterday stayed in place,
but I don't feel like this is a great, low risk, high probability area to open new short term positions, core positions yes, but short term, yesterday was the day for that.
Our sentiment indicator on an intraday basis, no belief in a ramp, no expectations of higher prices near term, that's what I see above.
And here sentiment is clearly negative again, moving opposite the market, this has been a very accurate leading indicator so I'd expect a reversal process, distribution and a nasty move to the downside now that we have a head fake move in place and retail is getting bullish again.
Long term sentiment and the red arrows are the exact place I said, "Today the back bone of the market was broken, it may still wiggle around like a snake with a broken back and be just as dangerous, but this is the break in the market", it seems professional sentiment agreed.
This is TLT today, not real attempt to ramp the market with a SPY Arb. move. From what I understand there was srtrong demand for today's 30 year bond auction, you know I like TLT, I showed you today 10 and 30 year Treasuries and the difference in 3C, I don't know why, but it's been like that for a while and TLT has showed accumulation for a while. I'll put out a post on TLT, I just don't like the low beta and no really great way to leverage the position up, but something is going on there that I can't explain and it showed up in a 30 year auction today.
HYG HY Credit showed no attempt to rally the SPY arb for a closing ramp, I have and showed charts at the EOD of distribution in HYG, it was only used during the accumulation range to help the market, but otherwise, credit is extremely dislocated from the SPX,
"Credit leads, stocks follow", that should be warning enough.
Among these charts of today, you'll find the HYG distribution.
This is a more reasonable look at the correlation between credit and the SPX, this is a massive leading negative indication, you see what the last one did to the left, wait for this one, but make sure you're in position because CREDIT IS SCREAMING,
"RUN FOR THE HILLS"
HY credit intraday didn't skitz out, so I still think we have a choppy range of ups and downs to go through while market distribution continues, I think High Yield Credit will falter badly just before a real bad break in the market.
Here's a long term look at HY credit vs the SPX, this is the first time since 2009 that HY Credit has been dislocated to the downside and badly, what does credit know that the SPX doesn't?
Just about everything, that's why it's one of our leading indicators.
Now for some 3C charts of the Index Futures... I skipped the less important charts and went straight to the bigger picture.
ES (SPX futures) 15 min negative 3C
ES 60 min this leading negative 3C chart is really bad news for the market, it will take a little time to get there as we have to finish the reversal process, but we actually aren't far from what I'd consider to be proportionate.
NQ (NASDAQ 100 Futures) 60 min Another Leading negative 3C divergence, the divergence is bad enough, but at this timeframe, that is
massive distribution!
NQ 4 hour And if 60 min is bad,
the signals on a 4 hour chart are huge, that's insane distribution, this is why we need to step back and not get lost in the lines or small moves against our positions.
TF (Russell 2000 Futures) 15 min This shows the recent distribution in the R2K has been strong, another reason I let the October options opened yesterday run.
TF 30 min This is just telling us it's worse than what we saw above.
TF 60 min and at 60 min, this market is done, it's just a matter of timing, this is what you need to see when you are feeling emotional or afraid over core short positions,
in my view and from my research with 3C of historical bear markets, this is the chance of a lifetime.
I'll update futures if I see anything interesting tonight,
remember, be patient, in a choppy market sometimes it's better to step aside and I think we get a choppy market for a bit, you certainly don't rush in. There's a bus every 30 mins. , you aren't going to be left behind.