Thursday, December 15, 2011

It looks like the Euro breakout has begun

Remember the triangle we were tracking all day today with accumulation in FXE/Euro?

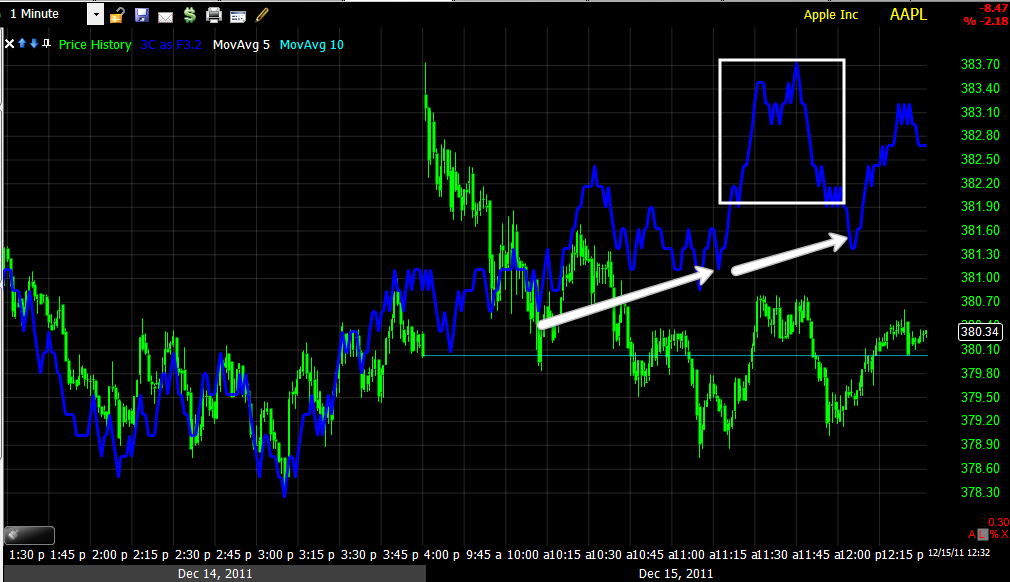
Well take a look now...

The trenlines are pretty rough, I know, but that was the triangle, it has broken out to the upside. It briefly stumbled today at the red box when Paris based Fitch downgraded 8 major banks including: BOFA, Barclay's, BNP Paribas, Credit Suisse AG, Deutsche Bank, the "Squid" itself, Goldman Sachs,   and Morgan Stanley and Societe Generale both had their viability ratings downgraded. As I said earlier in the week, get ready for the flood of downgrades coming, but still the Euro looks intent on bouncing which will let the big players unwind their $1.30 longs and reposition short.

Also mentioned, even though the averages themselves didn't have very strong positive divergences (as this is a Euro move) the averages will track higher due to legacy arbitrage FX correlations and ES is showing us that tonight as it tracks higher.

Ultimately, even though I put some leveraged long ETFs in the model portfolio for a short term trade, I left all the long term shorts in place and ultimately (recall, a top is a process not an event) we should have something that looks like this as we have waves cresting and breaking, but the bigger picture is the tide going out.
The top rounding over is the tide going out, the counter trend rallies are the waves cresting (where we want to short in to strength) and the declines are the waves breaking, but with each break of the wave, the tide moves out a little further.

Although holding these longer term positions is difficult and you have to deal with draw down, they continue to move in the right direction and this week the Model portfolio has done incredible.
Weekly and monthly performance

For perspective...
 the WOWS model portfolio ranked #3 this week of 9,016 total weekly portfolios and..

#49 for the month out of 15,418 portfolios!

I also won some award, although I'm not sure exactly what it is, but it's for the WOWS options model portfolio, here's an excerpt from the email....


Congratulations!
We are happy to inform you are officially a Winner in the Wall Street Survivor™.
Please copy and paste the following link in your web browser and complete the form in order to process your reward.

Sincerely,
-The Prize Patrol-
Wall Street Survivor Stock Trading Contest
prizes@wallstreetsurvivor.com

I didn't even know about this, I'll let you know what the prize is and what it is for, maybe a coffee mug or t-shirt? :)

See you in the a.m.

FXE/Euro

FXE/Euro has been in a triangle all, day, it's just sitting there accumulating getting ready to pop higher. I still think this is a volatility move from the break of $1.30 yesterday, but it should move the market higher tomorrow.

15 min FXE leading positive

RIMM Update

All of the short term RIMM charts are getting stronger before earnings, it looks like a leak


USO Update

This is for the short term traders short in USO or long SCO, I'd take profits right now.

 1 min

5 min

Market/Euro Update/Trade

Considering the OP-Ex chain, and the fact that I said earlier and I feel the Euro isn't done, I've taken a look and I'm thinking there's a short term trade here.

 I said I thought the Euro would form a triangle today, the SPY has.

 There's not much going on in the short term 1/2 min charts in the SPY (Above and below)


 There's really not much going on in the 5 min either surprisingly

 But the 15 min has shown some recent strength this afternoon, the SPY will follow the Euro.

 Longer term at the 30, the SPY is rolling over, but why shouldn't there be a nice pop to $125 to wash out the weak hands?

Here's the Euro forming the triangle I thought it would, low volume, an excellent place to accumulate quietly.


 Now here the 1 min chart looks better

 The 2 min is leading positive

 So is the 5 min

And as of this afternoon, the 15 min.

I think we're going to get a pop off the Euro which the market will follow, this has been the idea the entire time, it just looks like it may be sharper then expected.

I'll probably add some short term trades using leveraged ETFS like TQQQ, URTY, UDOW or UPRO to see if I can get a quick pop. This doesn't change the short positions in the model portfolio which are longer term trades, but I think there's a good chance off an op-ex surprise, so I'm going to try it out.

Watch for a downside head fake in the triangle, that may be a good sign of a pop coming.

OP-EX PIN

Well I have to say that this option Exp. week looks unusual to me, there's barely any open interest at the money in calls or puts on the SPY. If I had to make a call based on the chain alone, believe it or not, I'd say the $125 area would be the pin.

It's possible.


RIMM Earnings After the Bell

This has been one of our short picks, it did everything we thought it would over the last 4-5 months. So they report after the bell today. I don't like to look this early as GOOG we hit, but not until 15 minutes before the close, but lets take a look.

I have to say, I'm kind of surprised.
 A recent RIMM 15 min leading positive divergence

 A 10 min leading positive divergence

 A 5 min building positive divergence (market makers maybe stocking up?)

 A very positive 2 min divergence

And a positive 1 min divergence.

My guess would be that RIMM had something leaked, I don't know what they could possibly do right except for maybe guidance, and I have no idea whether the beat or miss, but it looks like the intermediate term action/response will be positive. I wouldn't jump to any conclusions on price until the press conference.

That being said the 30, 60 and daily charts are in line which is negative, but maybe the 25 min will bleed strength in to those or perhaps RIMM is just going to catch a break for a bit, but if I had to bet, I'd be betting long on RIMM's guidance.


RIMM Earnings

Euro update

My bet is the Euro is not done, as I mentioned yesterday, there are a lot of long contracts at $1.30, they can't all be flipped in a day. The Euro looks to be consolidating in what will likely be a symmetrical triangle today, there may be a false downside break, but look for an eventual upside break, this s why we are leaving room to add to shorts at higher levels, at least the ones I have featured today.

Ultimately, I think the Euro and the charts agree, breaks $1.30 and snow balls much lower, but for now, it still looks like it has more work on the upside.

I'll be looking at the options chain next to see where we might be pinned tomorrow.

More China Confirmation/FXP long Trade Idea

It must be over a month ago now that  noticed the trade in commodities was not looking very good and speculated that China is being hit with a slowdown as one of the world's largest consumers of commodities. A few weeks later we got confirmation via SM services and manufacturing, both of which printed sub-50 or in decline. There has been additional evidence since and I spoke of this as late as last night.

Today, more confirmation:

  • CHINA'S `NOT TOO OPTIMISTIC' ABOUT EXPORTS IN 2012, CHEN SAYS
  • CHINA'S TRADE GROWTH MARGIN DECLINED IN DECEMBER, CHEN SAYS
  • CHINA EXPORTS 2 PERCENTAGE POINTS LOWER IN EACH MONTH OF 4Q
  • CHINA 2011 IMPORT GROWTH RATE 5 PCT POINTS HIGHER THAN EXPORTS
  • CHINESE COMMERCE MINISTER CHEN DEMING SPEAKS AT GENEVA BRIEFING
FXP has been the trade of choice for broad China coverage, but commodities also and VALE was a specific play on both.

FXP, the inverse leveraged bear ETF on China looks like in the near term it will give us a pullback and a better entry, the longer term looks solid, so make sure FXP is on your radar.

 On a daily chart, our crossover screen is very close to a long signal and I would expect a pullback may end around the red box.

 Intraday we have a small ascending wedge, there may be an upside head fake move, but ultimately this should break down, volume is correct for the bearish intraday wedge, that's our pullback.

 The 2 min chart confirms short term distribution in to the wedge.

 The 5 min chart remains strong so again, I expect a pullback only.

 The 30 min chart also remains strong and it looks like a recent "W" base has been formed. Watch for volume to expand on a rally out of the base.

 The 60 min chart shows the "W" base better and a strong leading positive divergence, so short term pullback, longer term strength.

Most impressive is this multi-day 3C chart showing a rounding bottom that appears to have huge accumulation, so just have a little patience, let the trade come to you. China is obviously heading for a hard landing.


AAPL Update

I still think AAPL will be able to move higher and the higher the better for our purposes of shorting price strength.

As mentioned early today, early morning trade is always deceptive, when I was trading exclusively for a living,  would rarely consider anything that happened before 10:30 to be authentic, there's just too much gaming on the open. If you look at the early ES chart I posted this a.m., the market was up in premarket and evert trader that had to go to work was putting in their limit buy orders and stops, note how ES dropped right off the open, filling orders and then hitting their stops. This is an additional source of revenue for market makers and would be market makers as they not only collect on the Bid/Ask spread, they fade the bounce shorting the open and overing lower and they get additional volume rebates.  As we have moved away from that period, things are becoming a bit more clear.

 AAPL 1 min has posted a couple of positive divergences and note there's a particular area being accumulated around $379.00

 The 2 min chart shows the distribution on the open and then covering and subsequent accumulation, now slightly leading positive.

 The 5 min remains negative.

The hourly provides the bigger picture, it' been leading negative since we first opened shorts last Thursday, note 2 head fakes, the second more extreme then the first and then what happens? A Decline of course. There's a reason we see these head fakes so often before reversals. Longs, and AAPL longs are hard core only second to gold bugs, buy the breakout, shorts are squeezed and then the bottom falls out, longs have to sell at a loss, shorts enter and you get the snow ball effect which causes parabolic drops like the one we see here. The bottom line is AAPL remains a short as long as this 60 min chart is in such heavy distribution, but Wall Street will want to shake the shorts and weak hands and enter again at better pries, I would short any strength well up to the recent highs if we can get it.


USO

Last night I mentioned I'd be interested to see how commodities did today on the Euro bounce, according to dollar arbitrage correlations, UO should be higher, but as we have noted many times recently, USO is acting bad, it's ignoring geo-political news and is probably telegraphing trouble ahead in China as well as a Global slow down, this is why I have kept my Model Portfolio short in SCO open.

In any case, look how USO is diverging from the 1.0 Euro correlation

FXE/Euro in red, USO green, it's actually going the opposite direction. My earlier stop recd' of $36.90 should be moved down. Really a trailing stop should be in use right now for short term traders. If you need ideas for your trading style, just email me, but I would probably move the stop to $36.62 as of now unless using a trailing stop.

AMZN Update

Yesterday I posted this article about AMZN, "Why We Don't Chase" , today continues the example .

 Here's the daily chart of AMZN, note how weak the bounce has been in the market, where a week ago the market would double the Euro pip/Dow Correlation, now it's lagging even the 1.0 correlation, a shift in the tone of the market, it's the little things that make a difference and that give away hints. In any case, AMZN popped a head fake above resistance, this is excellent for our purposes of shorting the stock, but it is also the reason that I don't like to short the first break of important support as we almost always see volatility around the area after. Yesterday also formed a hammer candlestick, which is a reversal candle, it carries no implications of strength or length, just that the current down trend was going to reverse the next day which it did, again this doesn't mean anything more then a 1 day reversal from the candlestick perspective.


 We have reached our first target area and there's a second at the gap in white, making AMZN another candidate for a staggered entry.

 Since the top, the Trend Channel has held the entire downtrend without a single false stop out, the current daily close stop is at $194.00

 Our custom crossover screen used to prevent false whipsaw crossover signals worked excellent holding AMZN long for as long as possible and then giving all 3 signals for a short.

 On an intraday 1 min 3C chart, it looks like there could be a little more upside intraday.

 The 2 min chart is in perfect confirmation of the trend.

 The 5 min chart is showing the weakness with a slight leading negative divergence in place today.

 Longer term you can see all off the accumulation areas in white and distribution in red, the yellow boxes are head fake moves that almost always precede a reversal, there was even a small one for an upside reversal in November. This hart looks horrible and confirms AMZN rolling over from a top.

The worst though is the daily AMZN chart with a HUGE leading negative divergence. If you have a high risk tolerance like I do, you could short AMZN almost anywhere and still come out ahead. This is one of the worst daily 3C charts I've seen on an individual stock.

So make sure you take a look at AMZN and I would use any strength to initiate or add to the position. As I mentioned, a staggered entry makes sense here, at least you have some coverage in case things go south, but you leave some room to add at better prices as well. Remember, as long as this is your risk management plan BEFORE you enter the trade, you are not using the losing strategy of dollar cost averaging.

Risk/Credit Assets Update

For our newer members we follow Credit because credit leads the market and we follow risk assets because they should rally with the market in a risk on environment, for example, commodities should rally with the market if there's a true risk on environment, when equities rally and credit fails to confirm and risk assets fail to confirm, we have a dislocation between credit/risk assets and the market and dislocations are a good spot to short the market as it is something akin to poor breadth or a poor A/D line in a market rally. The recent market bounce has been dislocated from risk/credit. Here's an intraday update with some longer term charts showing dislocations and how the market moves quickly to close those dislocations.

 I don't know why, but yesterday I had a gut feeling commodities would underperform the Euro/market and here are commodities vs the SPX (green) intraday and they have underperformed and in fact continued to sell off even with a modest bounce in the market intraday.

 Longer term we can see commodities were positively dislocated from the s&P back before the October rally started, hinting at the rally, since then they have been negatively dislocated which have led to some sharp declines in stocks. Right now they are at their worst, a sign of trouble in China for sure, they are literally heading straight down and very dislocated with the SPX, showing there's no true risk on rally here which means the SPX should catch up on the downside shortly.

 Intraday High Yield Credit didn't participate in the opening po, but is seeing some modest buying as the market gains a little ground, note that credit moved up first while the SPX was still falling this a.m.

Longer term, there's a severe dislocation between High Yield and the SPX, you can see how the market responded to the last dislocation, it should make a similar move down shortly and n fact you can see it has already started as the SPX has rolled over.


 Yields act like a magnet for equities, this morning they continue selling off, despite the market catching a little bid.

 Long term rates were positively dislocated in white and lead the market higher, now they are severely negatively dislocated.

 The FX correlation is in full force as the market follows the Euro nearly tick for tick intraday...

 Longer term though, the SPX is severely dislocated from the correlation with the Euro, past dislocations have seen sharp moves down, but they were nowhere as big as this one.

 High Yield Corporate Credit is pretty much in line intraday, there's a slight negative dislocation, there certainly isn't any sign of risk appetite in Credit.

Finally yesterday we saw strong financial momentum vs the market, today that has fallen off a bit.

All in all, this is what I expected to see and the move remains totally Euro based because of the breach of $1.30 and the subsequent volatility associated with that breach.