Friday, September 21, 2012

EOD Closing market update

I've had a couple of questions as to what these late day divergences look like and where they are, so I'll show you, remember they are inconsistent which perhaps furthers my feeling that this market may not be hot or cold, but very specific sectors that perform well, others that fall apart and if the assumptions is correct and it is correct based on the logic I'm using, then there could be a lot of rotation between them as there would be very specific triggers that cause the rotation-inflation being one of the main ones.

In ant case, it's just a working theory for now, but subtle evidence is popping up here and there, like this...
 The DIA is NOT part of this positive late day, minor timeframe divergence, in fact its the opposite as it leads lower in a negative divergence and just below yesterday's closing, which tends to confirm what I thought yesterday, that we were being set up yesterday and through today for an options expiration related pin. However the DIA could be kept in place without the leading negative divergence unless they are trying to cause more pain in lowering it.

 ES isn't showing the positive, but it is not as negative as earlier, it's more consolidation in 3C.

 This is a stretch to call this a positive divergence in the IWM, but it is the longest 3C upswing pretty much all day. That would be what you call a VERY relative divergence if at all.


 NQ/NASDAQ Futures first alerted me, they don't tend to carry over to the next day or new week, so either they move or they don't.

 The QQQ sort of confirms the NQ divergence on this 2 min chart

And SPY 2 min shows something similar, but doesn't confirm ES.


Risk Asset Layout

Again I hate to keep putting an up front disclaimer on all charts, but it's just reality, it doesn't mean the information isn't solid, it just means there are a lot of moving parts today that could have an influence one way or the other or perhaps no meaningful influence.

When I see a chart like AAPL fall apart that bad, that quick and start to meet the expectations that were laid out back when we first saw the accumulation and knew it was going higher, that' hard to ignore.

 Commodities may very well be part of this as I had to recapture this chart that was in line and then 5 mins later commods were stronger than the SPX.

 Yields are not looking good for the market on the day, there is a little momentum toward the end of day to the upside which may be related to my last post.

 The $AUD also isn't looking good overall recently, since QE3.

 The Euro also has lost momentum vs the SPX as it disconnects from the relationship since QE3.

 Finally High Yield Corp. Credit is making a move lower and it come the day after the roll, it seems like longs in CDS decided to take their $ and call it a day.

 High Yield Junk Credit is also finally making that move lower and well out of sync with the SPX.

 Sector rotation for anyone interested for today, the obvious theme has been defensive sectors and Tech leaking off with AAPL.

 Energy over the course of several days is disconnected, but as mentioned yesterday as the USO short was covered, there's some momentum there and you can see it today at the green arrow.

 Financials are not acting well, they certainly aren't leading.

Tech and specifically the notch down at the time AAPL topped earlier.


End of day ramp?

This may or may not be a significant event, I suspect it has more to do with sentiment over a weekend as people tend to remember the last thing they see.

There are enough signals, not consistent through all the averages and not very long timeframes, by also in some futures that looks like there could be a push from here, again right now it doesn't loom to be anything serious, but in case you have any specific plans with options or day trades.

AAPL

Just to show the trend is an important part of the information, I'll include that. This is all information as of the post QE3 announcement except the positive divergence e identified before the new phone was unveiled.

 1 min trend

 1 min intraday, you won't see ANY positive divergences in AAPL today

 2 min trend

 2 min intraday

 3 min trend

 3 min intraday


 This is the important chart as the deterioration of the 5 min has been the signal I've been looking for since the positive divergence on the 11-13th. The 5 min trend since the positive divergence and before the IP-5.

5 min intraday.

I'm not sure if they are looking for a pin at $700 ish, the information after the pin will be crucial, but this is not good underlying action in AAPL today

Market Update- DIA, IWM & QQQ

There's a lot I still want to get to, AAPL, Risk Asset Layout, several stocks and industry groups and hopefully future and Currencies. AAPL is falling apart quickly, I'm not referring to price.

A quick look at the majors...
 DIA 1 min close up intraday note the series of tweaks that have kept the DIA right along the area of yesterday's close (seen as a thin light blue line). Again it looks like an op-ex peg.

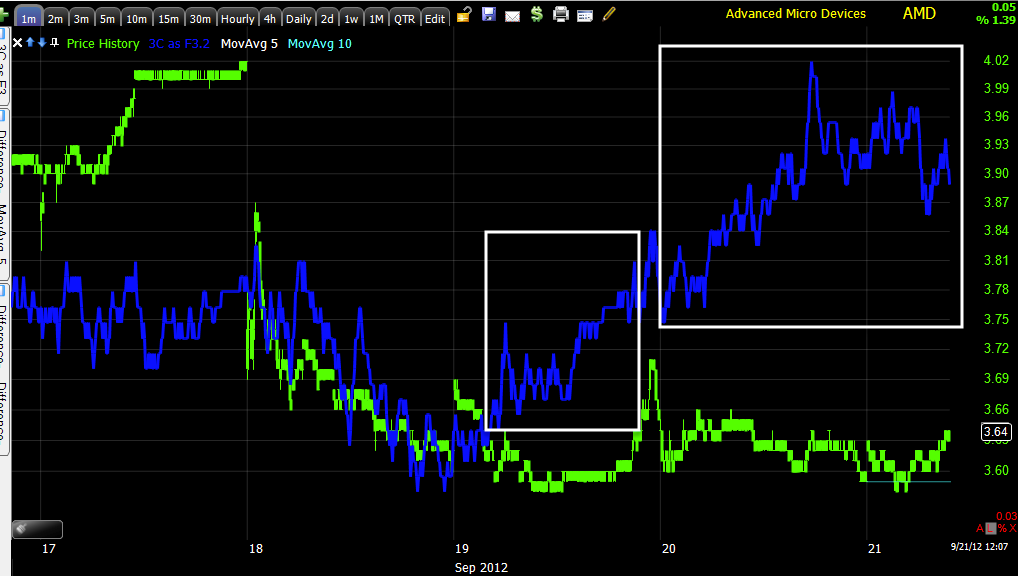
 DIA 1 min trend for the last couple of days, there's a recurrent theme among the averages, Sept 17th -18th accumulation, in to Sept 19th distribution at the highs. The 1 min chart is in a leading negative divergence on the trend view and this is all post QE3 so it's all new data.

 2 min DIa from Wed. negative divergence at the close to what in effect is just in line movement yesterday and part of today, other than the neg. divergence late on the 19th, the current leading negative are the only 2 that stand out. Remember we don't want to torture the chart to find a signal, either it is obvious or not.

 DIA 3 min from QE3 shows the trend I mentioned among the averages, accumulation on the 17th, distribution late yesterday (19th) and this chart shows a clear leading negative divergence.

5 min distribution on 19th and in line, no significant divergences here although  recently it's starting to lead a bit negative.

 IWM 2 min shows the positive on 17/18th and is basically in line since, no divergence stands out.

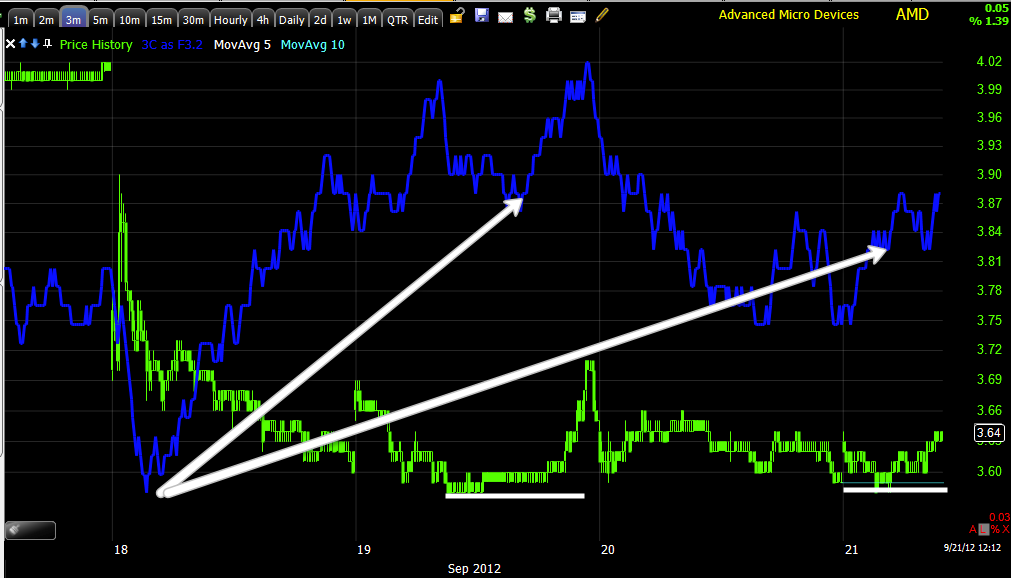
 3 min from the 13th-QE3 with that same trend of accumulation on 17/18th, distribution Thursday afternoon and currently 3C is in a leading negative position.


 IWM 5 min shows the same trend mentioned on the 17th, then in to the 19th, in line most of yesterday and some subtle weakness here.

 Divergences can accrue on longer term timeframes, what doesn't appear obvious on a 1 min chart or 2, 3 min chart can accrue as the divergences take on a trend that you might not otherwise notice, especially if the underlying action is very secretive, meaning very quiet, remember there are a whole class of HFTs that do nothing but hunt for "Icebergs", big institutional orders being filled and then they front run them costing the institution a lot of money, sort of like when day traders use to try to scalp in front of a market maker, but much faster. In any case this 10 min leading negative is interesting when looking at the QQQ


 QQQ 1 min, we can find divergences, but overall, this is in line the last 2 days.

 2 min negative in to Thursday's close and a series of slight tweaks today keeping the Q's very close to the close yesterday.

 3 min QQQ , the same trend mentioned at the start of the post is evident here, 17th accumulation, 19th distribution, yesterday largely in line, today a leading negative position.

 5 min chart with the exact same as above

 QQQ 5 min close up, note small divergences keeping Q's close to yesterday's close, yesterday I thought an op-ex pin would be the theme and many traders are already closing or have closed out their option positions today.

Remember the IWM 10 min, take a look at the QQQ 10 min.

AAPL next

Market Update-SPY

The SPY posed an interesting question yesterday initially, later in the day I figured I might have a reason for an out of place divergence, but one that would be very influential in analysis. Today the idea I had about it seems to be on its way to being confirmed.

The other averages for the most part are still looking very much like a pin is in effect, but there's also deterioration and I'll show you that next.

There's also deterioration in AAPL, although I suspect it will close somewhere in the area on an options pin, I need to look at the chain.

Also the Risk Asset Layout is seeing deterioration today as well. There are  lot of things in motion with quadruple witching/S&P Index rebalancing and all of the derivative rebalancing that is associated, so lots of moving parts so everything has to be put in its context, but all in all there seems to be some good data.

Lets tale a look at the SPY and the question of the 15 min chart from the open yesterday.


 Since yesterday afternoon's intraday high, 1 min 3C has been negatively divergent. Currently on an intraday basis there's a relative positive divergence here (this is the weakest divergence) and to me suggests that the SPY is likely being modestly tweaked here and there to keep it within a range for an options expiration pin.

 The 2 min chart saw a negative divergence on the 19th as prices fell, the gap was filled, but by that time the 2 min chart was already negative and that was the top. The chart now is in leading negative position, a new low for 3C in the area with a slight relative positive divergence which is the same as the 1 min chart above.

 3 min chart also negative at the 19th, price down on the 20th, the same negative divergence at yesterday's highs and gap fill with a new leading negative divergence today like the 2 min chart, also a small relative positive intraday like the 1 and 2 min charts.

 Here's where the initial question was yesterday and pretty important too on this timeframe. The afternoon highs on the 19th were negative, price fell on the 20th and immediately created what looked like a strong 15 min positive divergence on the open, that would suggest there had been strong accumulation of the gap down, however I later posted (which was just common sense) that the 15 min chart between the 4 pm close of the 19th and the 10 am lows of the 20th had absolutely no time to move to any position that wouldn't have shown a positive divergence, In fact if you look at 3C on that morning, it had only 4 bars to move and it only can move a fixed amount per bar, each of the 4 bars moved down before the chart simply followed price. The divergence on the 18th was real, it did have the time to form and price did respond to it.

 I haven't been looking at much data pre-QE3 announcement as I want to see the specific reaction to the QE3 announcement, although it very well may be valid to include data before the announcement as QE3 very well could have been discounted and as such the data would be not only relevant, but very important. In that context, the question of the 15 min chart is easy to answer, it's leading negative.

However, staying with the post QE3 data, there's something interesting on the 15 min chart as it has had time to move today. If you draw an imaginary line from price point A to price point B you get an upward sloping trend line, however if you look at 3C it is below point 3C at point A yesterday, in fact for simple trend confirmation with no bullish or bearish bias, 3C would be where the first orange arrow is. if there were positive underlying action, then it might even be higher like the second orange arrow, perhaps leading to a new high on the price pullback, instead it's actually leading to a lower low as price is higher, the definition of a negative divergence.

I'll keep an eye out for development, I want to bring you the rest of the market and Risk Assets.

AMD Charts

I'm going to add a speculative position of about 5% to the equity model portfolio long holding for AMD. This way there's no pressure, no expiration dates and if this wants to become something bigger, there's nothing stopping me from letting it become what it wants. There's also plenty of room to add if that looks like something I might want to do.


 AMD lost ground from the 19th' late day run, but held up well on a relative basis vs the market on the 20th. You may recall FB had an initial first run in August and some of you made money with leverage, but from the first sign of that initial small run in FB, it seemed very likely FB would go on to build a larger base, that appears to be what's happening in AMD, although I'm not very confident that the base will be anywhere near as large a what developed in FB.


 The 1 min chart looked very strong on the 19th, it has only added much more in a leading positive trend in the tell-tale flat price area.

 The 2 min chart shows what looks to be apparent accumulation at the white trend line.

 The 3 min chart is also leading positive (thus far good migration through the timeframes) and again the support area at $3.58 seems key so far. If the support zone goes on for too long and becomes too obvious, a shakeout below it becomes increasingly likely.

 The 15 min chat has developed quite quickly as it fell apart quickly as well, but a nice leading positive there as well.

Now even the 30 min chart is picking up on the action in the timeframes that are below.

I'm not going to post it now, but there is a chance that there might be something even larger developing on the 4 hour chart, again right now I can't say that it has caught up and is relevant, but I'll be keeping an eye on it.