Thursday, August 1, 2013

Credit, Credit, Credit

I already mentioned today how credit has been the key element missing from the equation and I'm sure you recall me saying that in my view, credit was the most important asset right now, specifically HYG as it is used to support the market. Yesterday I saw a little break in credit, today I saw a nasty break in credit, but for those wondering if this is smart money moving out en-masse, they already did that.

Let me show you..


 This 60 min chart of HYG vs the SPX (green) shows when credit moved out of the market back in May, credit hasn't traded at that level since then, this in itself is one of the largest dislocations I've ever seen in credit vs stocks and fits with the amplitude of some of the very nasty indications in the market.


When we look at HYG 1 min chart like this vs the SPX, we are zooming in, it doesn't give you the sense of how dislocated credit actually already is. However, as an arbitrage asset, it has been used to help move the market along, smart money left the building, I know I already posted this BOFA chart, but here it is again, Institutional sellers vs retail buyers...

 The Pros have been moving out since about December of last year, July is particularly strong, but if Retail wants to buy, why wouldn't the pros sell short to them?

Without institutional money flowing in to the market to drive it higher, other ways have to be found, HYG, VXX & TLT are one way through arbitrage, currencies like USD/JPY which moved the market overnight and then struggled today are another...

I showed this to you earlier (USD/JPY vs ES), but here's a lazy man's way...

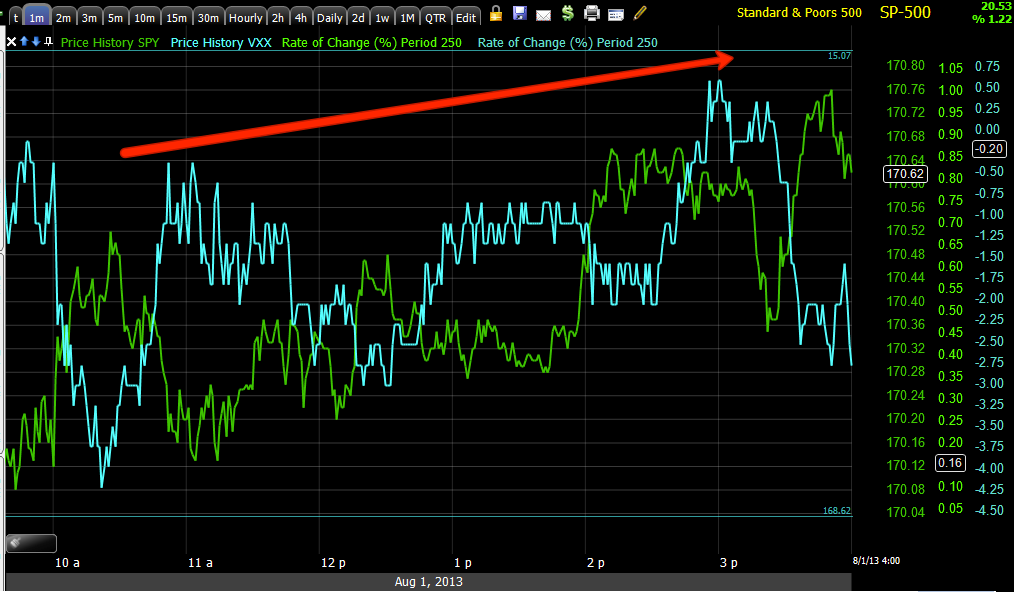
 The SPY is green, the USD is orange, note the near exact movement...

The other half of the pair is the Yen, so here's FXY with the SPY inverted...
And they move nearly perfectly together, it's this risk currency pair that was used to ramp the market overnight, not demand. If there was demand left (recall the sentiment update from retail, "I'm all in") then we'd see a huge move through $1700 on volume, but something scared credit out of the market even in its limited presence, apparently it was the F_O_M_C.


 This is a longer term view of High Yielding Junk Credit, also left the game in May.

This is HY Credit intraday, it has no willingness to follow the SPX higher at all.

I have to get my charts to align from the start of a new day, but until I can, this is a good way to show what HYG, Investment Grade and HY Credit did today vs. ES.

Investment Grade did the best, HYG, the most liquid, did the worst and this is really a first for quite some time, probably since May.

While we are looking at longer term indications and talking about sentiment, look at pro sentiment vs the SPX...
Much smaller divergences have sent the market down before, like the start of the divergence in March alone, this is huge and like the pros trading credit, FCT hasn't traded back toward the May area either.

I know I already pointed out the VIX Futures which are a sign traders are reaching for protection as they are bid up, these typically trade almost exactly opposite the SPX in green, not today though and I think this is one of the few areas in the market where you can see real supply/demand dynamics other than a short squeeze. Traders were worried today (not retail) and grabbing protection.

As far as a trade that I think may be coming up very soon, maybe tomorrow, Transports. I know what you must be thinking, "Short transports?", but give me a second.

 I drew this red trendline in a few weeks ago, I haven't touched it and the reason was, I was looking for a move above that trendline that could create a bull trap, just moving above doesn't make a bull trap, but...

 When the 4 hour chart looks this bad, you have a pretty good idea that any strong price move is going to see distribution and thus create a bull trap.

This is IYT intraday, there was early confirmation and then... So I'll be looking at IYT very closely tomorrow as it looks like it's in a near perfect area.

Really though, I'd just be filling up white space here to tell you there was anything more significant about today than the action in credit, I really can't overstate how important it is as it takes the legs right out from under the market and implies a great deal of fear even in the limited size of the current positions.

A Few Stocks Setting Up

Each of these are different types of trades, they are at different levels, but they all share one thing and that is that they are sitting or really, set up.

Some of these have been market bellwethers, some blue chips, momentum stocks etc. There are a lot more of these out there than you'd think.

GOOG
 1 min intraday today looked horrible.

2 min

5 min... GOOG is setting up as migration of the divergence continues.

PCLN
 There was no strength in PCLN's intraday chart today, although I'd think it would try to make it to the gap in yellow.

 PCLN intraday close-up

PCLN 3 min accumulation likely to fill the gap is seeing some ugly signals a lot earlier than I'd expect.

GS
 I mentioned how a head fake move in a rounding top might look and described it as a "Chimney" like one on an igloo, GS is a great example. To Understand why the head fake move is important, there are two links on the members' site that takes you through recognizing, confirming them and using them to your advantage as well as why they exist.


GS 2 min intraday with EOD distribution in to a mini head fake rounding top, the market is fractal, we see these patterns on all timeframes.

 GS 5 min with a nearly complete cycle from accumulation, to mark-up to distribution and next is decline.

There's an intraday high about $1 away, that's an area I'd think GS would gun for if it could, it would likely see stronger distribution in to a move like that making it a better entry for a short position.

The 15 min chart is pretty much beyond repair at this point.

The 2 hour chart is beyond repair in my view and makes GS an attractive short, strategically GS is set, as far as I'm concerned it's just about the tactical entry.

XLF/Financials
 I mentioned XLF several times as having a resistance zone very close, a head fake move above that makes this a much better looking position, again checkout the articles, "Understanding the Head-Fake Move"

AMZN
 This is one we were very patient with because the range was so obvious, we waited for AMZN to break above the range, since it has, the 2 hour chart has shown strong, really incredible distribution making AMZN VERY attractive, even here, but we're always looking for the best tactical positioning.

XOM
This is already (along with many of the others) a position that is open as a longer term core short, Again, the breakout above resistance sets up easy institutional distribution and it's very clear making this a beautiful candidate at the right area.

VXX / UVXY

The post on Tuesday which was forward looking, "Here's what I expect to happen to VXX and this is what would confirm the position" is how I like to usually feature a position, you know what we are looking for, you can monitor it and apply your own methodologies to it as well.

I like these positions (UVXY /VXX) a lot as they have done what was expected, they held up much better than they should have today.

The only thing that would keep me on the sidelines is Op-Ex Friday (even the weeklies get pinned now).

I also mentioned the "XLF" scenario, which is one other reason I'd be inclined to wait, especially if I were going to go with leverage/options.

If not, then a VXX long position would have less risk in this situation for me, but in addition to setting a stop, I'd also set a time limit on these, if it doesn't move in "X" days, time to scale out, but we'll get in to that more later.

The bottom line is the things posted Tuesday that we expected to happen, have happened, I don't want to chase trades, I want them to come to me.

I don't want to take a trade because of the probability of a move, I want to take a trade because it is high probability, low risk and has a good risk:reward potential. There's a difference between probabilities and high probability trades.

Market Strength Follow Up

The market is stalled again, I mentioned in the last post that a move above the psychological level of $1700 would normally be more than enough to create follow through, but in this case you have to consider who is buying and who is selling and we've seen that from Bloomberg, although 3C has shown us that long before Bloomberg published it, Institutional money are huge net sellers, retail are huge net buyers.

The retail sentiment update from today was as follows (Thanks again Sam)...

VERY BULLISH SENTIMENT

Hi Brandt,

I think this tweet says it all:

"Don't have much cash on books (nearly fully invested long), but with what's left, if gains hold up, will sprinkle some more in today"

Moving forward from there, you can see there's no steam in the market, but the engine is exactly as I suspected, the USD/JPY pair. I'm not sure the pair will hold which leaves HYG and it just took another drop lower.

 The red and green candlesticks are the USD/JPY pair, that means $USD long and Japanese Yen short and the pair moves higher. 

In Purple we see ES (S&P E-mini futures). This is an intraday look, you can see the timescale at the bottom. Note that the market (ES) doesn't make ANY moves higher without the USD/JPY PULLING it higher (white arrow).

The obvious answer would be the USD/JPY works ES overnight to get to that level I showed in XLF, but numerous other assets as it benefits Wall Street to have a bear trap in place, if there are even enough bulls (retail) with cash to buy.

Looking at the USD/JPY pair, it's hard to say so I turned to the individual $USD and JPY single currency futures.

The $USD 1 min fell, this is why the pair froze as well as the market, but as you can see since 2 p.m. there's been an effort to move the $USD higher and the pair and market with it.

The 5 min $USD, a more serious chart doesn't look very good either, if the USD falls, so does the pair most likely and the market, unless they can really juice something else like HYG.

This is the second half of the equation, the Japanese Yen, for the USD/JPY to rise and the market to follow, the JPY has to fall, but as you can see, it's starting to build a positive divergence for a likely turn around, taken with USD charts, probably not good news for the pair or the market.

 This is the 5 min Yen chart, it also has a leading positive divergence so it looks like this pair is going to have a lot of trouble moving higher, which means the market will as well as it is this pair that has been the engine to drive the market higher, not real demand.

 This is HYG since the last update and it has broken lower through another layer of intraday support.

This is the larger picture, HYG has been used to support the market, but today things started changing in a meaningful way.

Asset Arbitrage, Headline Scanning Algos...

I think with the SPX having taken out the psychological magnet of $1700, but showing no follow through at all, they'll need to resort to some kind of arbitrage, FX manipulation, etc.

For instance...
 XLF is one group I showed you that I said I'd rather wait for a break above the recent high, that is the most obvious play in any reversal situation, setting a bull or bear trap, however, other than the overnight levitation, this market has had a very hard time adding anything intraday.

Look at the TICK chart, there's barely anything over 600, meaning 600 more NYSE stocks moving up than the median of dead even which is insanely LOW, there's not only little or no follow through in price, individual stocks themselves are stalled.

The only way I can see this being resolved other than an overnight ramp is an arbitrage situation or some headline scanning algo and a WSJ rumor on one of their blogs or from Hilsenrath.

The SPY Arbitrage is negative because HYG has been knocked down so hard, VXX and TLT are holding up as the market tries to move.

I think there's real demand for protection in TLT and VIX Futures so the only one I think they can use to be effective to get over the hump would be HYG.

We'll see if they can pull it off, but that line in the sand is why I think I should be running scans tonight.

Protection is Bid

I just got through posting TLT, Treasuries. In the interim, the SPY and QQQ made a small breakout from some intraday ascending triangles, the Dow made a move, but not a breakout and the IWM is still in a near perfect symmetrical triangle.

The normal correlation would be VXX or VIX Futures and TLT would move exactly opposite the SPX and move lower, however it seems there's demand for both the protection of VIX futures as evidenced by the futures not moving lower and the traditional "Flight to Safety" of Treasuries.

 This is the SPY in red intraday with a small breakout from an ascending (bullish) continuation triangle and VXX, VIX short term futures which are not moving to the downside, apparently protection is being bid in one of the few displays of actual supply and demand in the market.

This is a 1 min chart of the actual VIX Futures, also not moving any lower as they normally would with a market move higher.

TLT is also holding up and not moving lower.

TLT Update

If you have interest in TLT as a long term long position as I do, I think right now it's showing a very good area to consider an entry, risk is pretty low as you can put a stop even a few percent below recent lows and with even marginal risk management still have a position that represents barely 1 or 2% portfolio risk.


TLT-20+ year bond fund.... From long charts to short...
 TLT 4 hour

TLT 30 min

TLT 5 min

Intraday TLT 2 min

Intraday TLT 1 min

ZB-30 Year US Treasury Bond Futures... Long to short.

4 hour leading positive.

5 min leading positive intraday

1 min leading positive intraday.

Market Update: Canceling Dinner Plans

I think over the last few weeks I've made it clear just how important Credit is right now, especially the VERY large and liquid HYG (High Yield Corp. Credit) which algo's use in an arbitrage scheme, "If credit, the smartest money in the room, is up, then stocks are a buy".

Credit is such an understated Leading indicator, few have any idea of how powerful it is and thus why I have been watching it so closely.

To give you an idea of what HYG has been able to do for this market (with or without the other two arbitrage assets, TLT/Treasuries and VXX/ Short Term VIX futures)...
 This is a 30 min chart going back to June 21st which as I have noted several times (check the archives for June 21st) is a day we saw strong accumulation, closed some shorts and opened some longs.

In green is HYG, in red the SPY. You  can clearly see they are moving together, but this is the market following credit rather than the other way around. The break that I first noticed yesterday was much bigger today, credit wants nothing to do with stocks/risk assets here, perhaps $1700 was the job, now the job is complete they are packing up and going home.

 I noticed HYG diverge with the SPX yesterday in yellow, today right off the open credit (HYG) diverged much more significantly.

This is what I've been waiting to see.

 Intraday this is the IWM 3 min with a triangle, surprise, surprise, we are seeing them everywhere and it's no coincidence, we're also seeing negative activity in 3C.
 
 The 5 min chart is showing migration which is important.

The 15 min chart should speak for itself without drawings.

And the 60 min IWM chart is really what this is all about (among other charts, this is an example in the IWM of what this is all about).

This is HYG and the intraday 3C chart thus far, I'll be keeping an eye on it. I doubt HYG would see a head fake move as very few retail traders even know of it much less trade it.

IN ANY CASE, I TAKE THESE SIGNALS AND THE BREAK IN CREDIT SO SERIOUSLY, I JUST GOT OFF THE PHONE CANCELING A 2 WEEK OLD DINNER RESERVATION SO I CAN RUN SCANS OF KEY ASSETS TO CONSIDER.