Wednesday, February 23, 2011

Absolute Must Read

KC's Hoenig is got to be as truthful as it gets when you talk the Federal Reserve. Sometimes you have to wonder why, he's not making friends in banking, he's too blunt to run for office, he's just a straight shooter. This article will shed some real light on America's structural problems and it's a DO NOT MISS.

HERE'S THE ARTICLE


IN THIS PIECE YOU'LL LEARN MORE ABOUT THE TRUTH OF OUR ECONOMY THEN 1000 HOURS OF CNBS  

Trade Alert

Here's one worth keeping an eye on. UBA (short) has broken down out of a large triangle which typically acts as a top. The volume in this stock is light enough that it may just slip by the HFT/Black-box pattern manipulators. Take a look. If you are interested, shoot me an email for more details. I like the trade right here.

Market Update

 we have a small H&S top and a negative divergence so watch that neckline for those of you trading this.

The 5 min chart suggests we have more upside to go, but it doesn't need to all come in a day.

AAPL -The Place to look when you want to move markets

Today AAPL quite simply is outperforming the market. Why? Not because of that video of Steve Jobs getting into a car-that didn't help. How about this, AAPL's nearly 20% weighting on the NASDAQ 100 (QQQQ). That's right, AAPL alone is worth the same as 50 other NASDAQ 100 stocks combined and has the heaviest weighting on the index by a WIDE margin. So you want the Q's to move, you don't need to buy 100 stocks, you can buy 1 and that's AAPL.

Lets look at the evidence-keep in mind how I've been saying the Q's or NASDAQ 100 are likely to lead any bounce.

 AAPL falls on the Jobs video and with the market yesterday.

Yesterday at 1 pm 3C starts picking up accumulation in the market, look when accumulation started in AAPL yesterday afternoon. Coincidence? I doubt it. So you want a little advance notice of where the market is going-just follow AAPL.

SLV Update

IS THE BATTLE LOST FOR BLYTHE MASTERS AND JPM?

That's the question when looking at Silver.

 Here's the daily on SLV , note the very parabolic move in SLV most of which occurred or at least started as the US markets were closed Monday. Right now we have two daily candles that are not impressive.

 The hourly chart shows a large zone of accumulation before the run up, on the hourly the run is still confirmed, but....

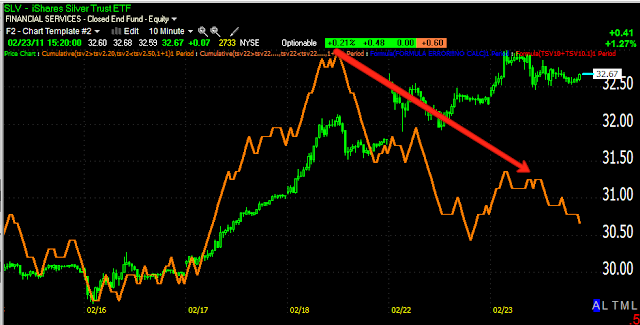
 The 15 min is already showing negative divergences. It would not be uncommon for a pullback after a run like this, however, when talking the battle of silver, a pullback can quickly turn into a head fake false breakout as we have seen several times in the past.

 The 10 min chart is also showing a very negative divergence so I'd expect at minimum a consolidation, more likely a pullback and there's the off chance that SLV falls below the breakout level, which would create a significant sell-off.

The 5 min chart, also negative.

This is a trade worth watching. If you are inclined to be long silver, a pullback would set up a great buying opportunity. If this goes the other way and turns into a bull trap, the resulting snowball effect sell-off will bring silver down hard and fast. Waiting and watching are the only thing we can do right now. However, be aware, maybe set some alerts for price breaks.

USO Update

 Here at the red spike in volume (white arrow) you can see where short term traders had their stops hit en masse as this was a very obvious support zone. This is why in the risk management link and article I have linked for you at the top of the site, I encourage you to keep your stops AWAY from obvious patterns, support, resistance. It's too tempting of a target for HFT traders who are making money on the spread and volume rebates. Remember, they see the entire book of orders, not just the best bid or ask and they see orders you can't even in Total View. The yellow box shows price held up at the first of the two daily stops or support zones I marked out in the last USO update. It looks like there will be some volatility around this area, I DOUBT this will hold as the final pullback.

 The 1 min chart shows the negative divergence and the reversal off the afternoon highs, and now is showing a positive divergence at the first daily support zone (the top red trendline). REMEMBER, support and resistance are created by psychology and as such are NEVER to be viewed as an ABSOLUTE, they are zones. Imagine if you bought at the top support zone, price went up and then fell. You might say to yourself, we'll I'll get out if it reaches my price, but it doesn't quite reach it, you get a little scared because of news events and you sell. You haven't sold at an exact number, or your exact entry, but you did sell in the zone. All support and resistance is created in a similar manner, by human emotion.

 The 5 min chart suggests there's more downside

The hourly chart is stable and looks good.

Market Update

Still looking at the Q's, since the last update, that break of support was a head fake which was accumulated as I thought it may be.


Here's the support I mentioned in the last update and the volume around it, in the red box is the head fake false breakdown which gives the upside a boost as shorts that jump in on a break of support are forced to cover when resistance (former support) is taken out on the upside as they are at a loss.

 Here's the 1 min QQQQ 3c chart showing a pullback early in the bounce, but....

The more important 5 min chart seems to suggest there's more upside to go and the pullback was exactly that. So now we watch for a series of higher highs/higher lows.

The DIA 1 min remains in line to slightly negative but the 5 min chart is showing a relative positive divergence between 12 -1 pm yesterday and the same today, suggesting there has been accumulation of the move down today. It's not as strong as the Q's reading, but it's there.

The SPY 1 minute is in line with a bias towards positive leading and the 5 min is strictly in line. If this keeps up, the 5 min chart should start to show positive divergences.

The Tick Index has let up significantly since the 1 pm-ish lows it put in and has been trending higher with occasional disruptions but nothing approaching the negative -1250 reading saw earlier. It seems that retail has capitulated in a sense on the short term or met margin calls. This leads to a loss of downside momentum and an opening for the bulls to carry the averages higher.

USO Potential Pullback Targets

This is got to be the hardest equity to try to predict right now as news which is not discounted and can not be discounted, unless smart money is getting face time with the likes of Gadhafi who's probably preoccupied with more important things then telling them which rig he plans on bombing next, is so fluid from moment to moment. In the bigger picture though here's how it looked, oil/USO was headed for a correction, then Egypt errupted, Oil did not discount to the upside, a strange event, however there was a reason in my view, smart money knows all too well that the one thing that will drive a market nuts is uncertainty and it will swing way too far. So I believe and as I expressed this, 3C confirmed, that institutional traders were buying oil on the dip, they established a position because they know it's headed higher and they were in the middle of distributing when Egypt broke. That's a big ship to turn and took some time. Now it seems they are in place and oil did exactly what we expected and now my oil trader with options just had his second best trading day in a year (yesterday being the first) on a position only 2 market days old.

It looks like USO will pullback a bit, but that may be halted at any moment on fundamental developments that can't be readily known.

Here are some possible target ares:

 First the daily support zones which fit well with some other indications.

 The yellow 10 bar moving average is an obvious first strike, a deeper correction would be to the blue 22-bar-THIS IS AN HOURLY CHART!

The Trend Chanel will continue to move up on this hourly chart, it works very well and is figured out by the average recent volatility of the equity in question, it's not like an envelope channel or Bollinger Bands, it's much more stock specific. I'd say a pullback with a rising T.C would meet somewhere in the red box which is close to the more important support zone on the daily.

Remember though to watch for news on oil, especially any attacks or supply disruptions, meetings of OPEC or even rumors.

USO Update

Sorry this is late, I'm getting  lot of emails and trying to stay on top of the market and world events.

The long term USO looks good, short term, it'll dip it is dipping. I'll look for a target zone.

 30 minute confirmation-good trend

 5 min negative divergence

1 min pulled the timing perfectly.

Market Update

The TICK Index is looking really nasty, it doesn't hit these levels very often. Probably not even once a week.

-1250! Wow. The Q's are showing some volume (green) and still showing positive divergences, the SPY is catching up and the DIA is falling behind-my guess, multinationals in the Dow are being repriced. MCD is acting worse today then yesterday.

Still thinking the Q's will lead the way. The Tick has got to let up though, no amount of institutional buying can compete with a tick at -1250. The Q's did test support a couple of times where the volume has been getting positive and just broke below which may be a head fake and may lead to the start of a move. That head fake provides the initial fuel for a move up when the shorts cover.

All in all though, this appears to be the reversal I've been talking about and feeling for the last few weeks, I think this is serious. We'll see if the channel can be approached or not, if not, then things just got out of Brian Sacks control.

QQQQ

Q's are still showing a pick up here so I'm not going to judge just yet, as yesterday the SPY is still lagging and the DIA is showing signs of a positive divergence building, this may be a head fake on the downside, we'll let the afternoon play out and monitor the divergences. Head fake is the feeling I'm getting and I think we'll see a change in the Q's first.

QQQQ 5 min. UIt appears that not too much institutional damage has been done, we may be seeing retail orders go through and being swallowed by institutional money buying on the cheap for an afternoon bounce.

Wondering Where Our Bounce IS?

I was too. Then I just saw that riots have broken out in Greece, one particular video is of a policeman on fire as protesters hurl everything they can find including Molotov Cocktails.

We've seen protests in Greece, Paris, London, Ireland and all areas of Europe before, but this i violent and in the context of broader world events, threatens to spread throughout Europe. Most older investors remember where World War 1 and 2 broke out. This is very significant and should this spread (we also saw violent protests not two weeks ago in parts of Eastern Europe, Albania I believe) through the Eurozone, contagion will take on a whole new meaning.

Preliminary Earnings Outlook/Trade PCLN

With the market so volatile, it is difficult to see the 3C moves that are out of character with the market because so many as of late have been out of character with the market's trend of relentless melt-ups, and then suddenly rocked by world events. It does seem that PCLN is seeing deeper negative divergences then the market, that could also be because there has been a higher risk on trade in PCLN and any delveraging is bound to hit the high fliers hardest.

So if we were in the typical market we've seen over the last year, I'd say something looks wrong with PCLN. The point of the exercise is not to predict earnings, but to gauge how the stock will trade after earnings and in this, we may have some useful information just by the nature of PCLN's business model.

We know that airlines are seeing thinning margins, some have resorted to their own deep discount websites choosing to forgo the classic PCLN business model. Furthermore post earnings trade is not about what the company did, it's about sentiment toward what the company will do. This is why you see companies blowout earnings and still get sold off, the expectations are that the last period was as good as it gets and they "sell the news".

In looking at the trading action of PCLN, the recent market slide has provided cover for any institutional money that wants out, who can say they are leaving because of leaked earnings or because of deleveraging of risk? Very convenient.

Looking at their business model, considering the tightening margins for travel companies, it would seem that more airlines and other travel companies will try to offset the margin squeeze by cutting out the middle man, it's either that or cut your own staff. Furthermore, destinations such as Egypt for instance are probably the last place anyone wants to go. A significant amount of destinations have all of the sudden become potential conflict zones. Add to that the American consumers forced deleveraging (many of us book vacations on credit cards)-just look at V, AXP or MA-their not exactly leading the way. And just exactly how does a PCLN make up for a margin squeeze? Offer cut rate travel deals that may not be there to offer?

Of course there's the other side of the argument, but with conditions deteriorating rapidly in the world and in economics and most probably (truthfully) in unemployment, I'm willing to bet many are willing to forgo their travel plans for now to try to build a nest egg or buffer. Stocks like DISH, TWC, TWX, CMCSA, CBS, CNK, MSG and DTV seem to show people are willing to stay closer to home.

I DON'T USUALLY PLAY EARNINGS WITHOUT A SIGNIFICANT EDGE, there are simply too many wild cards and in good trading we seek to control as many elements as we can and when presented with too many wild cards, we pass. However, if I had to make a choice, I'd say PCLN will trade lower in the days and weeks to come. Don't be surprised to see it bounce with the market or set an initial show of strength to draw in demand which is needed to distribute to. The trend however over a period of several weeks I'd say will show sentiment on the sector souring.

Here's a few charts
 Diversified Entertainment Industry

Cable TV Systems Industry

Saudi Arabia may not be next, but they're on the to do list

Facebook, it's being credited with revolutions across the middle east. Whether it deserves the credit it gets or whether it's just part of the machinery, remember the revolution in Egypt went on despite internet and Facebook outages, is a question of little consequence. However, March 20th has appeared on Facebook as the Day the revolution will hit Saudi Arabia, perhaps one of the most influential allies of the west left unmarred. The protesters have made their demands clear and if recent history is to be the judge, then we know a Monarchy as long lasting as the Saudi Monarchy fits the description of protesters ire, in a word, a "Kleptocracy". The overthrow of Saudi Arabia also happens to be the crown jewel of radical Islam's main objective. While dangers persist in the falling and fighting in each individual country, the bigger issue is what the radicals will do. Right now they need only to bide their time and concentrate on organizing. It won't be the most popular that wins, but the best organized. We see that even here in america politics. We know that they understand that as it was made clear when US troops went town to town in the initial invasion of Iraq, ready to set up provisional governments only to find that agents of Iran had already slipped into the Shiite towns and set up well functioning local governments, at first America thought this was great as it freed up resources, later not so great as it set up the logistical structure for insurgency. 

We know that the Muslim Brotherhood was joined very early in the Egyptian protests by an off-shhot of the brotherhood, Hamas. Armed Hamas militants slipped across the boarder into Egypt to link up with the MB to coordinate protests and to bring medical supplies, water and food to protesters, thus endearing them to the MB, an unknowingly to agents of Hamas. So as I have said since Mubarak fell, this is no where near the end, this is the beginning and not the new beginning that protesters imagine for themselves. In Egypt alone, the regime never changed, only Mubarak, the face of it changed and that was predetermined months before as he tried to sidestep the real regime-the military and install his son as successor. This was his undoing, the protests just provided cover for the military regime. So 6 months is not a long time, things won't change and the people will rise again most likely, but this time they'll understand who the regime is which will bring violent conflict between the military and the protesters. 

Gadhafi is already said to have bombed civilians and ordered and military officer executed who refuses to fire on civilians. The nature of the tribal factions in Libya presents a more pressing problem, one of all out civil war as there is no stable military regime, but fractured elements-Gadhafi understands this, thus he's making what seem to be insane moves, but he' preparing for what he knows is coming.

At some point when all of these countries are in transitional and weakened stages, the radicals will have their organizational structure together and will take advantage of the situation. Inflation and economics are the new tools to overthrowing dictators and they'll have learned that lesson well. Inflation brought down 2 governments and  3rd is falling this year, compare that to all of their terrorist efforts over decades-the results will not go unnoticed by the radical elements. We can already see what one government has done to Europe, just wait.

This isn't meant to be a new brief, it's meant to be a warning for some and a call to all to be ready to take the hard decisions that lie ahead for in them there will be obscene profits to be made. We've already seen them in just a weekend. 

MARKET UPDATE

For our new members,  Welcome! These are 3C chart updates in the 1 min and 5 min timeframes. The longer the timeframe the more significant the divergence. 60 min or a daily divergence would show the most significant divergences. A positive divergence is usually a sign of accumulation by smart money and other players depending on the timeframe. A white arrow is a relative positive divergence, a white box shows a more powerful leading positive divergence, the same for red, except red denotes a negative divergence or distribution. At times you will see green arrows which is confirmation of the trend, meaning the trend at the time is stable. Be sure to note the timeframe at the upper left of the chart and the day/hour at the bottom of the chart running horizontal.

We usually update the SPY (ETF for the SP-500), the DIA (ETF for the Dow 30) and the QQQQ (ETF for the NASDAQ 100). The ETFs tend to give faster and better signals as they show different volume and are an earlier expression of trader sentiment.

It's important to note that a 1 min divergence shows intraday action, but if there's enough divergence, it will transfer to a longer more meaningful chart like the 5 min, if the accumulation/distribution is strong enough, then it will go to more significant timeframes, 10 min. 15 min, 30 min and 60 min. The longer timeframes show that the equity or index is under serious accumulation or distribution at which point we start watching the 1-5 min timeframes to try to ascertain when a reversal is coming.

 DIA 1 min showing  positive divergence that started around 1 p.m. yesterday, this suggests accumulation and a bounce move. You can see thus far it has prevented follow through selling.

 The DIA 5 min chart showing  negative divergence on Friday and the same accumulation/positive divergence starting yesterday afternoon

 QQQQ 1 min again showing the positive divergence starting at the same time as the above two ETFs -around 1 p.m. yesterday afternoon-note the leading divergence in the white box which is the strongest form of divergence.

 The 5 min chart shows a negative divergence starting Thursday and Friday of last week, Tuesday when the markets opened, they fell. Now the 5 min is showing some of the spill-over positive divergence from the 1 min chart above.

 The SPY 1 min is the last to start to show  positive divergence, it got a much later start, presumably because of the weighting in financials.

The 5 min though does show that there has been  positive divergence, although not as strong as the others, building. The green arrow shows confirmation of yesterday's downtrend, so we did not expect a bounce up yesterday on intraday trade.

If you have questions, feel free to email me.

USO Update

Yesterday I received an email, "Is it to late to buy USO?". Considering the amount of accumulation it underwent as they held prices down in the face of middle east upheaval, I think the accumulated position is sufficiently large enough to support greater gains. Yesterday the rumor mill was churning about OPEC and was swiftly shot down. I believe OPEC itself isn't sure of the stability so they'll probably want a buffer in prices. Here's the USO charts. A pullback is a most welcomed event.

 hourly 3C is confirming and strong.

 The 1 minute shows a negative divergence that has already started a pullback, nothing to fret over, it's an opportunity to get a position at a better risk:reward ratio. Make sure risk management and position sizing are used as event are out of smart money's control.


Here's 1 10-bar m.a. in yellow on 1 60 minute chart, it is a likely area for a pullback. The rest of the crossover screen is in total buy mode.

Congratulations to our BDCO Buyers Yesterday

It's never easy to buy a stock that ha already gained double digits, but the important thing is the technical outlook and BDCO's was ripe yesterday for follow through buying.

Here's the 1st post


Here's the follow up


Here's today's chart, that puts any buyer at  59% gain in less then a trading day!


As Predicted, Italy Now Takes the Spotlight

Perhaps even away from Portugal. Here's a chart of Italian Credit Default Swaps-

Contagion via Italy? As I said yesterday, it's a case of hopscotch or even leap frog. I doubt anyone thought Italy would come up so soon in the cycle of contagion fears, but with Libya cutting off something like half of Italy's domestic oil consumption supply, their little cars are about to be traded in for bicycles and I'd think a car for a bike in Italy right now is going to be about an even trade. Luckily the Italians make many fine bikes.

Just waiting now for the Euro to play the anvil in a Wiley Coyote Cartoon.