Wednesday, October 22, 2014

Daily Wrap

Once again tonight, there's not too much I can add to what's already been posted today. There are a few ironies such as the market's performance yesterday as the NYSE was broken for 150 symbols from AAPL to XIV yesterday and today's performance with all major averages closing red as the NYSE was fully operational.

Last night I said the move in trannies, up +3.14% seemed to "Flame Out" as they were the worst performer today, down -2.06%.

Broadly speaking, our entry in to some shorts yesterday was worthwhile as today the market has given up just about half of the week's gains.

SPX, Dow , NDX, R2K and Transports...

Yesterday's Dominant Price Volume Relationship taken with the performance in the S&P sectors and Morningstar Groups led to the following statements in last night's Daily Wrap...

"the Dominant Price/Volume Relationship fits expectations almost perfectly with the SPX, DOW and NASDAQ all coming in at Close Up/Volume Down, the most bearish of the 4 relationships, typically resulting in a close lower the next trading day.

Also helping that sentiment was 9 of 9 S&P sectors green with Industrials leading at +1.98% and Utilities lagging at +.58%

And to seal the deal of the 238 Morningstar Industry/Sub-Industry groups, a whopping 202 closed green, all near term overbought signals typically resulting in the next trading day closing down, essentially what we are looking for."

The $USD saw its second day closing higher, now up +.55% on the week on Euro weakness, this in turn sent commodities lower including oil which suffered after the EIA report this morning, closing at an 18 month low, still there are some near term signals for a bounce.

The pullback we have been expecting, not because of 3C weakness, but base structure weakness, looks to be in the making and we should do well with the near term trades entered, we'll see how they perform on lower prices, perhaps they'll be longer than short term swing trades.

As you saw, Leading Indicators are also showing a move to the downside as well as Index futures which was apparent this morning so I think we are in a pretty good trading position and will be in a better core asset position soon.

As for today's internals, we had a Dominant Price/Volume Relationship in al 4 major averages, 18 of the Dow, 65 of the NDX 100, 900 of the R2K and 227 of the SPX of the 4 categories and this was Close Down/Volume Down which I affectionally call, "Carry on" as it has no strong next day implication like yesterday's dominant P/V theme suggesting a close lower today.

As for the S&P sectors and Morningstar groups, S&P groups were a near flip flop with 7 of 9 closing red , but Utilities, yesterday's laggard leading today at a +.62% gain and yesterday's winner, Energy being the biggest laggard today at -1.90%

As for the MS groups, another near flip-flop with only 23 of 238 closing green today, while dominant, not like yesterday with the 9 of 9 S&P and the P/V relationship so I think we are in good shape for our near term short trades, SQQQ, SPXU, SRTY, SDOW and FAZ.

As I have said all week, I expect a move to last week's lows and a broader base and then a resumption to the rally with a stronger move, that one may be worth buying, this one with such an unstable base was not worth losing the sleep over.

Have a great night and I'll see you in the morning.


Looking Good

So far everything is looking good for today and yesterday's new positions.

Leading Indicators are looking good...
 HYG is leading the SPX lower just as suspected from the negative divergences in HYG yesterday...HYG Support Giving Out

 Professional sentiment is also leading lower for the first day of 4.

Yields are also leading lower

As are commodities

You already saw the divergences in the averages and ETFs.

As well as the Index futures. We are looking good in this trade.

PUT Position Contingency Charts

This is the EXACT chart concept drawn earlier today as a potential move that would create a put/option position at a discount/low risk and excellent timing as nothing has changed about the 3C charts, it's just the head fake concept that's so predictable we were able to draw it well in advance of the trendline even being broekn, which would be the first setp...


 This is the trend line I was talking about, the uptrend from the move up of the last several days.

I actually drew this exact chart earlier today to demonstrate the possible concept that may occur, giving us a great Put Option set up or an entry in to any of the inverse ETFs.

From Market Update...
This is the exact chart showing the rounding top that often comes as an "Igloo with Chimney", the chimney being a head fake move above the intraday rounding top or a false breakout that fails, making a put entry during this move an excellent entry.

Now compare this chart which was drawn before we even had a trendline break to the one above.

 As for the Trend Channel, the 30 min Trend Channel has held the entire SPY move up and it just gave a sell/short break signal under the red trendliine.

If we use a slightly wider stop channel which held the majority of the recent downtrend and all of the recent uptrend, then it looks like this...
The stop being a close on the 60 min chart below the red trendline, almost there.

As for some of the intraday signals, intraday breadth would be one and we can see that on the NYSE TICK and my custom TICK Indicator.
 Today's TICK Trend has been one of deterioration all day from yesterday's +1500 to today's -1500 and clear downtrend channel with a recent break out of the downtrend.

My custom TICK Indicator showing the trends more clearly from down at the highs today and down as we moved below the trendline which would serve as a trigger for any such move to recent improvement in intraday breadth. Again, this doesn't effect the 3x short positions already entered, although it may be a second chance buying opportunity.

The SPX/RUT Indicator is still calling for a move lower, it's not calibrated for such a short head fake move....
Here the indicator in the bottom window calls for a base and rally in advance and as we rally it starts calling for a pullback in advance which is what we re set for.

 SPY 1 min chart, as I said, I can't say for sure if this will happen although it was a clear probability. In this case the 1 min SPY has an intraday positive that has formed after the break of the trendline which is what needed to happen first for this scenario to be possible.

As I keep saying, this has no bearing on the positions already entered, the 5 min chart is evidence of that.

Leading negative, so if anything, it's a short term head fake move we can take advantage of if it materializes, if not, we stick with what we have.

It's not just the SPY intraday 1 min...
 THE QQQ 3 MIN HAS A SMALL DIVERGENCE, AGAIN NOT A CONCERN, BUT AN OPPORTUNITY IF IT CAN FIRE.


The IWM is in line so it's not telling us anything either way.

I'd just set some price alerts, have the asset, strike and expiration keyed up, obviously I'd chose SPY or QQQ and just be ready if it's a trade you are interested in as I doubt it lasts long.


Put Option Contingency

Get ready with your symbols in the assets you might be interested in as far as entering puts. In two posts today I mentioned and then described in some detail what an intraday bounce would look like, what would trigger it and that I think it's a pretty decent possibility, depending on how visible this week's up-trend line break is, you can find the details in this post from this afternoon, Market Update.

I can't say 100% that we get the kind of move that makes a put entry worthwhile (discounted because of a bounce with confirmed market weakness), but I intended to set price alerts as I thought it was a pretty high probability. This is all within the realm of head fake moves and taking advantage of the predictability of technical traders, luckily we can use it to our advantage.

I wanted to give you an early heads up as I see some signs that this might be coming so you'll be able to set up the symbol/tickers you are interested in.

As far as the leveraged inverse ETFs entered, SQQQ, SRTY, FAZ, this doesn't effect position management for me at all, in fact if you're not a fan of options and were interested in any of these positions but didn't  want to chase them as they have started working, then this may be an opportunity for you as well, a second chance.

I'll be putting the charts together that show a probability that is growing, still not a strong probability, but based on our concepts alone it is a probability.

Market Update

I was going to put a macro market update to show the concepts on a large scale and how they work on a smaller scale as well, but I think it will take too long and I think the macro update is a post worth bookmarking and coming back to as these concepts are fractal, meaning you can use them as a long term investor, as a swing trader or as a day trader, so I'll try to get that post up separately.

As for the market update here and now, I can't make 3 or 4 days worth of information which led to today (and yesterday's) actions, but just remember it's not just the 3C charts of the averages, it's not just the concept of multiple timeframe analysis or multiple asset confirmation, it's the nature of the instability of the base leading to the last several days gains, the overall size of accumulation in to that base, Leading indicators, High Yield Credit distribution, VIX futures accumulation, our newer custom SPX/RUT Ratio and VIX term structure, the overbought condition (not in price, but market breadth/internals as overbought/oversold price means nothing) so just keep in mind it's not any one Holy Grail, it's doing the work, digging up the objective analysis, the clues and putting a composite picture/forecast together.

I obviously can't show every asset in every timeframe as well as the confirming assets for instance, for QQQ I'll look at the Q's, the 2x long and short ETFs QLD and QID and the 3x long and short ETFs TQQQ and SQQQ as well as AAPL as it has so much influence on the NASDAQ 100 and XLK/Technology as it has so much representation on the NASDAQ 100 and the leveraged Tech ETFs like TECL and TECS, all of that goes in to my decision to enter a position as well as comparing the other averages and their timeframes and confirming assets. Then, it's a matter of choosing the right asset for current conditions and expected conditions whether that be potions, a straight asset trade or a leveraged asset ETF.

So here we go...

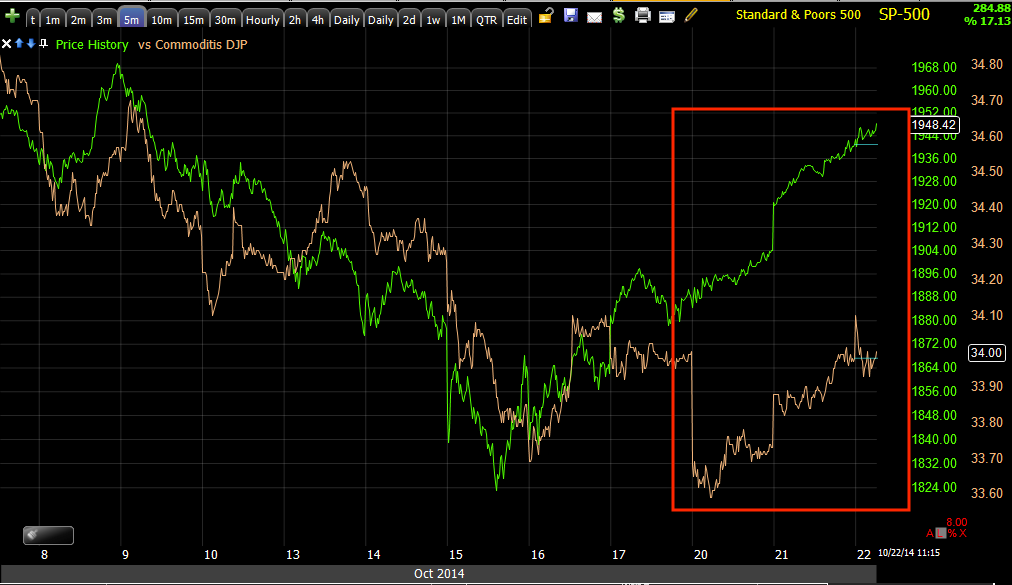
 This trendline drawn on the SPY 5 min chart of the last several days gains could be a tricky spot, perhaps even while I'm writing this as it's an obvious technical level and we know that obvious areas that draw attention of technical traders often get gamed.

This is why I mentioned the possibility of a move above the rounding top today which would set up a nice Options/Put play in to the price strength.

The thinking goes like this, we know what retail sentiment has been, the "Buy the Dip/The F_E_D has our back" sentiment is gone as we saw with the Fear/Greed Index pinned at zero (0-100 with "0" being the most bearish and 100 the most bullish). You know how big the positive divegrence in the averages is, nearly the entire month so it's my working theory that Wall St. needs t change that sentiment and get retail bullish again as you can't have everyone on the same side of the trade and make money in a zero sum game.

We know from our sources following retail sentiment that they've been looking for the SPX to break the 200 day moving average on the upside to enter shorts so they are still massively bearish and still on the wrong side of the trade for Wall St.'s liking, which is why I suspect we'll see a face-ripping rally even bigger than what we've already seen that will change sentiment among retail to bullish which is what I warned about last week before this move even started.

However, first we have a very unstable "V" shaped reversal event to deal with rather than a broader reversal process, meaning that "V" shaped base can't hold a solid rally, it's too unstable so the pullback I'm looking at now, I expect will be building out a wider "W" shaped base or a reversal process rather than the "V" shaped reversal event.


On an intraday basis (remember I captured these charts about 30 mins ago), we can see the diaganol uptrend line from the recent move up being broken and the near term support at the green arrow being broken, volume swells at the break of support (yellow arrows).

Retail chases price, they call it "confirmation", it's a dangerous game as any new retail shorts entering where volume lifted (yellow arrows) will place their Buy to Cover short stops just above the horizontal trednline. Many will lace those stops with their brokers so they are visible to the sharks on Wall St., although you can predict where the stops will be just based on technical trader's predictability and belief that support and resistance are exact levels rather than areas.

This opens up an opportunity to do the following...
Today's rounding top is not the typical reversal rounding top that looks like an "Igloo with a chimney on the right side", that chimney is the head fake move above the rounding top, a failed breakout that technical traders will chase, it's also one of our best entry points as long as we confirm distribution in to the move as it gives us a better price / entry with less risk and the head fake move which is seen about 80% of the time, tends to directly precede the reversal (in this case to the downside).

Initial new retail shorts using the break of the trendline as a trigger to enter short will place stops just above the same trendline so all that's needed is a small move above that same trendline and even a break to a new intraday high above the rounding top to get shorts to not only cover, but to get some to go long and as price comes back down, they'll be stopped out as well. 

"From a failed move comes a fast reversal".

Again, this is an ideal area to enter a put position as the premium is at a discount on the move higher and we have the proof that it is being sold in to which gives us the objective evidence to enter the put position and back down we go as the 3C charts suggest. I can't say this will happen as it's not a hugely noticeable technical feature, but the more apparent to technical traders, the more likely it is to occur.


The 3C charts...
 This is SPY 1 min with a very sharp leading negative divergence, this is more of a timing timeframe than anything at this point and it is telling us that this is decent timing to enter the short positions whether puts, short SPY or using leveraged ETFs.

 SPY 3 min shows the migration of the divergence to longer timeframes meaning it has grown in strength, more distribution.

And the SPY 5 min chart showing a relative negative divegrence first and then the stronger leading negative divegrence as it continues to see distribution near term, now leading at a new low.

Still, this base area is no joke and while I don't like the "V" shaped reversal to the upside above, a pullback (which is what I'm playing for now) would create a more stable "W" base, capable of supporting a larger move and the positive divergence for that move is already there, it started Oct. 2nd o it's sizable.

I can't say that this divergence won't dissipate as we see lower prices, I'm just not considering that as a high probability,  luckily we can check as the move unfolds.

Financials...

While XLF/Financials is the main S&P sector and it's useful, the leveraged and inverse leveraged ETFs are also very useful. While the ETFs are meant to track (typically 1-day) performance of the underlying (XLF), the volume can be very different and this is what 3C tracks, it's not just the price otherwise looking at multiple ETFs all tracking the same underlying would be useless, but volume indicates demand and lack of it so each of these ETFS is capable of giving different signals and sometimes we see that as we did with GDX/NUGT/DUSt over the summer, causing us to wait out most of that flat range that we didn't want to be involved in any way.

 FAZ-3x SHORT Financials is one of my favorite ETFs to trade. Note at the market bottom around the 15th, the inverse FAZ is showing a top as it should as it is the mirror opposite of XLF. However, this 5 min chart (which is the first or earliest timeframe in which we see intraday institutional activity) is leading positive, a lot of it today, you can probably see why I didn't chose this yesterday as it wasn't quite there and went with SQQQ (3x short QQQ) instead.

 This is a 1 min intraday chart of FAS, not to be confused with FAZ. FAS is the 3x long Financials ETF, the opposite of FAZ and using the 1 min timeframe for intraday steering divergences as well as timing divergences, we see a HUGE leading negative divegrence. While FAZ's 5 min chart is telling us that there's distribution in Financials or giving us more of a strategic view, FAS's 1 min chart is giving us a great timing indication of when the distribution turns to outright decline so both ETF's , although directly opposite  each other and on very different timeframes, actually work together to give us a larger picture view of the direction we want to trade in and the shorter term view as to when we should be looking at an actual entry.

QQQ-NASDAQ 100 ETF...
 As you know, yesterday I entered a 3x NDX/QQQ short with SQQQ, Trade Idea (Speculative Short Term 3x ETF) SQQQ Long

The 5 min QQQ chart is leading negative, remember the 5 min chart's intraday signals are the first or fastest timeframe we can observe institutional activity. We can do the same with 1-3 min charts, but more on a trend basis that intraday.

 Interestingly and this didn't exist yesterday, the 10 min QQQ chart has a leading negative divegrence in it so what I thought would hold at a 5 min negative has shown more distribution and moved to a 10 min chart which is a big deal. Also note the accumulation at the "V" bottom sending the Q's higher.

At minimum I expect the market to pullback to the base area and widen it out, there's a high probability of a head fake move to clear out stops and draw in new shorts below that base area,  who will later be squeezed to create upside momentum. As always, we confirm our forecasts as we go.

SQQQ, 3x Short QQQ is the actual long entered yesterday. Remember this ETF is the mirror opposite of the Q's so the negative divegrence at its highs is where the Q's saw a positive divegrence at their lows. Now we have a strong leading positive SQQQ divergence coupled with a strong QQQ leading negative divegrence, CONFIRMATION.

IWM...
 Here we see the IWM which is the only average that didn't take off on a "V" shaped base, but rather something a bit larger. It's also the main average that has been propelled by short squeeze activity.

Note the positive divergence at the base and the 3 min leading negative in to yesterday and even more today, this is a good timing signal for me to enter the position before it loses too much ground as we did.

UWM is a 2x long IWM ETF, it's 3 min chart is confirming IWM's with a deep leading negative divegrence.

Interestingly the TWM  (2x short IWM ETF) has a strong 10 min leading positive divegrence as mentioned earlier. I didn't see any of these yesterday so the charts are seeing negative/distribution migration to stronger timeframes which is good for our short positions in these assets.
10 min .

While I believe there's more than enough accumulation to take the market higher, it's the "V" shaped base I believed would fail soon and need to be widened out, that appears to be what's happening.

And URTY, 3x long IWM with a positive divegrence at the base and a negative divegrence now,  note this is a 15 min chart making this one of the strongest negative divergences right now.

We'll have to keep an eye on price as it moves lower, perhaps there will be no base extension and we simply move to a lower low although I'm not ready to assign that as a probability, but we are seeing timeframe I didn't expect to go negative, even on a deep pullback, going negative.

And this is why I'm in SQQQ, SRTY and FAZ long, net short the market

Trade Idea: (Swing) Long Inverse Leveraged ETFs

I already entered a full size SQQQ (3x short QQQ) yesterday. I'm looking around at the choices, mostly in the 3x inverse / bear/ short category for the SPY (SPXU), QQQ (SQQQ) , IWM (SRTY) and XLF (FAZ).

Honestly, I can't say any one is better than the others, they are all looking really good right now, but again this looks to be a shorter term pullback trade, I imagine near the lows of last week before the market puts together a stronger base and moves higher.

I've decided I'm going to split a position between FAZ long (3x short Financials) and SRTY long (3x short Russell 2000/IWM) as that gives me tech exposure (SQQQ), small cap (SRTY) and Financial (FAZ).

I think we are seeing a rounding top (in the averages ) or bottom (in the inverse ETFs), that's probably more than half way done. Keep in mind possible head fake moves or stop runs before an actual reversal, if we get some of those and I'll set price alerts, then I may enter some puts as well in the major averages, but only if I get that discount from a pop above today's intraday highs (for the inverse ETFs it would be a drop below today's intraday lows).

I'll get some charts up next.

Market Update

I know it doesn't feel like much is going on right now, but it is. In fact I may add to the SQQQ (3x short QQQ) long trading position, or rather add a different inverse ETF as I opened that as a full size position yesterday.

If you throw a ball up in the air and are able to watch is slow motion, there's a point at which there's de-acceleration, a slight hang time and drop, kind of like a rounding top, less like the sharp "V" reversal events like we saw at the start of this last run up.

Some of the signs and signals are the same ones that told us we were moving higher last week when I was trying to anchor expectations and warn that this would be a sharp rally on the upside, I did that while we were in some of the darkest market days recently because it's easier to accept at that point then it is once you get in to the tick of things. Like they say, "Every boxer has a fight plan until the first punch is thrown".

In any case, some of the assets and indications that are giving us warning, other than the SPX/RUT Ratio and VIX Term Structure which I've posted so many times in the past day or so, I think you have it etched in to your memory, include the following...

There's some VIX Futures and spot VIX relative strength vs the normal market correlation, they look like they're being bid up vs. where they'd normally be vs the SPX. HYG is also slightly underperforming, but we'll get to both assets in more detail in a moment.

Professional Sentiment is falling off after having been right in line with prices...
 Pro sentiment vs SPX (green), this has been perfectly in line all week until today

Yields which tend to pull prices (SPX green) toward them, have been lagging.

Also commodities which have recently been acting as a risk asset are lagging badly.

 You may recall that I've posted Transports outperformance of Industrials every night over the last 4 days, in last night's Daily Wrap I said their move up yesterday looked like a "Flame Out" and the 3C chart, out to 15 min, is leading negative so I suspect they'll lead to the downside as well.

I posted an entire article on HYG's negative divergences as it has led the market, you can see the accumulation at the bottom and the continuing distribution today as it is also lagging price.

And VIX futures, on a 15 min chart are accumulating for a move higher, which makes sense as VIX futures are outperforming their normal correlation with equities.


Intraday breadth is also giving out from +1500 yesterday to a downtrend in to today in the -500/+750 area right now.

Plus there are the 3C signals in the averages, the leveraged ETFs and the inverses as well.

Just give it some time, a reversal should be a process, not an event. I'll let you know as always if I intend to add to the SQQQ position BEFORE I do so.

GLD Position Update

Monday afternoon I posted an alert for GLD puts, Trade Idea (Options) GLD PUT and they look like they are going to be gaining some momentum here so I wanted to update the charts and just reiterate what I'm looking for.

As we've talked about in recent months, with the F_E_D's monetization program ending, we assume Dollar bills won't grow on the F_E_D's HP tree, thus the recent $USD strength over the last several months that has the F_O_M_C up in arms about global growth due to a strong dollar, hence all of the F_E_D talk last week about QE4 and extending QE3, it's smoke and mirrors, the F_E_D decided a long time ago they were getting out of QE and that won't change, but they learned from the ECB's Draghi that they can jawbone the dollar down, what they haven't learned apparently is that jawboning without action doesn't last long and has an accelerating decay of effectiveness.  My point simply being, as we move to a less manipulated market by Central planners, the old $USD legacy arbitrage correlation should become stronger, that's simply when dollar denominated assets like gold, oil and stocks move opposite the $USD.

Here's GLD vs UUP (USD)...
 GLD in green and the $USD is red on a 60 min chart, there's obviously some correlation here, albeit inverse and I suspect we'll see more and more of that.

GDX tends to track GLD pretty closely as well (gold miners), although recently that correlation has been a bit off so I just want to make clear this is a GLD update, not a GDX update and I wouldn't make any assumptions about GDX based on THIS GLD update..

 GLD in green and GDX is red, good correlation at the green arrow which slips around the yellow arrow with GDX underperforming right now.

As for GLD... I have a feeing that Gold as well as gold miners which have a year plus long base, will enter a primary bull market while equities enter a primary bear market, but the base, escape velocity hasn't been reached yet.

 As this longer term, heavier underlying money flow 2 hour 3C chart of GLD shows, there's a familiar pattern of accumulation at the lows and distribution at the highs, it looks to be an obvious accumulation range with the accumulation at the lower end and when prices get too far from that lower end they are sent back down,  you have to remember institutional money's positions aren't like ours, they are much bigger and they take a lot more time to fill. I figure the home builder accumulation around 2000 as they lifted off from 2002/2003 to 2005 took about a year and a half, I always find it interesting they knew which asset would lead the next bull market while we were just coming out of the previous, Tech led bull market.

In any case we can talk about the virtues of GLD as it nears the lower end of the range, but for now, I suspect that's where it's headed, thus the GLD put as I'm not very impressed with the leveraged GLD ETFs.

 Near term timing charts like 3 min are leading negative

As is the important trade timeframe of 5 min, the minimum I look for to enter a trade.

The swing timeframe of 15 min is leading negative

As is the longer 30 min and 60 min. Most of these also shows the accumulation at the lows as well so I purposefully went with November monthly puts, I'm usually looking for about 3x more time than I think I'll need on my option positions.

In any case, so far so good, I am interested in a longer term GLD long position or maybe we even talk about physical rather than paper, but until we reach the lower end represented by the white band on the chart above this one, I suspect we keep heading lower.

A.M. Update

Good Morning...

A new day and a new denial regarding yesterday's Reuters rumor that the ECB would be buying Corporate bonds which was promptly shot down yesterday as a rumor by the Financial Times as Reuters has done some strange media relations in the past for Central Banks. Today we have another denial or retraction of the story that drove the Euro down and the market up (Draghi, Reuters, what's the difference as long as they teach the F_E_D how to jaw-bone your currency down without actually doing anything), this time it came right from the source, Reuters retracted the ECB bond buying bit or at least made the facts more clear, there isn't any, there aren't any plans for any.

As for the market, as you saw last night we are deeply overbought on a short term basis, there's still a huge amount of gas in the tank to drive the market higher as we had accumulation almost all of October, but we're running on 3 tires with that sharp "V" base. As you know from my SQQQ position yesterday, I believe we'll come down, create a bit of a larger base and finish the upside job, of course we want to verify as we go as always.

One thing that certainly has changed since Friday are the 5 and 7 min charts in Index futures, they are clearly leading negative now so it makes it a bit easier to believe we pullback in the near term.

For example...

 NASDASQ 1000 futures 5 min chart leading negative.

Russell 2000 7 min chart leading negative.

With everything else overbought, the 3C signals in the averages, HYG, etc. I feel good with the SQQQ position, but I'd like to buy a strong base, despite the last 3-days gains, I still would not have bought that "V" base, there are just too many ways it can go sideways and getting lucky it didn't isn't an investment strategy.