Wednesday, April 25, 2012

ES Update

Take a look at this...

ES is wedging pretty severely. If this were the SPX, I'd say, 'watch for a false upside breakout and a move down", but I haven't seen this too many times in ES and am not sure ES will react the same way that stocks act. One thing looks pretty certain though, a strong directional move should come out of this.

More Updates Coming

I'll be updating several other positions we have been watching or involved in with target areas as well as some market analysis I just wasn't able to get to today.

BIDU Update and Example Add to

BIDU is one of the positions that has done exactly what we were looking for, I was able to start a position at higher levels and it's doing well in the green (short).

Here's where I'd like to add...
 BIDU made what I suspected would be a false breakout/shakeout from a large toppy looking triangle, the breakout allowed me to start a position there as I have been moving away from short term leveraged trades to longer term short trades. Yesterday BIDU put in a Tweezer bottom, that was taken out today on what I would call a shakeout and is showing large volume on a strong day since the open, this look very much like a short term reversal, the gap at the yellow box is where I'm looking to add to BIDU.


 60 min chart shows the breakout to be a head fake move and BIDU has dropped pretty fast from that move. The market trend has been to fill gaps, so the gap is my target area, it's just about patience now.

The 5 min chart has a positive divergence starting over the previous two days where the tweezer bottom was, so in the near term it looks like BIDU wants to move to the gap.

Some of you who may want to continue trading nimbly could have or still could take decent profits in the BIDU short. At this point I think over trading or trying to be too nimble with positions that are intended to be longer term trades could set you up to miss the entire move.

BEAV Update -Add to

Here's a recent update of what was expected of BEAV

 As a brief review, BEAV broke support, formed a bearish continuation triangle, since Wall Street uses TA against traders, my thoughts were BEAV would break to the upside in a shakeout move before it broke to the downside. So far so good. I started a position there with the intent of adding on additional strength, the breakout from the bearish continuation triangle has given me that additional strength to add in to and it's looking weak today as is volume on the breakout move.

 Here's one of the confirmations in 3C that BEAV would break to the upside rather than to the downside as traders would have expected, since then on this 15 min chart, the negative divergences have been exactly what I was looking for.

 On the 30 min chart, you can see 3C is very negative in to the breakout of the triangle.

The overall 60 min chart is bearish.

I'll be adding a small position here and leaving a little room to potentially add 1 last time. In general I favor patience before adding or initiating large positions, but BEAV is one of the stocks I mentioned I would be looking to add to if conditions looked right, they look pretty good here for me.

Update

Without posting a bunch of charts, from looking at recent activity in the short term charts and GLD, I do feel the higher probability is higher prices at least for tomorrow. As mentioned earlier and well over a week ago, I would like to see the SPX try for $1400. I don't know if it makes it there, but again the entire purpose of this exercise in moving the market off the April 10th lows would be to knock out as many shorts as possible and get bulls back in the market to set a bull trap, $1400 would achieve both.

As a result of this analysis, unless there are very specific stocks with great set ups right here and now, any positions (short) that I add, will still be on the small side as long as higher prices are anticipated and that is where I'm leaning. Higher prices offer a better entry and less risk.

Market Update

It is still not clear whether dumb money can be convinced that the policy statement in dovish enough to get the market higher. What I do see becoming more clear is negative divergences in to strength in price, this is what we want to see. I'm leaning toward adding more equity shorts with wide stops in case there are short term higher prices, allowing me to ride them out and add if the opportunity is there.

Here are some of the key charts that are making it a bit more clear.

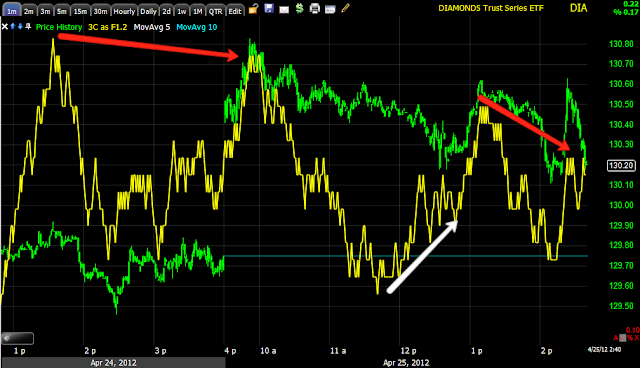
 DIA 1 min, the earlier positive divergence pre-announcement seems to show some choppy moves higher, each sees a negative divergence, again, price strength wherever it is found, appears to be under distribution.

 2 min chart -the positive divergence here is less noticeable, this would mean it was not as strong, the negative divergences are quite clear, meaning they are stronger.

 DIA 5 min, it doesn't look like an imminent collapse, so higher price are still looking like a reasonable possibility, meanwhile the "every person for themselves" concept seems to be alive and well as even small moves up are seeing negative divergences.

 ES is relatively volatile intraday, also choppy, the trend in 3C is leading negative

 Remember the Q's were the strongest yesterday, this is why (pre-AAPL earnings), the opinion was Tech would lead in the near term, AAPL confirmed that with their earnings. QQQ 1 min is seeing negative divergences.

 The 2 min is quite clear, leading negative.

 The underlying short term rotational strength in Tech is seeing some 3 min negative divergence, remember, it was the 15 min tech/QQQ chart that led me to believe tech would lead today, so the deterioration on the 3 min chart is flowing from the 1-2 min timeframes. The 15 min as the strongest in the QQQ, the 5 min will have to fall apart  for the 15 min chart to start seeing the negative divergences which would be much more serious on the 15 min chart. As long as the QQQ 15 min chart holds up, higher prices in tech and thus the market to a lesser extent cannot be ruled out.

 QQQ 5 min still holding reasonably well

 Not much movement in the 15 min chart yet.

 SPY 1 min, again the pre-F_O_M_C positive divergence and some pretty dent negative divergences in to higher prices.

 The 2 min chart, again the recent highs have seen a decent negative divergence, indicating that strength continues to be sold.

 3 min-same idea

The 5 min chart is falling apart here faster than the Q's, this is easily explained by looking at relative performance of Financials vs Tech, as expected yesterday the market would move directionally together, the difference would be in relative performance, Financials have clearly taken a back seat in rotation as expected yesterday to Tech, the SPX has a much higher exposure to financials and the Q's a much higher exposure to tech. Financials are even underperforming the SPX.

I want to keep a close eye on the market, but I would also like to be looking to add to short positions wherever there is decent strength.


Apparent proof that Gold will lead the dumb money sentiment

Earlier I suggested gold would be indicative of dumb money's sentiment r: the F_O_M_C's stance with regard to easing. This appears to be proof of that.

 SPY in green, GLD in white. Pre-announcement there is an inverse relationship (red box)

Since the policy statement and as Bernie speaks, the correlation has flipped and gold is tracking the SPX.

GDX-GDXJ update

Since GDX and GDXJ have near term correlation with GLD, lets take a look...

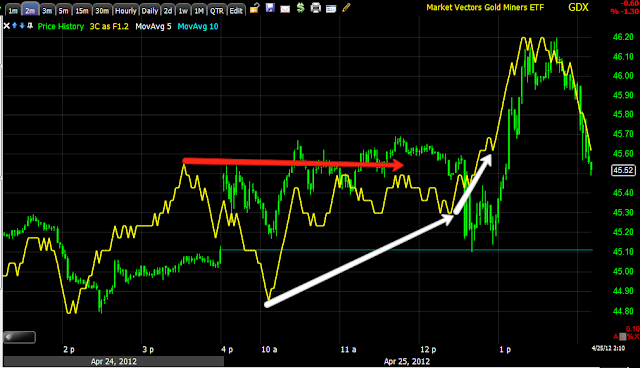
 GDX looks almost exactly like GLD on the 1 min.

 Very similar on the 2 min as well

 And the 3 min

 The 5 min chart is nearly in line, although the negative divergence JUST BEFORE the policy statement, is clear.

 Interestingly, the 30 min chart has a very strong positive divergence

 As does the 60 min chart

GDXJ looks exactly the same on all of the charts, so I'm just showing the 60 min chart.

This is just a guess, but the longer term positive divergence suggests GDX/J move higher, that means GLD should move higher. In this case, that should be a reflection of dumb money QE3 expectations. This would move the market higher near term, maybe SPX $1400 as we had originally hoped on April 10th.

Press Conference Starting

View here:

http://www.zerohedge.com/news/live-webcast-ben-bernanke-press-conference-and-updated-fed-forecasts

GLD Update

I suspect GLD will be important in determining what the short term market implications are, unfortunately it is one of the more difficult assets to analyze and I don't think the short term- big picture has emerged yet (I know that's an oxy-moron).

 The initial knee jerk in GLD/gold was one of the only initial knee jerk reactions except for treasuries. If retail starts to think this policy statement is dovish, GLD will rally. The initial spike down was because there was no reference to extending Twist or QE3.

 While there was a small negative divergence JUST BEFORE the policy statement, it looks like GLD was accumulated at least on a 1 min chart as it hit lows, this may just be a quick trade Wall Street took on cheap gold, however it can also be a leading indicator as to interpretation of market sentiment-more so dumb money than smart. Note the negative divergence on GLD's run back up. Initially this looks like Wall Street grabbing cheap shares of GLD and selling them higher, again though, I don't think the larger picture for the near term market action has been laid out yet-maybe because of the Bernie speech coming.

 The 2 min chart shows a relative positive divergence at GLD's knee jerk lows, it also shows the same distribution of the move higher off those lows.

Just to confirm the short term, I'm using a 3 min chart as well, here too you see the negative divergence BEFORE the policy statement, a relative positive and a negative divergence in to the bounce off the lows.

I'll be a bit slow on the emails today as I don't want to miss a crucial signal.


SPY/ES Update

Here's a quick look at the so far subdued, knee jerk effect.

 ES has been negative almost all day, I did mention the slight positive divergence in ES BEFORE the policy statement, since then ES has hit intraday resistance and is starting to lead negative again.

 The pre-announcement SPY 1 min positive, there is a slight negative in place, we want to watch this to see if it is only a brief consolidation at resistance or the start of a more negative trend. The intraday positive divergence is enough to move the market higher, but it did occur BEFORE the policy statement. It may be all Wall Street getting set to run a quick cycle and have nothing whatsoever to do with the policy statement. This is probably one of those times when listening to CNBC and how they are feeding the policy statement for retail consumption, makes sense. In my view, CNBC is just the propaganda arm of Wall Street.

 The 2 min is still positive and intraday, leading positive. Again, what happens on the 1 min chart is crucial here to the near term. The 1 min slight negative is so new that it would not show up on the 2 min yet, that is why determining whether it is the start of a distribution move or just a consolidative move near intraday resistance is key to the short term.

The 5 min seems to indicate that price strength is under distribution. It is entirely possible to move the market higher from the 1-2 min positive divergences while price strength is sold in to which would be reflected on the 5 and maybe even the 15 min chart.

There are too many variables at the moment until Bernie speaks to judge which way this is going in the short term, I don't see any reason not to add to shorts on price strength at this moment and as of now, that continues to be my plan of action, albeit I am not looking to take on huge positions, but rather build them as the information warrants.


Initial Impressions

As mentioned yesterday, even a statement that is exactly the same as the last, has the power to move the market from where we are now. The last statement did move the market to the upside... However, was the last statement the one that created a top and distribution? In other words, while smart money may have very well let retail get excited, it appears smart money had a different take on the last policy statement. If this one isn't that much different and institutional money has removed the support for the market in to the brief strength that followed and then the very volatile and choppy "toppy" market, what would that mean for the market now?

Here are some charts showing what I mean as they probably do a better job than what I just wrote.

 The last policy statement was here, note market action following it. Also notice the left side of a trend line I have had drawn on the SPY chart for sometime, I didn't move this, it's been there for some time.

 Now moving forward from the statement to the present, talk about a protracted initial knee jerk reaction and then the true take-away from Wall Street! Note that very same trendline from the last policy statement has acted as support, it is also the level in which the market broke major local support and then the 50-day moving average. Note where we are now, almost EXACTLY where we were when the last F_O_M_C policy statement was released!

 The same on the daily chart, support at the green arrow in the same area as the previous policy statement.

Just trying to get a feel for the mid-term trend since the last policy statement on, a 15 min leading negative divergence. It "appears" Wall Street may have fostered the notion of the last policy statement being implicitly QE positive, albeit through only subtle wording. Is Bernie taking a page out of the "Greenspeak" book? Remember the days Alan could talk for hours and you still had no idea what he was thinking?

I find the above interesting.

As for the policy statement today, initial reaction was muted, we are seeing some upward volatility in the 3 major averages, but on very low volume, compared to the initial muted action, the difference in volume is notable.


As to the policy statement itself,

1) FED SAYS ECONOMY `EXPANDING MODERATELY'
2) FED SAYS INFLATION `HAS PICKED UP SOMEWHAT' ON ENERGY
3) FED SAYS GROWTH TO STAY MODERATE, `THEN TO PICK UP GRADUALLY'
4) LACKER DISSENTS FROM FOMC DECISION
5) FED SEES `SIGNIFICANT DOWNSIDE RISKS'
6) FED SEES `EXCEPTIONALLY LOW' RATES AT LEAST THROUGH LATE 2014


There seems to be an acknowledgement that labor conditions are not as good as they were.


Thy added "despite some signs of improvement" housing remains depressed.


The part on inflation changed from "Subdued in recent months" to "inflation has picked up" blaming oil and gas.


Expectations with regard to oil/gas inflation- They seem to make a point to recognize the inflation in 
oil/gas, but also to point out it is transitory and not effecting longer term expectations.


As to economic growth, the change is subtle, again seemingly acknowledging the recent bad economic data, but again hinting it is transitory in saying, "GROWTH TO STAY MODERATE, `THEN TO PICK UP GRADUALLY'


Notably the part about "Strains in the global financial markets have eased" has been removed entirely, leaving only that it now poses significant threats. It seems the F_E_D see what has been clear to everyone else regarding Europe and China.


Another point is made that oil/gas inflation is in their view, transitory.


"Likely to warrant EXCEPTIONALLY low levels in the F_E_D funds rate" was added "through 2014. 


Is the F_E_D once again behind the curve? Have they looked at the Surprise Economic Index lately? Are they waiting for a significant downturn? Or have they simply realized QE has not been effective as we are way behind where we should be at this point in a post recession recovery judged against all post recession recoveries since World War 2?


This chart of GLD is the initial reaction to no hints at extending operation Twist and a lack of QE3 language...
 What has happened since? 


30 Year Treasuries also plunged, but have recently stabilized.


Realize that what was said at the F_O_M_C policy meeting is not public information, this is where the true thoughts of the F_E_D rest, we won't see that until 2017.


You could say, "The F_E_D met for 2 days and all I got was this lousy policy statement!"


The market really isn't doing anything extraordinary, it' time to look very closely at the underlying action. I suspect there's a brief "hold your fire" period in effect until Bernie gives his presser.


Statement

Not a lot of change, there's a lot to leave open to interpretation.

SPY Divergence

Here's a peak at the divergences I mentioned on the 1-2 min charts except the Q's

 1 min positive intraday
Move in SPy

Ideal SPX move

When we first saw the first signs of the bounce 4/10, this is where the ideal volatility shakeout would occur in the SPX.

$1400 would be a key level for a good shakeout.

Market Update-somewhat interesting.

The DIA, SPY, IWM and to a lesser degree, ES- 1 and 2 min charts are showing an intraday positive divergence. The QQQ is not and looks to be getting worse. These are still very short timeframes, but I find it interesting.

Don't Forget-Policy Statement at 12:30

Also there is a Bernanke Press conference after, I'm not sure about the time, but it will be important as well.

Remember to be aware that typically there is a strong knee-jerk reaction, it usually doesn't hold, but this is probably one of the most important statements yet.

AAPL (or the market) Update

Here it is...

I wanted to give AAPL a little more time for the 5 min charts to catch up before updating AAPL. This early the 15 min chart likely has not caught up yet.

"Plan your trade, trade your plan"

 The plan was AAPL broke several important support levels, the trend in the market is to shakeout the shorts. There were 3 levels (as I updated them yesterday) that I wanted to see AAPL break to add to my short (unfortunately my short was a fat finger trade-that has been rectified) at $575, the psychological $600 level and the break above the descending triangle's upper resistance line shown on this chart, AAPL took out all 3. I want to short in to strength, this is the strength I was hoping for. (Note-although I won't rule out options trades on short term, strong signals, I'm transitioning to equity shorts).

 The 1 min with yesterday's late positive divergence, appears to be in line. This is why I like StockFinder for its 5000 bars of intraday history...

 AAPL is much higher than any point on this chart, to confirm, 3C should be at a new high on this chart, therefore AAPL has not confirmed the upside move, this suggests selling in to strength which can also be shorting as both acts come across the tape as a sale.

 The 2 min chart also has not confirmed, if it had, 3C would be where the blue arrow is now.

 The 5 min chart has not confirmed either and has a leading negative position relative to past history as well as a leading negative intraday. Again, it appears the hedge fund hotel trade is using strength to move out of large AAPL positions that were in many cases in the top 5 holdings, those are huge positions and take time to move out of for a large fund.

AAPL may have signed its growth death warrant with the declaration of a dividend, it killed MSFT's growth. Furthermore guidance was not good, even for AAPL that consistently is purposefully conservative on guidance.

 The 15 min chart is where all short intraday divergences (positive) would have accrued, however even here, we are not quite seeing confirmation. I look forward to watching this chart as the day moves on.

 These next two charts have nothing to do with what transpired since earnings, they are the longer term trend of underlying smart money action, the 30 min is leading negative.

The 60 min is SHARPLY and VERY quickly leading negative. It seems once Dan Loeb's top 5 holdings were released and AAPL was conspicuously absent from the prior month, it was a call to arms for other hedge funds that flock together as Loeb is one of the managers that hedge funds follow closely.

This is the MAIN reason I am short AAPL is the chart above.