Tuesday, September 17, 2013

Daily Wrap

It's been an interesting week so far, from a huge gap up Sunday night in futures to that being destroyed yesterday, then late in the afternoon we saw a positive divergence forming, the only way it made sense was if it could continue overnight and bounce the market today, amazingly as you can see in the post history on the right side of the site (Archives), I checked the Futures last night and they did exactly that and beautifully so the bounce that seemed probable in one of the most improbable times to accumulate (overnight) did exactly as suspected, as strange and as infrequently as that happens.

Even the engine that we speculated to drive the market today, SPY Arbitrage, was the engine until the market could get a short squeeze in Russell "Most Shorted Stocks" going.

While the other averages started looking like they were seeing the kind of distribution expected (for a short 1-day bounce), the R2K/R3K's short squeeze looked impenetrable until the end of the day when TICK data hinted at problems and then the IWM itself followed up with a negative.

The ending divergences intraday (remember these were going positive in the later half of Monday afternoon), looked like this.

 DIA leading negative in to a flat range which is very typical for distribution and expected based on the size of the positive divergence which wasn't that big.

I'm not going through the entire timeline of how all of this developed because I've posted it numerous times, but starting with a late afternoon positive yesterday, a beautiful positive in the overnight session and as we guessed or predicted, the SPY arbitrage to light the fire, the only thing I didn't see coming was the Russell short squeeze, but considering smart money wasn't going to want to be long credit in to tomorrow, the SPY arbitrage had to fail as money moved out of HYG (credit).

You'll notice all of the averages have deep negative intraday signals except the IWM or at least not as bad as short covering there was keeping the IWM alive and well.

 QQQ intraday leading negative with AAPL and the Tech sector seeing distribution.

SPY leading negative

And finally as the TICK data stumbled showing the short squeeze was losing momentum, the IWM goes negative and makes the first lower low of the entire afternoon at the EOD (yellow).

Just like last night, I have a strong feeling that overnight futures are going to provide the same  strong influence that moves trade tomorrow and the IWM looks exceptionally exposed here as do many other averages and stocks.

In fact, as early as it is (and last night I purposefully didn't check futures until they had time to move), here's an early look at the Index futures this early in the night.

 ES/SPX doesn't look good, but damage was done during regular hours, still I'll be checking in on these later tonight as there may be a great opportunity for an opening or early position.

The NQ/NASDAQ 100 faltering.

And TF/Russell 2000 which was in line all day long until just recently in to the close as we saw elsewhere (3C on IWM, TICK data, the most shorted index, etc.).

Here are some other short and longer term notable charts, first with some Leading Indicators...
 VXX shows VIX futures were bid up today as I have inverted the SPX to show relative performance, this isn't so strange before an event like tomorrow's policy statement, but there are some larger issues that need to be considered.

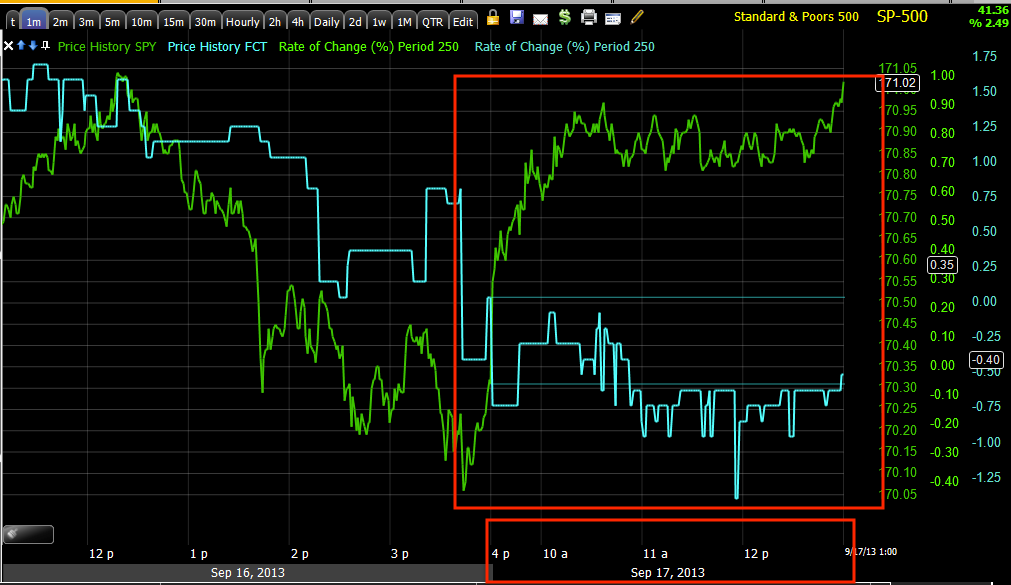
Our professional sentiment indicator FCT, moved with the SPX on the way up (as we expected a strong move up and the FRP video explains exactly why, stocks like AMZN today were part of that reason why).

The falling off in sentiment today is an extreme change in character, but like I have said recently, we don't want to get lost staring too closely so take a look at what sentiment has done on a larger scale.

This 15 min chart shows sentiment in line with the SPX and at the rally that we'd expect to see strong sentiment "IF" Wall St. was buying it, has totally fallen off and right at the start of the move which suggests this is the cycle (manipulative-again the reasons are in the FRP video) is absolutely Wall St. created as we said they'd need to do BEFORE it even happened!

Yields that act as a magnet for the market went from positive in the accumulation zone of this cycle and were in line at the start of the move and have since fallen off badly, they'll be exerting downside pressure on the market.

However, this was the biggie that I almost couldn't sleep thinking about how it would turn out today as I said yesterday, this is probably the most important indication and today would tell us a lot.

The further losses in the institutional risk asset of HY Credit tells us Wall St. is VERY nervous about something and I'm not sure it's just the uncertainty of what the F_E_D will do tomorrow, we have seen cases where the F_E_D has leaked not only minutes to 154 Private equity firms via email a day before the release, but we have seen policy statements leaked 2 hours ahead of the statement or perhaps more.

Commodities got slammed again today, gold, silver, oil (PMs are acting as if they are looking for a taper).

Longer term objectivity...
 This is a clean uptrend channel in the SPX for most of the first half of the year, the red arrow is the important key reversal day, a very bearish signal on 5/22, from there it acted like a channel buster with a quick move below the channel, this was and still is an important event, I think when we look back a year from now these are going to be some conceptual red flags for the tool box.

Technical analysis expects a "Kiss of the channel goodbye" and the channel to act as resistance, but as I have shown over and over, Wall St. knows what technical traders expect and now these channels are almost ALWAYS shaken out by a return back inside the channel.

However the thing to really pay attention to here is the deterioration of the channel.

 Add a simple ROC on price and you can see where price starts deteriorating -as they say, "The trend is your friend until the end when it starts to bend".

March looks like a clear winner for the start of the deterioration of the trend, so what happened with stocks around that time?

Breadth Indicators don't lie, they aren't up for interpretation, they are hard numbers like this one showing the Percentage of all NYSE stocks trading ABOVE their own 200 day (considered to be a bull market when above) moving average, that percentage should climb with higher prices, instead it tops out at 81% and continues to fall throughout the year to about half of all NYSE stocks now are either above or under their 200-day ma.a, considering where price is, this is about as ugly as I've seen breadth.

The stronger momentum stocks Two Standard deviations ABOVE their 200 day moving averages fall from 42 % to less than half that now, 18%, and you wonder why 3C has been showing distribution, these stock's price has fallen below long term moving averages, that doesn't happen unless they're being sold or "Distributed".

If you've followed my F_E_D analysis since Sept. 13 2012, you know exactly why I think this is, because the F_E_D has decided back then that this was the last QE and started making motions to make that apparent and to make that happen. I can tell you the exact time on Sept 13th I noticed it, 2:24 p.m. during Bernie's press conference when he gave an odd answer to a question that showed a huge shift in F_E_D thinking.


This is the Summation Index of the McClellan Oscillator, a cumulative line of the MCO, this should be moving higher with price, instead it's just off new lows as price is near or at new highs (absolute or regional).

 I found this chart of VIX Futures today interesting, look at the spike, new high they make toward the close and look at that volume, it makes sense considering tomorrow, but...


 When we look at this 30 min leading positive divergence of the $USD, this looks very much like FX traders expect the F_E_D to announce a taper as the $USD would sink otherwise.


Something seems a little out of place, but you wouldn't know that if you were chasing price only.

Finally, setting aside the spike in VIX Futures or a bid for protection from market downside on huge volume, the longer 30 min chart's divergence is clear.
This isn't the kind of accumulation that is last minute before the F_E_D, this is the kind that takes time to accumulate and the 30 min leading is huge.

I'm not jumping to conclussions, but the objective evidence doesn't look good for the market.

The next test is what the futures do tonight...

I'll check back in after some time has passed.

IWM Finally Gives signal As Short Squeeze Sees Trouble

This is what was missing in the IWM and probably all Russell averages, but as the TICK data showed the short squeeze there was faltering, look what happened...
This is why patience is important and confirmation among strong, objective data is absolutely necessary. My guess is there will be tons of limit orders to buy the IWM pre-market or in AH, but I suspect it's going to look like a very nice short before 2 pm tomorrow, the 3C intraday chart finally faltered as the TICK data and most shorted index started to as well.

Note the little jiggle in yellow at the close in the otherwise picture perfect short squeeze.

What easier way to short in size in to great prices than the set up we have in front of us. I'm not saying I would here, this is the first step of confirmation, but it's interesting the market needed the SPY Arbitrage to kick start a short squeeze, we saw the same a few days ago. How do we know this? Simple...
 The SPY Arbitrage that we saw being put together late yesterday worked the market in the morning and early afternoon, once it can get the market to an area where retail will buy, it has done it's job and can back off, note around 12 p.m. or so it starts backing off.


 Around the same time, the Russell 3000 Most Shorted Index (red) takes off in a squeeze.

This allows the HYG longs to get out as no one wants to be caught long a risk asset without a seat when the music stops playing...


The 15 min VXX chart intraday shows the bid for protection in a strong way, risk assets abandoned as soon as the squeeze begins and protection bought.

What was the actual catalyst to get the squeeze moving?, I'd have to look around quite a bit, but it could be as simple as this...
Resistance being breached in the IWM and probably the R3K or component shorts would be a catalyst, the 50-bar also, but it looks more like resistance.

Short Squeeze Concepts: Short squeezes look like a straight line, there's no significant corrections during them as you see after 12 p.m., a near straight trendline in the IWM with no corrections. Short squeezes are also notorious for being on low volume, today fits the bill perfectly there. The thing is, when an index is propelled solely by a short squeeze, which this one was because it couldn't do anything without a sponsor to get it above resistance which was the SPY Arbitrage as suspected yesterday being the carry crosses weren't up to the job, when there's no more shorts to cover and the TICK data looked like the shorts were running dry, then there's no more demand as covering a short is buying and that's demand.


Look Who's Moving: FRP

I found this interesting and noticed something I missed earlier.

The thesis as explained in the FRP video since the end of August was the market would need Wall St. help to get stocks like FRP , PCLN, NFLX, etc up to their breakout areas where head fake moves galore should be found.

FRP is moving that way this afternoon although I doubt it makes it today, 3C is doing as expected on the move and what I missed before is the breakout area for a head fake move is at perhaps the strongest psychological number of all, $10 even, you never see anything for sale for $10, always $9.99 because the human mind gravitates towards these whole numbers like a heat seeking "projectile", we never know (or we do know) who's listening.

TICK Data-SS Ending

It loks like the short squeeze in the Russell stocks, may be coming to an end, at least there's a change in character.

Intraday TICK data (1 min) shows a solid afternoon trend, this is the short squeezem it's odd looking for a SS because it's not showing extremes of +1000, but more in the mid range, but remember we were looking at the MOST shorted Index, top 100 shorted R3K stocks. In any case, the trend is changing in TICK data now so I'll be on the lookout for other signals.


IWM Update

Of all of the averages today, the IWM has shown the strongest underlying performance, I've actually been at a loss to understand it until I checked in on the new indicator put together this weekend, Russell 3000 index vs. the most shorted R3K top 100 stocks, this explains the performance.

 IWM intraday chart is negative, but not like the other averages and the price performance is much better.

So I checked in on my new indicator that compares the Russell 3000 100 stocks with the highest short interest vs the R3K and what did I find?
In red is the most shorted index I created from the highest short interest R3K components vs the r3K in green, look at the near diagonal line in the red MSI , a short squeeze, beautiful.

This is what's keeping the IWEM's relative performance above others and 3C, I suspect at some point the distribution in to that squeeze will be heavy, that "might" be an area worth looking at a position.

AS ALWAYS, PLEASE DON'T FORGET THAT WITH F_E_D AND F_O_M_C EVENTS, THE INITIAL KNEE JERK REACTION WE SEE IS ALMOST ALWAYS WRONG SO DON'T PANIC OR GET OVERCONFIDENT ON THE INITIAL MOVE, CHANCES ARE IT WILL BE REVERSED, ALTHOUGHT THIS IS BEING BILLED AS THE MOST IMPORTANT F_O_M_C MEETING EVER, THERE'S THE CHANCE THE MARKET DOES AS IT MEANS TO, BUT 90% OF THE TIME THERE'S A KNEE JERK REACTION INITIALLY THAT IS WRONG.

VIX Futures and VXX Finally Moving to position

The long term VXX charts never fell apart, it was only shorter term and mostly around the area of the accumulation range as would be expected, In one of the last major VIX updates, I had said that the long term is already there, meaning accumulation to a large degree had already been set up, it was now a matter of the short term accumulation coming in to line and the yard stick I chose was improvement on the 15 minute chart, that is now becoming a reality and the VIX futures themselves (the asset all the derivatives like VIX and VXX are derived from) looks great on 30 min futures charts.

 4 hour long term 3C VXX chart with a large leading positive divergence, moreover, note the large "W" base to the right of the chart.

 VXX 5 min goes negative at the end of August just like the market range/accumulation started at the same time, that's confirmation, now the 5 min chart moves from downside confirmation to a leading positive divergence.

 And the 15 min chart is now doing what I wanted to see, note the accumulation of the last two days continues to rise.

The 30 min VIX Futures, the most important other than maybe the 4 hour chart, are very strong.

Someone has accumulated a lot of VIX Futures, I honestly find it amusing that Stock(knit)Twits can't reconcile accumulation in the VIX because it hasn't moved up enough as they still believe the 20+ year old myth that smart money pushes prices higher with their buying, prices only move higher long after smart money is in.

QQQ / AAPL intraday update

AAPL obviously doesn't have the 20% weight it use to have on the NASDAQ 100, for a $10,000 a year subscription to NASDAQ you can find out what the current weight is, but whatever it is, it's still the largest, most heavily weighted component.

Although I expected distribution in to today''s move all over, the Q's seem to be the sharpest intraday, this seems to be because of AAPL.

I posted AAPL this week and said that I WOULD NOT be involved with AAPL yet, there are too many things going on and it needs to settle in before the probabilities are on our side with low risk, but for now it seems to be hurting the NASDAQ the most.

There's also some obvious weakness in the Tech sector, XLK as well as the 3x long Tech ETF, TECL.
 QQQ late day accumulation yesterday (3 min) and sharp distribution, although all averages are seeing intraday distribution, the Q's looks to be the sharpest. The obvious place to look was AAPL.

 And the intraday 2 min chart confirms what I suspected.

XLK showing similar strong intraday distribution (2 min).

And TECL (3x long Tech ETF) was negative on the open Monday morning, a VERY small positive yesterday afternoon and negative this afternoon.

This is exactly what I expected yesterday as there was no support for the 1 min positive in very many places beyond 1 min, so essentially a very small amount accumulated and obviously being distributed pretty hard.

I don't know or think this represents an F_O_M_C leak, at least I haven't seen anything that makes me think that as of yet, but I think it is as I said, the last chance to bounce before everyone will want to be flat in to the F_O_M_C.

However, it would be amazing to find signs of a leak, if I can find that, it will be load up the truck time.


Market Update Charts, Leading Indicators, etc.

Yesterday we saw the start of a positive divergence, short term (in fact possible to be undone today or before tomorrow at 2 p.m.

This looks like the last chance bounce before the unknown wild card F_O_M_C risk hits at 2 p.m., that was my gut feeling for the reason for this move. THIS MOVE IS NOT "TAPER-OFF" SENTIMENT IN FRONT OF THE F_O_M_C, if it was the Dollar would be down on this bounce significantly, gold would be up significantly and Treasuries would be up significantly, none are, only the market so I think the reasons put forth yesterday hold water.

As expected, the market on its own doesn't have the power to lift higher, the USD/JPY may have some influence in the future, not too far off, but none of the carry pairs lifted the market either as was my opinion yesterday.
 5 min chart of the USD/JPY has some upside, but not nearly enough to even bounce the market as this doesn't look anything like a carry trade on, it just looks like a wiggle.

My feeling yesterday was the only other source that could drive the market higher in absence of real demand as evidenced by the dismal volume today, was the short term manipulation of the SPY Arbitrage being activated with the 3 assets that control it, (HYG, TLT and VXX).

 HYG vs the SPX today is up, just as the SPY Arbitrage would need for manipulation to send the market higher as algos read High Yield Corp. Credit as being bullish and buy stocks.

 However in to the move up, 3C is showing obvious distribution in HYG so it doesn't look like anyone wants to hold HY Credit (An institutional risk asset) in front of the F_O_M_C, they just needed to move it up enough to activate the SPY Arbitrage.

VXX (short term VIX Futures) were positive yesterday morning which sent VXX higher and the market down as algos read VXX moving down as a fear among traders and reach for protection of VIX futures, but the move up today is what algos see as that fear of risk being unwound, in combination with HYG, to algos (machines) it looks like a true "Risk on event".

 As mentioned though, I thought this would be a short term bounce and the 2 min VXX chart shows no damage at all, so the divergence to  move it was very small, it didn't even register on the 2 min chart, again just enough to move it, but no conviction in the move beyond a short term (1-day or so bounce).

Here VXX in blue moves down and the SPX in green moves up, along with TLT, the third asset in the SPY Arbitrage manipulation, you have the only engine that could bounce the market as there's no real demand, look at volume even with the SPY Arb in the "on" position, it's horrible.

Finally, actual proof of the SPY Arbitrage activated via Capital CONTEXT, this is essentially the only reason the market moved up today which is what was expected yesterday, a weak move with the moves in High Yield Credit telling us much more about the true intentions of the market in a more meaningful way.

As for the averages themselves, they are already starting to see intraday 1 min distribution.

 SPY negative on the open Monday and the late day positive divergence I warned about yesterday afternoon, this is the last of 3 updates during regular hours warning of a bounce brewing yesterday in the late afternoon, there were two earlier updates warning of the same.

As you can see, the same intraday charts today are starting to go negative, this isn't the kind of divergence I'd be taking on a lot of risk with, but it is the information we need to make better informed decisions about assets, trades and timing which is exceptionally important in front of the F_O_M_C tomorrow at 2 p.m.

REMEMBER, ANYTHING F_O_M_C OR F_E_D RELATED ALMOST ALWAYS SEES AN INITIAL KNEE JERK REACTION THAT CAN LAST AN HOUR OR A FEW DAYS, BUT THAT INITIAL REACTION IS ALMOST ALWAYS WRONG.

*If you look up every F_O_M_C or significant F_E_D event date and check our archives for that day, you'll see I ALWAYS warn of this knee jerk effect because it is such a reliable feature of these situations and can often be faded for a nice trade, while retail only knowns to follow price.

 The 3 min SPY shows the accumulation range I had talked about so much in white, thus was the accumulation NEEDED to send the market higher to breakout stocks like AMZN, PCLN, NFLX and the example of the entire concept, FRP. We didn't arrive to this conclusion after or as it happened, we expected this as the range started weeks ago and that was given as the reason for the move or at the time, the move to come.

 QQQ late day 1 min accumulation yesterday as posted 3 times in the afternoon for a bounce, the bounce today is already seeing a range where 3C activity is often highest and a negative divergence already forming there. Again, my assumption is today was the last day the market could bounce before the uncertainty of the F_O_M_C tomorrow, whether it was to such in retail which it has, to sell accumulated longs from the range at higher prices, to sell short in to higher prices or all 3, I can't say, but I suspect all 3.


As mentioned yesterday, there was NO 3C strength beyond 1 min as this 2 min QQQ chart shows, in fact distribution today is now evident.

IWM 1 min with some positive divergences late last week, distribution on Monday morning's gap up open and again distribution in to today's small bounce higher.

Again, I would not take action on this alone as of yet, but continue observing and waiting for our chance to set the wolf pack lose on the sheep.

As mentioned, we see the Range Accumulation to the far left which we expected to lead us to a strong upside market move, but not for the reasons retail suspects, in fact the opposite of those reasons, to push certain stocks in to breakouts that retail will chase, providing the demand Wall St. needs to sell short at better prices, but more importantly, at significant volume that they need to move positions. Retail is predictable, they chase breakouts so all Wall St. needed to do was set up a move up as there were and are so many stocks in the FRP situation that make for excellent shorts if they can just breakout (a head fake move) so Wall St. can use the demand to sell short in to, it's the exact same trade we took (longs in the range to sell at higher prices and then shorts as stocks move above the breakout area-
See the FRP video for the complete concept).

Again, 3C is showing the distribution we expected to see on a move higher in price.

Professional sentiment is no longer interested in following stocks higher, just as we are largely no longer interested in staying long in this risky area unless we have objective data that says we should.

Institutional sentiment turning sour on the market.
 There was a small positive sentiment before the bounce, it has turned negative in to the bounce.

Our second sentiment indicator looks even worse.

Below. yields and why they are such a fantastic leading indicator.
In green on the start of the move up, yields which tend to pull stock prices toward them like a magnet were in line with the start of the rally out of the accumulation range, as we neared what should have been a pullback that was disrupted by the Syrian diplomatic solution, Yields started going negative. Now Yields are clearly dislocated from the SPX especially this week and will be exerting magnetic force on the market for it to follow yields to the downside, this is a great leading indicator.

HOWEVER THE MOST DAMNING EVIDENCE THAT APPEARED LAST WEEK, WAS MUCH WORSE YESTERDAY AND AS I SAID YESTERDAY, IF THIS IS WORSE TOMORROW, WE KNOW THE MARKET IS IN REAL TROUBLE, is the Institutional risk asset of High Yield Credit, HYG is HY credit, but correlated to the market for SPY Arbitrage manipulation so not as reliable short term, HY Credit has no such correlation and moves the way institutional money feel about the market, yesterday was the worst move in months for HY credit vs the SPX, today as I expected and hoped to see, things got much worse, this is also a fantastic leading indicator and right now, one of the most important as it shows what smart money is doing, it matches 3C and they aren't called smart money for nothing.

 "A" shows HY Credit positive in the accumulation range and leading the SPX to the upside, then "B" HY credit is in line with the early start of the upside move. At "C" HY Credit starts to dislocate negatively and "D", there's a serious dislocation that I can't recall the last time I saw, maybe right around the Key reversal day in spring?

This is a closer look with yesterday's move lower and as I was hoping to see, today its even worse.

All of this taken together has formed the risk of a large downside move as the CONTEXT model for SPX futures (ES) has now moved to an even deeper dislocation suggesting ES is overvalued by nearly 90 points!
This is definitely the worst reading I've ever seen, about 2x worse than anything I've ever seen. CONTEXT is saying the probabilities of ES (SPX futures) moving down at least -90 points is very high.

This is right in line with our expectations for what happens after the last strong move to the upside coming out of the accumulation range.

It seems our analysis was right on weeks before these moves even started.

Now it's a matter of continuing to confirm and looking for the timing or tactical signals that say, "Load up the truck".