Friday, November 4, 2011

Finally

 SPY 1 min

 SPY 2 min very ugly

 SPY 5 min

 TICK Index hits -1400-VERY bad.

 TLT trades near the highs instead of the lows and is in a leading positive divergence

An even bigger positive divergence.


Something looks like it's being set up.

SCO Long?


This is a tough call, buy on Friday over the weekend in an asset that is very correlated to news from Europe as well as Israel, but on the other hand, the positioning is very intriguing.

USO leading negative divergence on a 1 min chart...


 Same 1 min chart zoomed out, the divergences aren't marked as they should be very clear.

 USO 15 min negative

SCO 1 min positive, which is exactly as it should be considering USO is leading negative.

 SCO 15 min

The only other thing, aside from what I said at the start, is there's an obvious support line, a lot of the time a good move will start with a head fake, like a move below support and then flying higher.

Tough call, maybe a small position....

Update-Kiss the Channel?

 EUR/USD breaks a mini bear flag channel to the downside, this is a head fake, shorts that went for the break helped push the Euro up in a mini parabolic move upon covering as the Euro re-entered the channel and triggered covering (remember that usually for every parabolic move, there's a counter parabolic move).

 FXE since this morning's first round of accumulation and 12 pm negative divergence sending the Euro lower (breaking the above channel to the downside), note accumulation again at that point, albeit a smaller amount and another negative divergence off the mini parabolic move higher, now leading negative. There are a whole bunch of market lessons there if you take a look at the last 2 charts again, we see this same type of action on every timeframe in every equity every day.

 FXE/Euro 2 min from yesterday's negative divergence along with the entire market, now leading negative on the mini-parabolic move higher (not muh accumulation was needed for that move as the short covering did all the heavy lifting).

 Here's the SPY bear flag of 3 days, which broke down in 3C underlying trade during the afternoon (this might be considered more of a bear pennant, but that is a matter of semantics). The point is it broke out to the upside before collapsing, bringing in long trades as it looked like the flag/pennant failed, then headed lower. This is the same concept as the Euro break down today that I showed above, except instead of short sellers covering to create a mini-parabolic move, this would be longs selling to create a gap down. The other concept seen today is that of "Kiss the Channel Goodbye" as the SPY intraday breaks above it's channel in an effort to kiss the lower channel of the larger (3-day) bear flag/pennant.

 Here's a closer look.

 Again, like yesterday TLT is giving us a hint that few probably notice. TLT is a 20+ year treasury ETF and treasuries are the safe haven trade when the market is in trouble, they trade nearly perfectly inverse to the market. So TLT is in green and the SPY is in red. The SPY broke just above it's gap down open, which means TLT should be breaking just below it's open, rather it remains elevated and quite far from the trendline in green.

 And why? TLT 1 min accumulation

TLT leading positive divergence.

Keep an eye out for the down side mini-parabolic moves in the Euro and market.

Market Update

Trade remains "unremarkable".

 DIA 1 min showing some distribution in to the intraday bounce.

 The 2 min chart with a couple of days of history showing yesterday afternoon's negative divergence mentioned and the current intraday bounce seeing some negative divergences as well.

 The 5 min chart of the DIA with confirmation in the bear flag, which started on November 1st, the day before I warned of the likelihood of an upside reversal due to a doji candlestick close. The upside reversal formed a 3 day bear flag which broke down yesterday afternoon, you an see to the left when the bear flag started, some confirmation and the negative divergence through yesterday leading to today's move lower, which is completely unremarkable today as the 5 min chart is leading negative and not even showing confirmation on a relative basis, just heading down within the red box.

 QQQ 1 min intraday bounce is in confirmation.

 Here's the QQQ 2 min showing yesterday's negative divergence leading to the gap lower today and nothing remarkable about today's trade at all, no positive divergences before the bounce, just confirmation of the price move.

 The 5 min QQQ chart is slightly more negative showing a negative divergence recently around 12:30 pm.

 SPY 1 min shows confirmation on the intraday bounce as far as 3C is concerned,  already showed you how it is lagging FX correlations, then a negative divergence around 12:30 as well.

 SPY 2 min chart with yesterday's negative divergence and a pretty decent entry point and today's leading negative divergence to the downside.

The same is seen in the 5 min chart, I should point out the negative divergence of Oct. 28th, as opposed to yesterday's, quite similar in the divergence and effect thus far.

MARKET UPDATE

This is a different kind of update, but just as useful, maybe more so. If I was hiring traders and giving the choice between hiring someone with a MBA in finance or psychology, I would choose psychology assuming everything else is equal. Why? The answer is found in another question, "What moves markets?"

This is one thing Cramer said that I actually agree with, it was in his shocking interview with Aaron Task on the Street.com which he revealed some things that I think CNBC would rather his prime time viewers not hear about, but he also answered the question and showed, despite is clown-like performance on MM and his calls that may seem to be failures (in reality they are more likely there to benefit his Wall Street best friends), he actually is a pretty smart guy, but CNBC viewers are not likely to get the real truth from him and benefit from what he really knows.

In any case, the candidate with the finance degree would answer, "Supply and Demand move the market"

The psychology candidate (assuming he has studied the market a little bit) would say exactly as Cramer did, "Sentiment" is what moves the market.

In other words, while supply and demand are the mechanism that moves prices, the cause of that is found in "sentiment" or more blandly put, "emotion".

As I told a member last night, when I taught Technical Analysis to my classes for 3.5 years, the thing I hoped to instill in them the most was the ability to look at a price chart (it's much easier to do this in the present), especially historical harts because that's where you learn and put themselves in the "emotional moment" of the historical chart, rather then looking at moving averages and MACD. If you can do that, you can understand a lot about the market and how and why it behaves as it does today. You'll also understand while there is daily short term manipulation, the longer term charts are purely emotionally driven and that's why we see the same price patterns today (on a longer term basis) that we saw in the British markets over several centuries ago. It's the same reason Japanese CandleStick charting has worked for centuries whether it be in the rice markets 200 years ago or the stock market today.

So here's the point of the post, today either some HFT firms reprogrammed or shut down their legacy arbitrage algorithms or Skynet is still up and running, but human traders are overwhelming the machines do to Fear in the market.

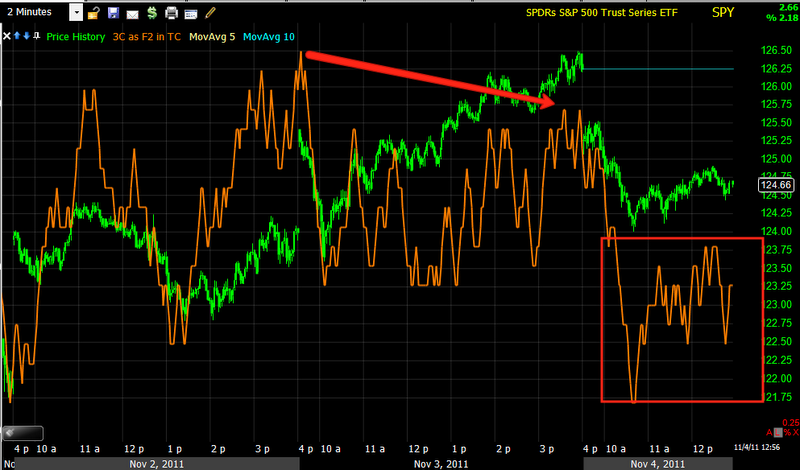
Here's one of those "fleeting glimpses" of market action.

 Longer term the EUR/USD pair found some support at the bottom of the bear flag and thus has bounced from that support.

 This is the SPY (green) vs the Euro (white), the red trendline is the Euro, the green trendline is the market/SPY. Notice how the Euro has made 5 higher highs while the SPY still hasn't managed to make a single new high from the reference point around 10:15? That's sentiment.

Here's the ES correlation to the Euro which almost always runs at 1.0 meaning as they Euro goes, so goes the market in almost exact correlation. However we have several points in which the correlation during this mid morning-noon bounce has actually totally reversed, meaning the Euro went up and ES didn't just drag behind, but actually went in the opposite direction of down. The average correlation is at nearly half the normal so ES "should" be about 50% higher then it is (during the Euro bounce period). That is market sentiment talking.

I wouldn't say the FX based bounce is important or happening for any other reason then just normal market trade as it hit a support line, it's doing what you'd expect, there's nothing remarkable about this, just normal market action.

As far as the FXE/Euro goes, it continues to deteriorate from a quick, intraday long trade from support.

FXE/Euro accumulation as it nears support around 10:15 and subsequent distribution on the bounce.


USO Update

In General, USO looks to be artificially or perhaps fundamentally propped up, it may be rumors from Israel or it may just be something artificial, but the underlying action continues to deteriorate and to use a sort of analogy, makes USO like a thin rocky ledge, the further you walk out, the thinner it gets until it breaks and just falls to the ground.

 Here's USO (green) vs the Euro (white) and in the red boxes the instances where USO has run in front of the Euro, especially on this last bear flag to the right.

 As far as USO's bear flag, it showed the same distribution yesterday as every other asset class.

 More confirmation of distribution in the bear flag on a 2 min chart

 More confirmation on a 5 min chart

 And confirmation on a 15 minute chart and this is a great example of what a bear flag actually is and what it is actually used for, it's a bearish consolidation pattern and it's generally used to enter new shorts at better prices and you can see 3C showing that happening. This is one of the best examples I've ever seen of the inner workings of a bear flag, of the hundred+ technical analysis books I have, not one has ever shown or proved what goes on at the institutional level inside of a bear flag. I did a little bit of a sloppy job drawing the trendlines, but the white box is USO hitting the support of the bottom trendline making a micro bear flag inside of the bigger bear flag.


 Here's the 15 min chart and bigger picture. USO looks like a top as far as price goes, as far as my analogy above about the rocky ledge getting thinner, just look at 3C during the top period.

The same could be said for this 60 min chart at a new leading negative low.


Market Update

Probabilities are that the EUR/Market counter trend bounce is likely over now.

FXE/Euro negative divergence on the 10:30 bounce

Still no positive divergences

At the best, just confirmation, at the worst, leading negative divergences.


 The move up in the last few minutes did not occur on any positive divergence, just a slight blip up in EUR/USD. Yesterday's warning: the leading negative divergence in the red box, that's a perfect example of a divergence, price going one way, 3C going the other.

 2 min SPY, negative yesterday and now a leading negative divergence (green arrows just show confirmation of the trend, nothing positive).

Surprisingly, even this early the 5 min chart is leading negative, which also shows yesterday's negative divergence.

Quick Market Update

If you were lucky yesterday, you didn't focus on the market heading up while 3C was heading down, you took the warning and acted on it, after all, that's precisely what 3C is supposed to do, contradict price to tell you what is really happening and thus, what is most likely to happen next.

Any way, having some trouble uploading (very slow) the charts, but the SPY so far is in perfect confirmation of the downtrend on the short term charts.

Yesterday's Gap Down Assesment

"The best payoffs will grow out of original insights, often gained during fleeting glimpses of market action" 

In essence, the above statement is exactly what happened yesterday, which is why I thought we'd see a gap down today. I hope you had a chance to look at the charts presented last night in my post, "Must Read"

If you did look at the charts, then you understand what that "Fleeting Glimpse" of market action was yesterday that led me to say that I thought the market would gap down today. More importantly, I covered all of the major S&P sectors and the charts all showed confirmation, not one chart disagreed with the rest, that makes a very bold statement about the condition of the market and where probabilities have the market heading and does so in bold fashion without having to use a single word to describe it.

The NFP missed consensus by a tad, coming in at 80,000 on consensus of 90,000, but there was some other good news in the report that may have offset the headline number a bit.

The Euro is falling for a multitude of reasons today, but whatever the reason (and there are plenty to choose from), apparently Wall Street had advance notice and thus every chart in last night's large post all showed the same thing, distribution into some strength.

"When you look at charts (price), always keep this in mind-the charts are often unfolding with the intent to mislead"


Among the more important headlines out today, German Manufacturing (The engine behind Europe's growth)missed badly today at a -4.3% drop on consensus of a +.1% gain; which makes 3 consecutive German manufacturing reports that now have German manufacturing on a annualized basis, heading toward a -28% decline.

It seems the G-20 meeting was little more then I thought it would be, a bunch of countries VERY ANGRY with the EU and not much more.

The world has moved beyond Greece in the "Fear Watch" and straight to Italy where bonds took out the 6.3% level before The ECB, with it's new leader, Mario Draghi, stepped in to bid the Italian bonds up-those same Italian bonds that Larry Kudlow says are insignificant as no one has even seen what one looks like, even though they are the 3rd largest bond market! In any case, the ECBs effort lasted about 30 minutes, showing that fear of the next domino to fall is truly Italy if the ECB an't even fight off the Bond Vigilantes for more then 30 minutes.

To make matters more interesting, that Austrian mega-bank I mentioned (as I'm a card  carrying member), ERSTE, who among perhaps hundreds of other EU banks, hid significant exposure to foreign CDS losses, is being downgraded by Moody's and the question still remains, how many other EU banks did the same and how much exposure to loss is really out there.

Last, commodities may be a bit wild today as MF Global customers' accounts are transferred to other brokers (less their margin money) so a raft of margin alls will go out today to these customers, many of which can not afford to pay the margin a second time-so look for a lot of selling and covering in the space today.

Key words: German Manufacturing and Italian Contagion.