Friday, May 17, 2013

VIX

I see a lot of people are getting a kick out of the whole SPX 666 / SPX 1666 affair, I guess someone may have a sense of humor.

 TLT in green vs SPX in red, interesting that TLT didn't care at all about the EOD ramp-this was a ramp. If you paid attention to the posts today, you know why, you also know why TLT saw distribution to send it lower right after the 11:30 SPY triangle failed yesterday, they needed all the help they could get.

This is about as ironic as the Yen rising right after 4 p.m. as the Yen/SPX correlation is so strong.

Interesting as well that SPOT VIX not only didn't care about the EOD ramp, it actually went higher!

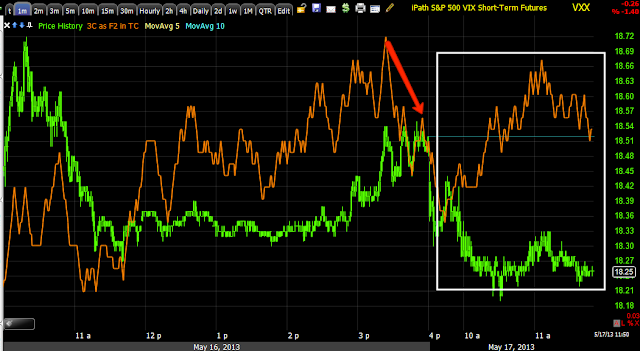
And in after hours, VXX- VIX Futures are bid on the same positive divergence I spoke of earlier. getting ready for next week/Monday?

Why bid protection after a SPX close like that?

I can honestly tell you, I wouldn't have bought that breakout which was obvious Thursday as the first one failed, even knowing I'd have made some money if I didn't sell at the ROD, which clearly most did not.

The risk on a gap Sunday or Monday against that position, as obvious a set up that was, is enormous.


One Minute After the Close, Yen Futures Jump Up

I can't believe anyone would buy such an obvious set up, it was obvious yesterday!

Weekly Wrap

We're already at an extreme market, this week however we saw things that I don't think I've seen too many times or places, some of them we have when AAPL collapsed.

Almost EVERYTHING this week was predicted ahead of time before it happpened, that's why I'm putting together a weekly wrap instead of daily. Take yesterday for exxample, the large SPY triangle that totally failed, before it even tried to breakout I posted, there are no significant reversals without a head fake move first-if you don't understand why, see my 2 articles, "Understanding the Head-Fake Move.

Yesterday totally failed even with help. Today's triangle was much smaller, on a Friday afternoon when volume is lower as most traders are already in the Hamptons. Everything they could use to get the breakout moving was used, what they are looking for is a bull trap, they need retail to bite and based on the Twitter feed, they were all looking at these same things we were, they just don't realize these are the setups used against them.

In weeks past retail hasn't bitten, there was a good resistance line today though, the triangle was right under it and they bit today.

Example...
 SPY triangle/breakout-check volume.

DIA breakout, check volume

Some people call it churning, some a bull trap, some a failed breakout, I call it a head fake because that is really what it is, those traders are locked in, Monday or Sunday's futures open gap down, and someone's in real trouble, but it's not chance I'm talking about, it's everything this week.

I didn't even care the market was down yesterday, it was how the market reacted during the day, the week that told me the most, price isn't telling you anything everyone else doesn't already know.

So I want to put together not only analysis from the week end, but a timeline of what we expected and why this week and then what happened.

Look for the post-it will take a while, other than that, enjoy your weekend and watch the WSJ for some perhaps surprising news.

TICK Chart

I'm glad I spent some time this week and last week building positions, I would have loved to see this week's put fire off, but that's why they are spec size and spread-now all June on new positions.

With the way everything is looking, I'd feel a lot better being positioned net short come Monday than Net long, remember these gaps take out 2 months of longs on the open.


The NYSE (all NYSE component stocks) TICK shows the number of advancing stocks less declining, it was trending up with the move, then broke the trend and now we have a growing number of decliners over advancers, not good with negative divergences in place to end the day

Q's Should be Next

AAPL which is about 20% of the NASDAQ 100's weight just couldn't get it together, it doesn't look like it will offer the Q's any reprieve.

 AAPL intraday had the gas to make the move, it was just sold in to any where near green. The second chance just fell apart.

The bounce cycle of the last 2.5 days, accumulation, bounce, distribution and there's nothing there left to support AAPL.

Therefore the intraday QQQ chart showing selling in to the run up-retail bit as I said earlier, should bring the Q's down as well.

IWM Being Sold Into

It's not chance that the flight to safety TLT is being accumulated at cheaper prices and the IWM is being distributed at higher prices, no coincidence at all.


TLT Update

For those of you interested in TLT (I don't like the profit potential unless you are leveraging it), it's in good position, the gap got filled, the head fake move was put in as it broke the trend line where it saw the heaviest accumulation of the day and the "process" is about the right length. If you like it, I don't see much reason not to consider it long here.

This is intraday only, but at least you know the pullback was accumulated and not sold. The longer term charts look good as well.

This is how predictable and this is why they got the volume

This from a member...

"They were all expecting the breakout and were long, even citing the "break down" in TLT.  Nobody is short at least on my feed."

Of course they were, a I said yesterday, the triangle is the most recognizable pattern for any beginner in TA, this is how Wall St. uses TA against traders.

They fell for the triangle, they fell for the breakout-they cited TLT which just had the strongest 1-day move in 5 weeks yesterday, but today's gap fill was bearish, the TLT longs that have been there for months all of the sudden changed their minds. 

It's like fish in a barrel for Wall St.

Now ask yourself, was Wall Street trading with retail?


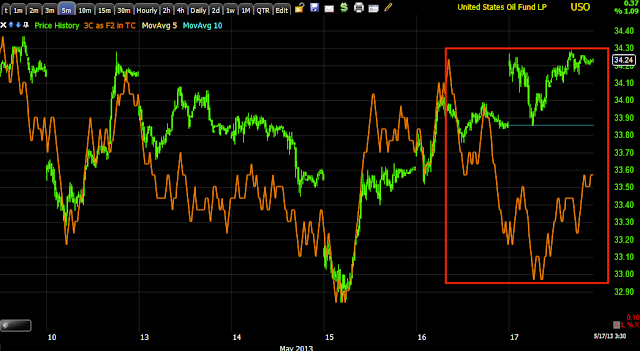
USO Short Interesting Here

I chose SCO long (2x short crude), but either SCO long or USO short are looking nice here. $USD strength won't help USO/crude oil.

 Intraday 1 min today selling

2 min shows the same in the same place.

 Longer term trend is also negative at 5 min and beyond that...

60 min shows the entire cycle.

BEAV Interesting

I like this one, I'd prefer a partial position here as there's a gap around $64.75, but this one looks nice and one I already have a short equity position started in. It has completed a head fake move, it has no participation or relative strength today, I think this is in a pretty good area to consider at least a partial position, maybe leave room to add around $64.75, but there's no guarantee you'll get that move.

First Break of the TICK

They got the volume

I said earlier the resistance of the last 3 days in the SPY was where retail would buy, they bit the hook.

Now they got what they want/need-watch the trend on the intraday NYSE Tick, as soon as that trend breaks, down it goes.

Market Update

In to the market move out of the triangle, the QQQ and IWM are showing the first and heaviest intraday distribution in to the move, I'd say DIA is next.

The VXX/UVXY which helped this move with the downside movement are starting to accumulate and find their bottom so this is probably not a bad place to look at those as an equity long.

HYG, as expected is being sold in to it's intraday move up.

TLT is finding or has found support with accumulation continuing.

The Yen's futures are starting to lead positive so it looks as if it found its legs.

We have an hour and these assets that made this possible are all in the process or reversing to a market negative stance, so what happens in the next hour should be very interesting and perhaps a trade or two.

I'd definitely want some long equity exposure to VXX or UVXY at this point, for a short term trade.

HYG I don't think is worth it, there are some leveraged EFTs for TLT, bit on its own, not worth it.

It's really what the risk assets and averages do that set up the opportunities.

AAPL is worth watching as it tries to go green again, there may be a nice put set up there.


Yen is finding support-now it should get interesting

Market Update

Well if today wasn't predictable, I don't know what was, from the op-ex pin holding the market still until most of the contracts are closed by 2-3 p.m. to the Friday op-ex afternoon break from the pin as most contracts are closed, that alone was incredibly predictable.

The first triangle which was larger failing yesterday and a second smaller triangle forming today was predictable when you have this juicy resistance line retail tech traders are watching.

 Daily resistance line is a perfect place for a head fake move as a break above the resistance is where retail will buy and where smart money can dump.

The triangle, but it needed the Yen's help to do anything...

Yen (green) vs SPX intraday

And to knock the Yen down at exactly the same time HYG moves up, TLT moves down and VXX has been moving down, the USD/JPY is used...

But this is not going to last long, it's amazing what a tiny move was needed, there's a negative in place here that will be sending the pair down, that's due to Yen accumulation.

Yen is under accumulation today, but that small move down in yellow is all that was needed from the Yen.

As for HYG, VXX and TLT
 HYG 1 min is a very weak divergence, but it is an intraday timeframe and moves assets intraday, that is the HYG divergence and HYG up is market supportive...

The slightly bigger picture in HYG (not even that much further-is very negative and it is getting worse-so HYG will be heading down.

 TLT as I mentioned was and is under accumulation, but recall I said it was like a mini inverse H&S and a pullback in this area would be perfectly normal, well that pullback is market supportive, by itself it would have done nothing, but with the Yen, HYG, and VXX ALL moving at the same time, that's what the market needed to give it a boost-this is not demand, it's arbitrage manipulation.

VXX's move down is also supportive, although it seems to be finding some support.

The Yen looks like it too will find some support and we'll have to see how heavily they sell HYG.

This is where the real information is, on this move that is not demand driven, but total manipulation and about every asset that they could possibly use as a lever was used.

I'll update the result...

AMD (long)

AMD long was a nice set up, it was a great move, but I'd hold off on entering right now. I do believe AMD put in a large enough base to support more gains, but this volatility will have to die down, gaps filled in and I'm sure it will make for another great long trade, but I'd be patient here.

TLT

I had several emails about whether TLT would be a buy early this morning as it was moving down, as I try to show, a reversal, even a 1-day reversal is a process and not an event, that's why TLT needed to turn lateral, a move from down to up (a "V" reversal) is very unlikely, I'd say maybe 1 in 300, but if you look at TLT intraday you will see the decline from yesterday and the rounding today or lateral movement is about the right size for the decline.

Accumulation continues in TLT, this could have been a gap fill, it could have been to equalize the ground HYG was losing to stabilize the SPY for an op-ex pin although I doubt that, but possible as HYG was showing heavy distribution yesterday.

In any case, I'd feel comfortable phasing in to a TLT position right now, depending on the trade either in 2 or 3 parts, but more likely 2 parts.

I'm not sure bout a call, although if we do get a crack, TLT will fly as we just saw the biggest move up yesterday in 5 weeks and it was under significant accumulation the days leading up to yesterday so a call out to June or so may indeed pay off.

I do like what I'm seeing for those of you who asked. It just needed some time.

AAPL

AAPL still has some short term INTRADAY gas in the tank, but the first run off an earlier divergence ran in to sellers right at yesterday's close, the 3C distribution is evident. The 3 min chart that was positive has fallen apart pretty badly so I'd say if AAPL can put together any afternoon momentum, it will almost certainly  be a gift for anyone looking to enter AAPL short equities, as for Puts, I'd like to see some real upside momentum, but all in all, this is just a temporary blip as AAPL will be heading back to its primary downtrend.

Market Update

Still the SPY Arbitrage hasn't moved, although it's 30 mins delayed. As to the assets in the model, there's some movement there, I'm a little surprised the market hasn't done anything with it thus far...

SPY hasn't done much-yet, but the market was quiet for a while so I wouldn't call the game yet.

Yen/SPY correlation is helpful for the market...
Yen is dipping a bit, they're pretty close though.

Here's the Arb. assets, which I have expected some more upside action...

 As expected TLT pulled a head fake move under support, it did get some stops and look at the accumulation of stops, I also said earlier, to accumulate it needed to head more laterally-sideways, it has done that as well, but it looks like a mini inverse H&S so a pullback here just as normal price action at the same time as HYG and VXX moving would be helpful for the market, even if it was short-lasting which I'd expect any move out of the triangle to be and under distribution.

 VXX has a small intraday negative divergence within the larger leading positive, in my opinion that is NOT coincidence considering the triangles and the other assets and Yen threat.


 The VXX 2 min is in line so the divergence there was small, just enough to turn it intraday.

HYG does have an intraday positive divergence at a relative area of support so this should be helpful to the market, with VXX down a bit, that's more help.

Finally the USD/JPY is moving up, more short term support for the market, lets see what it can do with it.

URRE- Update

I'm going to be posting a lot of updates in a short period of time to try to cover as many as possible.

The URRE long we took profits from on a nice move (depending on positioning, from 10 to 30%) was so we could pick up URRE on a pullback, in my view and from the charts, we are not there yet. I'm guessing we'll probably start seeing the signals to enter around the $2.20-ish area.

There's nothing that needs to be done right now.

AAPL is coming to help out- This "May set up a Put

If AAPL gets enough upside momentum and if the signals go negative on that move, then we may have a nice put trade, it can also be used as an equity short which I prefer for the longer haul.

The divergences sending it up are intraday, nothing very strong.

Charts

I can't get all the charts I'd like to out and still get to the analysis, but here's an idea, again like yesterday which I was looking and actually hoping we would have a false breakout as that would have done a lot of damage today, we have more triangles forming, this time smaller, I'm not sure why, perhaps because they may be easier to break out, perhaps they don't want to invest as much (short term) to building the triangle and head fake move, perhaps because they need a head fake move before the close, or ...?

TLT is doing what I said and expected thus far and I'll show a few others...

Index futures aren't tipping their hand as they are in line except for the IWM futures "TF", they are negative. The Yen is interesting and may have something to do with a rushed triangle "if" this forms a head fake move.

 SPY-yesterday's larger triangle and today's smaller

SPY 1 min, I noted all of the divergences as this is an intraday signal timeframe.

The larger picture is on the 5 min (first institutional timeframe) with a leading negative divergence, but VERY sharp.

Take a look at the Yen v. SPX
Yen in green-both are very flat, but the Yen may be getting ready to change and this may be the last chance for the market to make a move before that happens, I'll show you the Yen again after the other assets.


HYG, intraday has been negative, but could this be a positive intraday divergence? I can't say as 3C hasn't locked it in by turning up.

However if there's need to make a break from the triangle to establish a bull trap, they'll need HYG moving up to support the market.

 HYG 5 min positive to negative and the entire divergence being destroyed longer term and more importantly, on an institutional underlying timeframe.

 VXX is still accumulating 2 min intraday (market negative as traders are bidding up VIX futures to buy protection).

VXX 3 min as we need to see migration is migrating, we have 5 min as well.

Now the 3C Yen futures... If the Yen is getting ready to make a move higher, it will be market negative as we have clearly seen. We know longer term the Yen is, we know its in a rounding base more than half way complete, now take a look at Yen futures.

 Green arrow is the 9:30 open, to the right we have intraday accumulation, but more importantly...

As the Yen itself is in a triangle, we have 5 min accumulation and we already know we have abase about to turn up...

I'll be posting more as I get it, but movement would be good, movement creates opportunities.


Very Quiet Market

You know what I think about quiet markets, they are like kids too quiet in the room next door, they're up to something.

I do see triangle in the SPY, DIA and somewhat in the IWM and lesser or more distorted, the Q's.

I'm going to post some charts real quick and then take a look around, I know it's an op-ex pin day and these tend to act like this, but with everything else that has happened this week, I want to try to be sure there's nothing moving under the surface that isn't obvious in price or the normal assets.

One chart post coming...

TLT Follow Up

Just as I post on TLT, the first thing I looked at were 10-year treasury futures and noticed 3C was starting to give a positive signal, so I jumped to TLT and this is what I came up with...

 10-year T Futures started showing their first positive of the day.

30 year T Futures also started showing their first positive of the day.

TLT as I said in the last post, was likely to break under the trendline, this is a stop-run move-a type of head fake, but it doesn't look like they picked off too many stops.

 Then the 1 min chart goes positive at the break of the trendline as typically happens (although they are usually trying to hit stops to accumulate in some size on the cheap).

And we have the start of migration through the timeeframes at the 2 min chart.

This is still VERY early in the process, I say process because a reversal is a process, not an event. Even looking at the divergence to send TLT lower in to the gap yesterday was a process that lasted nearly the entire day if you look at the 5 min TLT chart from the last post. However, this appears to be the start of something that is important to know.

TLT, HYG and VXX- the SPY Arbitrage Assets

Looking at the SPY arbitrage this morning, there's no clear trend in it, I can tell you from looking at the 3 assets that comprise the model, HYG, TLT and VXX that it makes sense. First HYG which would send it positive is losing ground, again as I suspected, any price gains in a risk asset like High Yield Credit are being sold in to immediately, even though as I said HYG has more gas in the tank and will likely head higher as it did yesterday, the same thing happened yesterday as earlier in the week, it was seeing distribution immediately, smart money doesn't want to buy or even hold risk.

With a falling HYG, only a falling TLT would neutralize that, we saw the divergence to send TLT lower yesterday, perhaps it was an effort to try to manipulate SPY higher, with TLT lower and HYG higher, it would be market positive, but HYG is losing ground and that seems to offset TLT losing ground which I think is a simple gap fill as HFTs leave no gap unfilled.

VXX (VIX Futures-short term) become the wild card, so lets take a look at all 3...
 The SPY Arbitrage model has no discernible trend, this is because assets that make up the model are not moving in one direction for a trend, they are moving against each other.

 HYG as I suspected and wrote about, did have gas in the tank for another run higher, but like earlier in the week, distribution of higher prices was almost immediate, that doesn't mean an immediate reversal, these are large institutional positions and not only may they be selling long exposure, they may be building short exposure. However now at least my theory from before HYG even moved up, that it would be sold immediately as there is strong risk aversion has been proven right both times we had a chance to see it this week.

HYG is losing ground today as well, this effects the SPY Arb negatively.

 HYG 3 min shows the positive divergence that led me to say "There's still gas in the tank for a move higher", although on a very weak timeframe, again that divergence is being torn to shreds by the distribution, as you know, divergences migrate if they are strong enough to the longer, more important timeframes.

 Now the 5 min positive which is as far as HYG's positive went is seeing the 3 min negatives migrate over and starting to destroy the "Gas in the tank", I suspect this continues today and HYG shortly continues it's move down.

The divergence between price of HYG and the SPX is already well past what we have seen in the past turn the market lower, but those were turns lower of several months, I believe the deeper divergence now reflects the deeper nature of the problem for the market.

TLT-20+ year Treasury Bond Fund
 Note in white a bullish candlestick reversal called a "Harami" or as the Japanese call it, "baby inside mother" or as we call it, an "inside day", also note the second day of the pattern was also a bullish upside reversal "Hammer" as well with higher volume making it more dependable. TLT made a 5 week 1-day high on the gap up, but as we see, all gaps are filled now-a-days so it's not surprising that it filled today with a long upper wick yesterday as well as 3C divergences suggesting a gap fill, the divergences aren't large enough to represent too much more than a gap fill.

Here's TLT intraday filling to the closing gap, "All reversals see a head fake on the turn around", TLT saw one on a stop run just before reversing so I would not be surprised or alarmed to see TLT below the trend line, but it does need to start moving more laterally to accumulate.


 TLT 5 min 3C chart shows the divergence yesterday in red for TLT to drop lower today, it was posted several times yesterday and last night, we do have a relative positive divergence which is a start, but still weak so I don't think TLT is ready to turn up, it needs more in the "Process" category, but I'll keep an eye on it.


VXX headed down a bit which would be supportive for the SPY (arbitrage) if HYG hadn't lost ground, between the three, they are almost canceling each other out. However, VXX (VIX Futures) is showing accumulation of this move today.

 VXX 2 min

VXX 5 min

This is the Yen (green) vs the SPX (red) inverse correlation we documented this week, it's for the most part in line. Yesterday, especially at the 11:30 move for the market to break out of the triangles, the Yen fell, allowing the market breathing room to make good on the upside breakout, but even with that and SPY arbitrage working for the market it could not make the move, I suspect it is the same as we have seen all week, sellers and not the normal sellers, this is the hedge fund herd moving in an every man for himself way, like AAPL's break.

Again today the Yen gave the SPY an opportunity to gain upside on a Yen decline, the SPY couldn't capitalize off it.

Of course this can be op-ex pin related, but being we've seen this all week and getting worse, I have to wonder.

One final thing possible, although I think unlikely, is the VIX/Bollinger Band, sell equities/buy VIX set up.

The VIX would have to close below the Bollinger Band and then pop back in to the channel, you have the market sell signal on that set up, but one other thing of note is the BB's compressing again, this leads to a highly directional breakout move-last time to the left we saw a couple of head fakes, then a directional move up. I do think it's interesting the BB's are squeezing again in this area as internal action has deteriorated significantly.

This is an extreme market, we don't see these very often, but it's also an unprecedented market, we've never seen this kind of globalization, this kind of global economic down turn and most importantly the F_E_D's moves since 2008 and hundreds of other Central bank actions, I believe we are up to nearly 500 worldwide since 2007 on the easing side!

We are trading a market with no historical comparison, this is all new territory, but some things won't change, such as human nature-Fear and Greed still dominate the market.