Tuesday, November 15, 2011

EU BANKS RE-CAP WITH A SHELL GAME

There is no end to the bad judgement of the EU and regulators, in this following article, basically the banks which have come under increasing scrutiny here in the US for marking level 1 assets (those with a market value) to level 2 assets (those that derive their value from the bank's internal models). This is an accounting gimmick to make underperforming assets look better then their market prices by marking them to an even better looking model and investors in the US have picked up on it in recent financial company earnings and those companies have been seeing some downside as a result.

In the EU, as we have talked about many times, banks must raise their core capital ratios in preparation for a meltdown, we have talked about why they don't want to do it, how they have sold all asset in a bid to not have to issue shares and now they are engaging in the same shell games that US banks have been using, by revaluing assets through models to make their core capital ratios look better. The end result is they may "look" better, but ZERO has changed and they are just as dangerous or even more dangerous as a result.

Here's the article

It's just another sloppy European wall paper job to try to cover an ugly reality that is ever increasingly becoming more unmanageable as reality sets in, THERE ARE NO QUICK FIXES, THERE ARE NO FIXES THAT WON'T INVOLVE A LOT OF PAIN, but that hasn't stopped the EU from engaging in these meaningless charades to try to prop up the EU for another day.

It became all too clear when the EU took a multi-year problem and found a quick fix in 4 days (something that had eluded them for years until the G20 gave them an ultimatum) and they called it "leveraging the EFSF" to over $1 trillion dollars, unfortunately for them, everyone sees through this garbage and that is why they have had a difficult time credibly raising even $3 billion Euros of the 1 trillion Euros needed.

I think one of their main problems can be found in their advisors, the same group of US Investment banks that started this entire problem through sub-prime in the US.

It's absolutely petrifying to think of the global ramifications as they move forward or backwards as the case may be.

Now ES/EUR Correlations reverse bearishly

 After the close (red) the EUR got a bounce, which should have lifted ES in AH.

 The ES 3C negative leading divergence

The red arrow is 4 p.m., instead of following the EUR higher, ES lost ground and then went flat. There's 30 minutes of missing data at the end of the chart so I'm not sure whether ES follower EUR down since 5 p.m.

Market Action Unfolds with the Intent to Deceive...

Too good to be true? The plain simple fact was that most people simply watched the S&P, Dow or NASDAQ and their moving averages and didn't bother to look any further in to the situation and simply assumed, "It's rally time".

Even a cursory glance at a few simple indications revealed major inconsistencies and likely major problems with the latest sugar high.

When the EU breaks good news and the US markets respond better then the EU itself, you must have a hint that something is not right.


Here we are as of the close and in to AH...

 DIA 3C chart refused to relent on a worsening leading negative divergence the higher the DIA went, someone was selling lots of shares and shares short.

 The amateurs trade the open, the pros trade the close, that doesn't speak well for the DIA-checkvollume and the extent of the snowball effect, I'll have to check if a technical buy level was hit that caused the snowball in to the EOD.

 IWM nearly hitting new leading lows on the day as price hit new highs, that's a divergence anyone can see means trouble.

 And the IWM into the close-the blue hash marks to the left of price is the AH bid / ask so the carnage continues in to AH trade.

 The QQQ in a leading negative divergence and making consecutive new lows-RED FLAG


 THE Q'S retraced 1.5 hours of parabolic rally in 15 mins or so... FEAR IS STRONGER THEN GREED.

 The SPY held out the longest on 3C, but ultimately the locals sold hard.

 And look at that retracement, more then 2 hours of already parabolic rally reversed in 15 mnutes on heavy volume and it's still selling off in AH

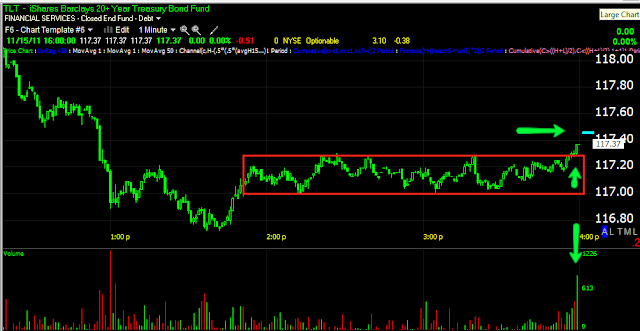
 TLT, the safety haven trade saw buying on volume and is even higher in AH.

 As for ES, it happened fast, but when it happened, it went leading negative .

Here's the 4 p.m. close in red, ES continues to sell off and the volume thus far in AH, is bigger then the average volume through the day.

I had a feeling something was stinking.

Some Surprising Others

 Just checked on TLT-Treasuries again to see if they gave up any ground, and still none. The importance here is that treasuries move the opposite of the market, when the market goes down, they are the natural flight to safety trade, yet for the last nearly 3 hours, they won't let go of them.

 XLE/Energy has a substantial presence in the market and the S&P, the fact it topped at the earlier market divergence and won't budge is strange as the group accounts for a large segment of the market. Furthermore they saw a churning volume spike/candle and volume has dropped off from there.

 While this doesn't appear to be a big disconnect, Financials, nearly the backbone of the S&P have not moved any higher since the first market divergence, this is very strange when the comparison symbol is for the S&P-500.

Utilities? Well I don't know how whacky this is, but again, they refuse to move above resistance while the SPY is just doing it's own thing.

The credit though is perhaps the strangest, that and Financials , followed by Energy.

A Frothy Disconnect

Every day we get to see something new, here's today's very frothy disconnect.

 This is the Euro in green vs the SPY, note how flat the Euro is, it should be almost a perfect correlation, but the SPY/Market (red) has run way above the Euro, it seems the market is more excited about Monti then Europe is.

 Credit leads equities... then look at the disconnect between HYG and the SPY (red), in a risk on trade, HYG would be right up there or leading the market, you can see the recent normal correlation to the left.

 And US treasuries, which should be hitting new lows on the day according to the market are not, it seems there's some reluctance to let go of the safe haven trade in exchange for equities.

Even XLE/Energy took a much bigger dip then the market.

 And the short term chart are not relenting, they were willing to follow at the start, but only so far-DIA

 DIA

 IWM

 Look at the Q's!

And the SPY...

There's definitely something very frothy in the market and SPY in particular.

Momentum seems to agree

Both MACD and Wilder's RSI are considered Trend Quality indicators, meaning to confirm a trend's quality, they should follow it by making higher highs with the trend, when both MACD and Wilder's RSI are moving in the opposite direction of the trend, there's no confirmation and the trend is not likely to last.

Of course this is short term trend analysis, but taken with the last post, I think it's important to see. The MACD Histogram is in blue and Wilder's RSI is in white.

 DIA

 IWM

 QQQ

SPY

Update:Italy/Market

That last move up definitely seemed to be a lot more then a technical push off a linear regression channel after it made a new high, and the catalyst...

 "Italian Prime Minister designate Mario Monti will meet Italy's President on Wednesday morning to inform him that he will be able to form the country's next government, a statement from the presidential palace said on Tuesday."


Still the sugar high seems it won't make it much longer...
 DIA

 IWM

 QQQ

SPY

The Euro as a Short Trade

It's pretty hard to make money trading currency based ETFs as the moves are not all that big, if you are trading the FX market, it's a different story due to the leverage, but there is a leveraged Euro Short, EUO and it may start making sense soon.

The macro trend is where it is very interesting, this is something I have mentioned over the last few months in the $USD (according to traditional FX arbitrage, it would have negative implications for the market).

Lets take a look at both EUO and the Dollar Index.

 Here's EUO (Euro Ultrashort) on a 4 day chart as this reduces noise, as I showed you in the last post  regarding technical levels, the Euro looked very toppy in that large channel and in fact had broken down from a top on the daily chart, EUO would be expected to look the opposite of the Euro and it does have the look of a base as well as a surge in volume and a positive divergence on a long term 4 day chart.

 The 3 day chart also shows the same positive/leading positive divergence.

 And the 1 day chart confirms the same.

 Since EUO is a short on the Euro and the Euro moves opposite of the dollar, the $US Dollar Index should look similar to EUO.

Here's the Dollar Index
 Here's a longer term 2 day chart with a very strong leading positive divergence, much bigger then the 2008 positive divergence that sent the Dollar up approximately 25% which is a large move for a currency in that short of a time period.

The daily chart which I have featured over the last several months also seems to be putting in a stronger positive divergence then 2008 and it in fact looks like it has already started moving out of the base, which would make sense according to the daily chart of the Euro which had already broken down from a daily local top.

The idea will be to look for a low risk/high probability set up in EUO, I think the long term charts show it to be a good trade strategically, now if we can just find a tactical opening.

Channel Buster

Why the idea intuitively seems bullish, historically it has been an indication of late trend volatility or the spasms of a market in its last push.

 This is what a channel buster looks like on a longer and more important scale, that was also the top and price haven't recovered past that mark, they instead almost instantly fell to the bottom of the channel and at some point usually fall below the bottom of the channel.

Here's today's in a short term counter trend move.

When I was day trading, these were the kind of set ups that we'd run scans for, a stop can be put relatively close and they typically would see a quick reversal like you see in the chart above immediately following the break of the channel.

Market Update

Short term negative across the board on what seems to have been little more then a technical push.

 DIA 1 min

 IWM 1 min

 QQQ 1 min

 SPY 1 min

SPY 2 min

That last push may have been the last push...

Technical Levels

 Some technical levels are coming in to play as the DIA hits the bottom of its short term linear regression channel it has bounced off that level, it filled the upside gap, the downside gap in green still will offer temporary support.

 The IWM hit the same channel bottom and bounced off that, it is also at the bottom of the gap support and has broken through and seen a modest bounce from that level.

 QQQ just seems to following the broader market.

 The SPY is also near last ditch gap support.

The more important technical levels seem to be in FX-EUR/USD

 $1.35 is the level the GS is said to have a stop, which would generally mean that they are betting against their own customers and buying there as their customers who received the trade are stopping out. We don't know for sure, but it is seemingly GSs game to bet against their own clients.


 On an hourly chart the Euro is close to support as well near the $1.35 level, that also being  whole number will attract stops and limit orders as a pure function of human gravitation toward whole numbers.

 The longer term daily shows 5 points of contact here and what appears to be the Euro heading down, which is what would be expected from a pattern like this.

This is a close up of the chart above, at the last point of contact, a bearish descending triangle top, which broke resistance and failed on a head fake in the red box and has since turned down. The longer term technical picture for the Euro does not look good.