Monday, November 4, 2013

TBT Short / TLT Long

To try to make this easier, essentially the warning about the GLD/GDX from last week looks like it is spot on, I looked at both as short term positions, but as I had said in the warning, they are for pretty aggressive traders.

TBT on the other hand looks a bit better, it has lower volatility and lower risk for a short duration position.

As you may recall, the long term TLT (20+ year Treasury) position looks good for a long term trade, however we had signals for a pullback in TLT and thus have been standing by after having closed TLT longs and even opened a TBT long which is the inverse of TLT, but 2x leveraged (like being short TLT with 2x leverage). This is a position that is probably around a swing position in duration, maybe a bit longer, however I decided to trade around it with the lower risk.

TBT long was already at a profit so that was closed as of the last post and entered as a short position which would be like a 2x leveraged long in TLT, there just isn't such an ETF with enough liquidity. The TBT short entered will be a short duration position, I can't say for sure, but I'm thinking 1-2 days) at which point it would be covered (as long as we have the signals which I'm confident we will have) and TBT long (short TLT 2x leverage) will be re-opened as TLT continues its pullback.

*In fact the bold text above fits pretty well with our

The larger picture is to let TLT pullback, hopefully to the $100-$102 area at which level it looks like an excellent longer term long position. This TLT pullback and targeted long at $100-$102 has been our position for a while, it's nothing new, but after 3-day pullback (since the F_O_M_C policy statement), it looks ready for a short term bounce before resuming its pullback.

Really none of the above is any different than the GLD/GDX/NUGT analysis from last Friday or the 2 posts today.

This "should" also help with market action in the Daily Wrap, although the broad strokes are there for you already (they haven't changed in more than a week) as shown in this post, "***Market Update".

I'll have to confirm shorter term intraday/very short duration market action, but the longer the chart in the linked post above (***Market Update) the higher the probability and stronger the move associated with that probability.

Here's the P/L for TBT and the charts for 30 year Treasuries (similar to TLT) and TBT...


The P/L=+3.16% which is not what the trade was intended for, but I'll be coming back to it.

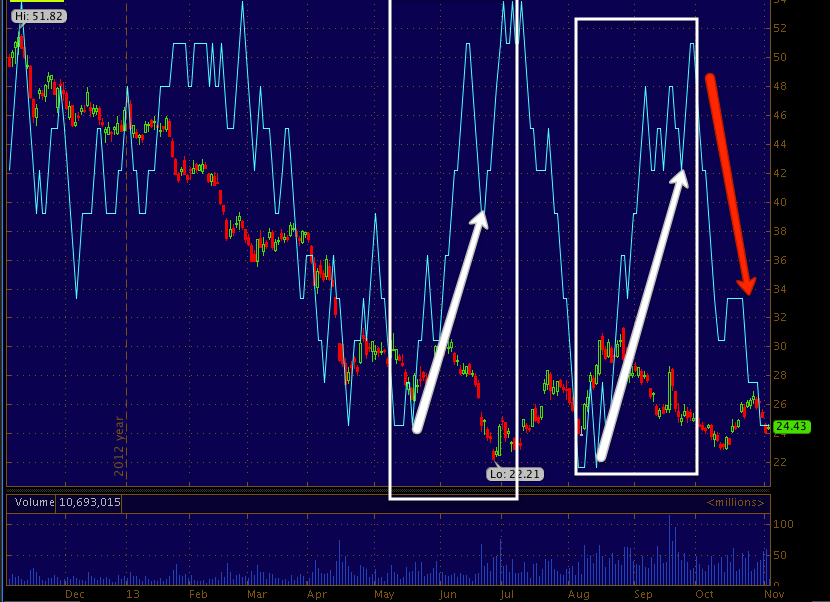
30 Year Treasury Futures (which is similar to TLT "20+ year treasuries")
 As you can see on the description of the symbol "/ZB", this is the daily chart of 30 year Treasuries...
with a very strong positive divegrence, this is similar to the long term strong positive in TLT and the reason I'd like to be long TLT around $100 on a pullback for a long term position.

The 4 hour chart shows the same accumulation and a pullback like TLT.

At the 30 min chart there's a positive divegrence that suggests a bounce in TLT, this among other reasons like TBT and TLT charts is why I closed the TBT long (2x short 20+ year treasuries) and decided to short TBT instead so essentially it is like a 2x long TLT position for a very short duration bounce). I fully intend on returning to the TBT long until TLT is in the $100-$102 area.
 This is the 5 min chart of the same that looks ready for a bounce after 3 days of moving down.

This is the TBT 60 min chart, it shows the reason why I like TBT for a decent TLT pullback and the reason for being long TBT over a longer term (TLT pullback)

 This is the 30 min chart and you can see the positive divegrence for the long entered, but recently a little 3C softness.

 The 15 min chart is in line

And the 3 min chart is showing a pullback in TBT is likely, this is reason for selling TBT and going short for a short duration trade.

This is the sme on the 2 min chart.

I expect a short term TBT short on a TLT bounce before TLT returns to a larger pullback.

Essentially this is no different than Gold if TLT was gold, the same pullback idea, the same very short term bounce idea and long term bullish idea.

I'll have the Daily Wrap Out Soon

I'll have a TLT/TBT post and the daily wrap out soon, the TBT/TLT post first. I have to wait on Worden to update their missing data and in the mean time my wife just checked in to the Emergency room, but I will have the post out within a few hours.

Closing TBT long and opening TBT short... Gold, GDX, NUGT, TLT

As I suspected, it looks like we will get a move to the upside in gold, GDX, NUGT, nothing though about the analysis has changed.

However 1 position I do think I will make a change to for a short duration trade is TBT long (20+ year treasuries short). Since TLT long doesn't have the lelverage, I'll go with TBT short which is a little convuluted, but the only way to get the leverage and I expect this to be a short duration position.

Market Update

It looks like the earlier TF intraday chart that was starting to go negative is seeing more confirmation.

I want to be careful with intraday charts until after the close as there's about 2 hours of information missing from this morning until the close when it is filled in, but so far the intraday QQQ, IWM and SPY (1 min which I can use as enough time has passed to give a clean trend) are negative.

I'm checking on some of the more important risk assets like credit, rates and especially the QE sensitive assets.

I'll have another update and if it looks like the coast is clear or safe enough for a position, we'll look at those, but I don't want to get caught in positions in price chop.

***Market Update

This is a comprehensive market update and is pretty clear, this is not an intraday update.

These are the the Russell 2000 futures.

 This is the longest of the charts at 1 day, I think the divergence is pretty clear, it's much larger than just the last cycle.

This is the 60 min chart, it does include the last cycle, the negative divegrence we saw at the top market wide starting very heavy around the 18th and in yellow is the area last week I suspected we'd see as a "Wide Choppy Zone". 3C on this chart is still depicting a leading negative divergence.

Friday I talked about this at more length and even drew in an estimate of what such a zone would look like, you can find that post here. And the chart that I drew in last Friday is below.

This is just a guestimate based on Friday's charts, but so far pretty accurate.

 This is the 30 min R2K futures with the negative at the top of the cycle sending prices lower and the smaller positive which is what led to the assumption of a move up creating a wide choppy zone. I believe it will be temporary before a continuation of the trend rolling over to the downside, but we'll confirm with current charts and indicators.

This is the 15 min chart with a positive off the lows and the bounce from there.

The 5 min chart is in line with price thus far and...

The in min chart is where a new divergence for a move down would start and move to longer charts like a 5 min/15 min etc. This is a negative intraday, I can't say for sure it is a negative that will turn price down and create the down stroke in price that defines the Choppy zone", but it is getting larger/


So far this is in line with expectations based on the charts and expectations were laid out well before price moved so thus far I don't see anything of concern, but we'll keep checking indicators and opportunities, choppy zones are not easy zones to trade typically, but they are often short duration.

GDX/NUGT

I'm covering GDX/NUGT as well as just having covered GLD/gold as they seem to be among the most popular trading vehicles right now judging by the email requests I get every day, but after this I need to move on.

My opinion of positions in GDX gold miners) long or NUGT (3x long gold miners) are not very different if any different than GLD. If there is a larger base for a bounce in any of these that makes it a more stable position, than I may change my mind and consider them as a short duration trading position.

If of course there was to be a much larger base development in the area, then I'd be looking at the possibility of the pullback signals having completed, but at this point I think that is the lowest probability based on the objective data and confirmatory data that we have.

This is the 1-day gold futures chart. This chart is almost reminiscent of an old time record player stylus or turn-table needle. (I can't believe I said old time as I grew up with these and 8-tracks followed by cassette tapes!)
 There seems to be 1 solid point of positive contact on the gold futures chart as you can see.

Gold miners don't seem to have the same size divegrence, but they do seem (and have for a time) to have a wider, more stable base area.
 This is the daily chart of GDX on the same platform. Notice the two areas of leading positive divergences as well as the red arrow that would be consistent with the recent "pullback signals".

 GLD and GDX have a fairly tight correlation recently so analysis for one is very close to analysis for the other, I think the biggest difference at this time is the 2 charts above and the look and feel that GDX has a slightly more stable basing area which should be corrected on the pullback we expected and thus far have seen.

 The GDX 2 hour chart which is quite significant also shows these two areas rather than 1, more clearly.

 The GDX 30m chart shows the more recent of the two areas, positive with the pullback signal seen in gold as well.

Typically when we see a chart on the longer side of the timeframe scale like a 30-60 min chart with a positive like this and then a negative following it, most often it turns out that the pullback is CONSTRUCTIVE, meaning that it usually sees deeper/stronger accumulation which creates a larger/stronger base that can support a larger/stronger and longer upside move, THIS IS THE UPSIDE MOVE I WANT TO PLAY LONG IN GOLD/GLD/GDX OR EVEN NUGT AND WHY I HOLD NUGT LONG AS A CORE LONG POSITION.

 GDX 15 min shows the same pullback signals that we expected and a pullback as we expected, however once again the positive divegrence just preceding that signal is clear as it is in longer GDX charts and gold/GLD.

 Even a more detailed 10 min GDX chart shows the exact same and like gold, we have near term or short term positive activity which I believe can lead to a "misleading" move to the upside or perhaps just a consolidation.

Again when I say "misleading", the only reason is as you know I have expected a constructive/positive pullback in gold and miners, a move up from here on such a small base/positive divegrence could certainly give the impression that the overall pullback is over and that is why I urge caution and why I warned we might see something like this in the quoted text I have pointed out numerous times the last couple of days.

 NUGT on a 5 min short term chart displays the same signals as GLD, gold and GDX and therefore offers good confirmation. It also shows the same short term positive activity and a gap above that could be an easy target for a bounce. 

It must be noted that the warning of "Deceptive behavior" was a "possible" warning. Either way, whether a bounce or just a consolidation, I do not feel comfortable with a long Gold, GDX or NUGT trade here and that's why I have said I think they are for more aggressive traders.

This NUGT 2 min trend may be a little to short for today's activity, but the past activity is unaffected by any data glitches this morning.

The same pullback signal is present as well as the same positive activity in the same area, on a 2 min chart it looks more impressive, but that is just because the shorter charts are more detailed and their signals mean less than longer charts.

My opinion remains the same, unless there's a stronger base area in the area, I personally would not risk playing a long, but stick to the larger, higher probability play of buying in to a constructive pullback with good signals for a trade that should not only be stronger, longer, but much higher probability and in the end, less risk.

Gold / GLD Update

Again I have quite a few emails about GLD (gold) and gold miners which I will get to next, I just needed to be sure the data gap is not a problem and what timeframes I need to be careful with.

Essentially the Gold Update (and GDX/gold miners, have a tight correlation with gold) is unchanged.

I have expected a pullback in gold which we saw for a good part of last week, while the overall larger trend remains bullish.

I did warn specifically about short term action as follows,

"Not too much has changed in the assessment for both, but there is a decent chance for some misleading activity and a decent chance for some trades if you are pretty aggressive."

In saying "misleading", as you know few things in the market move straight up or down so even in the gold pullback, I expect a short term bounce and that is what I think may be construed as misleading.

In a GLD pullback we want to see accumulation of a pullback for a longer trend position (long) gold/GLD and this will likely effect GDX/NUGT the miners as well.

Here's what we have in Gold/GLD...


 This is YG (Gold futures) 1 day, the positive divergence is part of the larger, longer term uptrend I believe we will see in gold after a pullback completes with confirmation of a positive pullback via positive divergences through the pullback.

 This is the gold futures 60 min chart showing clearly the pullback we have expected in gold and we have seen thus far, I do believe this pullback is not over, but likely to see a small counter trend (pullback being the trend) bounce, this is what I was referring to above as "Misleading activity" as it may look like the bounce in Gold is complete before it is. I also thought/think a gold bounce is tradable, but it is a more aggressive trade.

 This 15 min gold futures chart has no data loss in it at all so that's not an issue, it does show what I suspected last week long before we had a divergence like this which is positive from about late Thursday through the present.

I do believe this will likely see an upside, shorter term move, I'm not very interested in trying to trade it as I believe the larger trend that should continue to unfold is the larger, most probable and safest trend.

However I will watch this very carefully as gold is a QE sensitive asset and it has not been that long since last Wednesday's F_O_M_C, however since then gold has been trading in a manner in which would suggest elements of the market are bearish on QE and continuing QE or perhaps it's ability to effect the market positively.

 The 30 min 3C GLD trend represents the larger trend (up) in GLD, you can even see on the pullback starting last week that the chart does show the first hints of accumulation in to the pullback as we wanted to see.

The 15 min GLD chart shows clearly the area of a negative divegrence that is confirmed by gold futures and this is the "pullback" expected in Gold/GLD that has materialized since we first expected it.

However once again you can see some small/shorter term positive divergences on this chart as well. Part of this may be for a counter trend (short term bounce), but I suspect some of it as we see above on the longer charts that would not reflect a bounce, and that would be a constructive pullback or accumulation in to lower prices as expected.

The 5 min GLD chart (and right now I don't want to use a chart too much shorter until more data from this morning's blackout, is filled in) shows the activity that I termed as potentially "Misleading" and that would be a signal for a counter trend bounce within the pullback which is actually quite normal and probably tradable, however it's important to remember what the highest probabilities suggest, it looks to be a short term bounce/consolidation and thus has the potential to be misleading especially since counter trend bounces are typically very powerful as they need to be believable.

I'll continue to wait on a continued gold/GLD pullback to enter a longer term position (long) which I believe will be stronger than a bounce or even a swing trade.

I'll check in to GDX/NUGT and DUST in case some are interested in using the 3x leveraged ETFs to start a position.

.


USO Update / Worden Data Update

First for those of you using Worden platforms, if you are using real time and having any difficulty as RT has been restored, try restarting your operating system and the program. You'll have a gap in the data around 10:24 to 11:38. It "seems" like the data is being filled in slowly as it was initially out at 9:41. In any case for 3C use, I wouldn't use anything shorter than a 5 min chart for intraday or about 2 day charts until that fills in more. For SF5, you may need to restart your intraday data on your data downloader.

As for USO, I've looked at it again and do like what I see, I think it's still a decent call position or perhaps a leveraged long ETF position.

We can see where USO went negative and this is part of the larger update from Friday linked in the last USO post as well as the leading positive divergence on a 5 min chart. The other thing that I like seeing is the reversal process, I didn't draw it in below, but did put a white box around it, it's just pretty much proportional with the preceding trend which is good.


USO December $35 Call Follow Up

From Friday, a USO Dec. $35 Call position was opened. These are the charts of USO from Friday...

And the $USD which has a Historical Legacy Arbitrage that most are familiar with as oil is a $USD denominated asset, meaning the lower the $USD goes, the higher oil must go in response or vice versa. I also thought there was a good chance for gold to have a near term bounce that I said may be "Misleading", this too could be effected by a change in the $USD, but for now lets look at oil and the $USDX.

 This is the $USDX 15 min chart with a negative divegrence after being up since 10/27

This is the near term 5 min chart (better for timing) also going negative on the $USDX suggesting lower $USD prices to come, which should push oil higher.

 This is the 15 min Crude futures with a building relative positive divegrence and...

The oil 5 min chart with a building positive divegrence so I do like oil at least for a move using those December $USO calls.

I still like the December $35 USO calls at this area and think they'll see some decent upside, I do think a 2x leveraged ETF (oil) can do fairly well too.

The $USD movement could have some obvious positive effects on gold as shown short term last week so we'll check in to those as well.


On Worden Outage and Another Market Outage

I'm posting this because I know a lot of you are using a Worden platform of some type. At 9:41 a.m. all feeds across all platforms (I have all 3 and checked) lost quotes (Telechart, StockFinder and TC-2000).

Not too long ago Worden sent out an email that reads as follows,

"Dear TC2000 Customer,

At 9:41 a.m. our primary data provider experienced an unexpected outage of their feed processor. Engineers are working to solve the problem as soon as possible. We do not have an estimate as to when it will be back up, but we understand that time is very important.

We pride ourselves in having multiple redundancies to prevent this from happening. We understand this is not acceptable and can assure you that we will investigate to prevent this breakdown from happening again.

Please accept our apology and thank you for your patience.

We'll be back in touch as soon as we have an update.

Chris Worden, President
Worden Brothers"

Around the same time (although I'd think there's no connection) at 9:53 a.m.  BATS broke down and declared "Self-Help" against NYSE MKT, NYSE released a statement that they were reviewing all trades posted to the consolidated tape marked as "sold" and that NYSE and MKT are operating normally.

So beyond the Worden issue which I put out just as information for members, we have a new week and another exchange (last week it was NASDAQ) breaking down, although BATS revoked the "self Help" shortly thereafter.

Something is desperately wrong with the exchanges, this will not end well at some point, although some media have written it off as insignificant.

MORNING MARKET UPDATE

I took a little time to compare the risk assets (Gold, $USD and Treasuries) that are QE sensitive and compare them to the SPX Futures (ES), I was a little surprised by what I found. Friday the QE sensitive assets were acting in a very "Taper-on" way vs the broad market (meaning the market is acting like the F_E_D will announce a QE taper which the market doesn't want, very soon or already has). However what I found may just be as a result of the randomness of market chop or may be something else more important, but here's a look.

 Above is a 5 min chart of the SPX with Friday's open in white and close in red, a pretty narrow range, but it was also an op-ex Friday, which means an options max pain pin was likely in effect.

It was the QE sensitive risk assets that acted VERY different (Taper On) from the stock market (Taper Off) indices except for the Russell 2000 which was down around -0.45% on the day.


*All of the charts below are an asset in green/red candlesticks vs ES (SPX e-mini futures) in purple.
 The $USDX is acting in a Taper On way, but not just Friday, since the F_O_M_C came out at the white arrow and even before. However is you look at ES's general trend since the F_O_M_C, it too has been more down than anything and also looking like it's acting in a "Taper On" mode.

Although this may just be a result of the "CHOP" we expected, it may not be.

10 Year Treasuries have been down since the F_O_M_C, ES doesn't look so different does it?

The green arrow is the start of trade for the new week yesterday.

This is the 30 year treasury and ES in purple, the white arrow is the F_O_M_C and the green arrow is the start of trade for the new week yesterday.

Here we have  gold futures vs ES

So, while Friday had a much more noticeable margin between the QE sensitive assets and the market averages, on the whole the overall trend since the F_O_M_C is really not that different, I just can't say if it's due to the randomness or seeming randomness of a choppy market or if there's something real there, I expect it has more to do with chop in the very short term and perhaps "Taper on" slightly longer term.

The Index Futures and 3C...

This is the 1 min ES overnight and in to the open, pretty much in line.

1 min NQ which had an obvious negative divegrence sending NASDAQ futures lower.

 And TF/Russell 2000 futures 1 min.

Many of the charts in the mid term are consistent with market chop as has been expected since last Thursday and even as early as Wednesday night. However when we move to a longer, stronger timeframe, it seems to give the chop it's time in the light, but doesn't seem to guarantee if for too long. 

These are the 60 min Index Futures charts.


 ES 60 min leading negative badly.

NQ 60 min leading negative acutely

TF 60 min leading negative very clearly as well.

This is the chart I posted Friday near the close of a rough concept of what market chop might look like moving forward, note the first high I drew in (orange) for today  vs. the high on the 31st.


And this is the SPY's movement thus far this morning, VERY close to the concept of market chop that I randomly drew in last Friday on the chart above this one.


I'll take a look at some other assets and see if market chop still looks to be the most probable near term movement, if so then the market still remains dangerous for shorter term trades, but it can be useful for tactical trades and short term trades.