Monday, July 8, 2013

Daily Wrap

Today's market reminded me a lot of AAPL just before it collapsed and lost -45%, Hedge funds obviously are not doing well on the year with the average fund underperforming the SPX by 80%, I also saw a blurb about John Paulson's Gold fund down 65% for 2013!

Putting that in context, without getting too much in to the details as I've talked about in numerous times, there's herding among hedge funds, the reason so many underperformed the market so badly the last several years is because they're all basically doing the same thing, they follow a few leaders like Third Point and when the leaders make a change, everyone else does the same (Third Point and AAPL are a perfect example), there's only one thing worse than underperforming the SPX for a hedge fund manager and that's underperforming the pack.

Today's action really had this feel of, "Whoever sells first, sells best", but in reality this is a move we first saw  developing Thursday 6/27 and considering last week it's not surprising we didn't get the move, considering the 27th is when the signs first started popping up (as it takes some time after the initial divergences) and considering the range that was in place, the timing and where the SPX is right now aren't surprising at all, take a look.

The red arrow is Thursday 6/27, most of what follows is last week's chopped up week and a fairly clear range, the last thing we typically see before a reversal (on any trend / timeframe) is a false breakout/break down or simply a head fake to cover all bases whether a false breakout or a stop run or something even crazier like a "Crazy Ivan".

However, the SPY/SPX's close above the range and 50-day m.a. (in fact all of the major averages closed above their 50-day for at least the second day in a row which is another obvious head fake area) isn't the best of the head fake moves, the one average that saw some of the nastiest intraday 3C signals was the one with the biggest attention getting, retail chasing, sentiment shifting moves and that was the Russell 2000 closing just above the May 22nd intraday highs. Does May 22nd sound familiar? Not only did the R2K make the close above the intraday high, the all-time closing high, but above the 1-day key reversal on May 22nd that no average has been able to hold a move above (except the R2K) so closing above the intraday highs there was almost a little show-boat-y, in any case it did the trick early on as far as retail was concerned.

Our sentiment update today shows how fickle retail is,

" Sentiment has now swung to bullishness all of a sudden with many making a point about IWM making new highs.  The big bears that were buying loads of puts from 2 weeks ago are nowhere to be found."

This is what I'm always stressing, "There's no point in moving the market unless it achieves a goal", it's not about oversold or overbought, it's about changing sentiment and creating opportunities. Remember this is a zero sum game, for you to make money, someone has to lose it. For institutional money it's a different game entirely and that's where most people go wrong and fail to understand the market's behavior and motivation.

Here's an example of the R2K and how Technical Analysis has changed.
 If we look at this daily R2K chart backed up to July 2nd, anyone who remembers what the market's behavior was like just before the late 1990's probably remembers that a set up like this was a short entry that worked pretty darn well.

After the break below support at the red arrow with two nasty days in a row (follow through) the break of support alone was usually a decent entry, a better entry was to wait for the test of former support (now resistance) at the white arrow and on a day like that with a long upper candle wick, it meant higher prices at resistance were re-jected and this was literally a textbook short entry. Then Technical Analysis started catching on with the internet and discount online brokers, then Wall St. started adjusting and up until 4 or 5 years ago, gap resistance as seen as the last day to the right (July 2nd) was some of the best resistance you could ask for and that became a sure fire short.


NOW....
Everything is about changing sentiment, I think it's partly because Wall Street knows exactly what Technical traders will do in every situation and part of it is necessity due to lower volume in the market. This is where traders lose Wall Street's motivation, with positions the size of theirs and lower volume it takes a change in sentiment to create the movement that allows them to fill positions, THEY NEED THE VOLUME AND TO SELL/SHORT IN TO HIGHER PRICES.

As the sentiment update says, "The big bears that were buying loads of puts from 2 weeks ago are nowhere to be found.". Those big bears, weeks ago would have been chasing the market as it broke below support (it has to be obvious to technical traders)  literally at the red arrow, that changed sentiment to bearish, it created the opportunities Wall Street needs to position themselves and to get in at a decent average fill. Today's move ABOVE all resistance at a new high did what it was designed to do, "Sentiment has now swung to bullishness all of a sudden with many making a point about IWM making new highs." In other words, retail chasing the IWM at new highs created that opportunity and it's no coincidence that the IWM intraday charts looked like this today.

IWM intraday 2 min (all the IWM intraday charts were nasty though) moving as is often the case and think about why the signal is stronger, from a relative negative divergence to today's much stronger leading negative divergence.

By the way the symmetrical triangle in the IWM today was not coincidental, a symmetrical triangle in Technical Analysis is a Consolidation/Continuation pattern that is "suppose" to breakout in the direction of the trend preceding the consolidation, that would be up and don't think Technical traders didn't notice that today.  

The half position in SRTY long today was not coincidental, either, it was specifically chosen as an equity position rather than a larger leveraged options/put because of timing issues with options and its ability to withstand drawdown (especially at half normal size) that options/puts wouldn't be well suited to. 

I like the IWM short here, but with that triangle I know there's a pretty darn good chance of a head fake move there, the only reason I didn't wait to start the position until a head fake move (upside false breakout) occurs is because of the general tone of trade today which was as I said above, very reminiscent of AAPL just before it broke, "Sell in to ANY strength".

The IWM or the Q's trying to make a move that might have taken the entire market higher today, but couldn't find any legs was far from the reasoning behind entering SRTY today.

Really this all was becoming very clear last night and pre-market, take last night's post:


  • -Index Futures seeing sharply lower leading negative divergences


  • -30 min Index futures going negative  from their former demarkation between the 1-15 min negatives and the 60-120 min positives (I'll have more on that just below)


  • -Treasuries showing sharp and very sudden positive divergences (Treasuries had their BEST DAY in 16 moths!)


  • -Nikkei charts falling apart


  • -Credit Dislocations drom the SPX


  • - Sentiment Indicators turning sharply negative.


Then Take this morning's Futures update 


  • -Treasury Futures with even larger divergences - the size and speed in which these developed were not coincidental in my view with them seeing the best performance in 13 months, it also speaks to something that changed pretty quickly on the bearish side in the market.


  • -Certain Risk supportive currencies seeing strong positive divergences like the $AUD which made a strong move today


  • -The $USD going sharply negative very quickly


  • -Crude showing much sharper negatives (USO ended the day down -.41% despite the Egyptian chaos getting even more out of control and Brent was down about 1% since futures opened yesterday).


  • -Precious metals seeing sharp positives as well with gold up 1.19% and SLV up 1.10%. Our SLV calls opened Friday ended the day up over 14% and NUGT calls ended at break even despite the red close.


I'd rather look at futures later in the evening, but there were some developments mentioned above that won't change with the passing of several more hours.

Not only did Russell 2000 5 min futures get quite a bit worse as you might imagine after seeing the intraday charts...
R2K futures from relative negative to leading negative to making a new 3C leading low today.

But that wasn't even really something I would have mentioned if not for this...
 Not only was the 30 min chart of NASDAQ E-mini Futures (above) going negative a large change in character from their previous "in line / trend confirmation status", but adding as much as the 3C leading negative added today on the downside was almost shocking.

It didn't stop there though, the previously positive 60 min charts...
 started going negative today as well as you see in the NASDAQ futures above and the R2K futures below.

Russell 2000 60 min Futures.

As you know, I like Treasuries, they had a spectacular day today, what's interesting is how fast the strong positive 3C divergence developed last night and this morning (see the linked posts above for the charts), it's almost as if someone found something out, these weren't the typical gradual divergence that shifts from relative to leading...
That's a 60 min chart on the 30 year Treasury futures, it's darn near vertical. I suspected something was up with the price action Friday. From the looks of the 10-year futures, I think we'll have an opportunity to get in at a slightly better area.

As I mentioned earlier today, I still like Silver, gold and miners, so much so I left the SLV call open even though I suspect it has a good chance of pulling back. This is just one of those positions I don't want to over-trade or get too fancy on and miss a nice move (I learned a valuable lesson from trying to get too fancy by trading around an AAPL short).

Most of these charts you've already seen throughout the day or specifically in the Leading Indicators update.

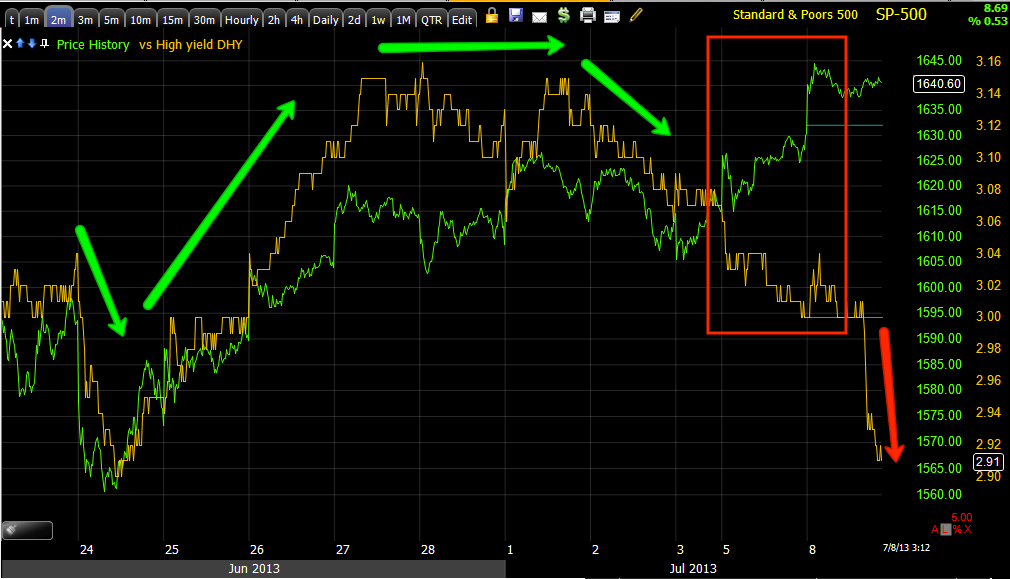
High Yield Corp Credit/HYG is negatively dislocated from the SPX since Friday, it traded in line with the SPX intraday today and I suspect that was 100% all about the arbitrage value. The close of HYG looks to me like the IWM triangle (intraday) sees a false breakout.

High Yield Credit as I have talked about a lot recently, but today we actually saw it, having no arbitrage value or very little and lower liquidity than HYG is and was the first to panic, take a look at the Leading Indicators post, around HY Credit dropped pretty much straight down, the daily move is one of the largest moves on LARGE volume (in fact the second heaviest of the year - about 5x average volume) since the 5/29 -3.63% day that made a new low for the year. Point being, this is the first form of credit to hit the panic button and it did so hard today.

Sentiment Indicators- both were lower today as they were Friday as well. There was a bit of an intraday move that seems to me to fit with an upside breakout from the IWM triangle (it's just too obvious and in the right spot at the right time), one I'm sure will be revealed as a false breakout and likely the best positioning for either SRTY long or IWM puts.


Based on what I see right now and know, the SPY provides a good model (the other averages are very similar) to how I think this goes down, which is really just a part of the reversal process of the next leg in the market which we have been expecting to the downside, it's nothing new as far as I can tell (that seems obvious just looking at the first, second and third charts of this post).

 The shortest chart, 1 min went negative on the open, but it didn't do so in such a way that would make it a purposeful move to accumulate at better prices, I believe that was real sellers (not retail) using any strength they could get. You already know what happened here in the afternoon because it was the subject of a lot of updates. That 1 min positive divergence (just like the 1 min from Friday I talked about in last night's post as being likely to carry over to today as it did) should be enough to take the market higher, specifically I'm thinking about the IWM triangle as the IWM is the average everyone is focussed on and that triangle was no coincidence.

As far as the 3 min chart, there's no strength here, there was no migration of the 1 min divergence to even the 3 min intraday chart so it goes without saying I think it's fairly safe to assume that any upside move is going to be a head-fake, false breakout which gives us excellent positioning not just on market averages, but a whole range of assets like GOOG mentioned today.

 The 5 min chart is already showing the 3 min negative migrating over so the negative divergence is picking up momentum, again this leaves me pretty certain any breakout move is a false breakout, but we could have guessed that by market behavior. mass psychology and price action in the IWM alone (triangle intraday...pretty obvious what that's meant for).

The 15 min chart is already rotten as the Index futures confirm so I also feel very certain that this is the leg down that was first picked up about a week and a half ago.

*Note the head fake move in yellow, people usually don't notice them unless they are pointed out, but the entire point of them is to set up a reversal and that's why they tend to be the last thing we see before a reversal just like the example above.


If futures provide anything of interest later tonight, I'll post those.

As far as Alcoa's earnings, they don't look very impressive. Remember we first developed 3C on TOS for after hours use, take a look at AA AH.
That's negative right in to the knee-jerk move and leading negative after.


Opening Half Normal Size Position in SRTY Long

I'd add to it on a break above the triangle,

 I'd add to it on a head fake move above the triangle on distribution.

IWM 2 min, 3 min...

TF 5 min R2K Futures.

I think the same could be done with SPXU, SQQQ or SDOW.

Leading Indicators : This move just can't find its legs

I'd think maybe the Egyptian situation may be causing some of the intraday tension back and forth, but it's not reflected in oil, this honestly just looks like sellers are stepping in on any bit of strength, they did it on the open today and then as we started to form a little "U" and Leading Indicators don't look good, even if we did get a move to the upside, Leading Indicators in my view confirm that the right play is not to try to play an upside move, but to use it to set up or add to positions (short the market).

 CONTEXT for ES has also seen the model drop like the SPY Arbitrage model, now the ES model is saying ES is 13 points rich compared to other risk assets.


*All Leading Indicators are compared to the SPX unless otherwise noted

 HYG vs the SPX, the same negative dislocation in credit is seen today, however on an intraday basis, it seem like credit has been a supporter, again this only confirms the strategic play here to allow any potential upside to be used to short in to, not to try to play the upside which seemingly can't get a leg up.

 HYG intraday vs the SPX (zoomed in tight).

This has obviously helped any of the arbitrage algos as HYG is a SPY arbitrage asset.

The thing not seen in price is the decay in HYG's 3C chart, that's more apparent on the chart above this one in the dislocation.

High Yield Credit is the less liquid one and the one I always say will panic before HYG, look at this chart of DHY confirming the trend of the SPX and breaking off late last week as pointed out again last night, then today it was full-on panic.

This is HY Credit intraday, someone wanted out immediately. I suspect when they saw the attempted move today had no legs or was struggling as bad as it was, they bailed.

Look at the normal correlation of VXX to the left and then today's, as 1 of 3 SPY arbitrage assets, it's pretty clear HYG and VXX were used to try to drive the SPX/SPY up based on arbitrage correlations alone as you saw the SPY didn't have much more, not even a positive 2 min intraday chart.


FXA intraday ran along with the SPX, however again confirming the strategy considered for today on any move up, the slightly longer chart shows the probabilities once again.

Here's the AUD a little longer view vs the SPx, the trend confirmation and even the positive divergence at the 24th are long past, this market really looks ready for that move down, the next leg we expect. 

The Euro intraday also seemingly supportive, but...

the wider view is even worse than $AUD, confirmation short term is long gone.

Yields which are like a magnet for equities reverted to the short term mean last week as shown last night and now they are dropping, they'll pull equities toward them and longer term they are severely dislocated.

This is the sentiment indicator FCT (not retail), it too, very much like HY credit seemed to give out once it was obvious the market was struggling even with the SPY arbitrage on its side.

HIO is severely dislocated from the trend as seen last night, the next leg is down.

Quick Market Update

I think the move is still most likely on, but there was definitely some softness there as it seems there are a faction of the hedgies that may be breaking away from the herd, if you think they don't herd, just look at their average performance being 80% worse than the SPX, they don't want to take a chance to try to stick out and shine otherwise they may stick out as performing worse than the herd, that's why they all buy the same stuff and all move together.

In any case, I'm switching templates, but before I do I wanted to show you what was going on, it looks like it may be shaping back up a bit now.

 SPY Arb is still positive,  although down tom $0.56

SPY 1 min

The point of the SPY 2 min is not deterioration, it's that it never really made it to a stronger place like the Q's did, there was no migration from the 1 min chart to the 2 min, meaning there's not much support here at all.

I wanted to show the 3 min trend with as little drawing as possible, the red area is what stands out, the green arrow is trend confirmation.

 And the 5 min is where the first real institutional timeframe starts, none of the intraday strength made it here.

The QQQ 1 min saw a sharp downside 3C move, it has stopped and started to recoup a bit, but that looked like a pretty decent bout of sellers and I doubt they are retail.

 The QQQ has been the leader today, the 5 min chart shows improvement at the lows, but it didn't do much more than bring the chart back in line.

IWM 1 min is showing a VERY clear triangle, retail has been commenting on the IWM as the reason for their bullishness so this is really a perfect set up for a breakout to the upside to suck retail in, we have to confirm that of course, but judging by the other charts, I doubt we'll find any surprises.

IWM 2 min

IWM 3 min.

Here's the most recent chart with some improvement, it's a fast moving market, this is why I want to get over to the Leading Indicators layout.

There's the most recent improvement and it looks to have launched NDX futures here.

I have quite a few individual stocks as well as the typical leveraged ETFs on the radar, I'll let you know if anything exciting pops up on the LI layout.

Market Update & Example trade Set-Up: GOOG

It looks like this move is ready to go and has started, I believe it will go and it looks in several ways like it will be more than just intraday, however there are a few indications that may just be passing, but they may develop in to something more which would suggest this move would end before it really got started, we're not there yet.

I've been looking at candidates, I have quite a few, one of the better ones is GOOG short (using an upside move to get in to position).

I am not very interested in trying to trade the upside move that has been indicated for a couple of hours just because the probabilities are for a pretty short move, it actually looks much better as a set up move to trade with probabilities.

Lets start from the top.

 This is the intraday 1 min NQ (NASDAQ 100 E-mini Futures) as the NASDAQ/QQQ seems to look the best. It has the best looking positive divergence of the Index futures, but note the little area in yellow, that almost looks like there's some early selling even in to the slightest strength, of course it could be a place holder to keep the move from prematurely launching as well, it's way too early to take that too serious, but definitely needs to be watched.

 This is that same area in the QQQ 1 min chart, there's a good divergence on intraday charts in the Q's as you can see one above, but again that area needs to be watched.


This is the NYSE intraday TICK, the channels have switched, but the current channel looks a bit thin, this goes back to the areas that need to be watched, I doubt they are anything, but you know where new divergences start.


As far as the expected move, GOOG is one of several assets I'm going through now that would make a nice position, GOOG already has rot or longer term negatives built in, if GOOG can drift with the market and the short term timeframes go negative or rather more negative in to any upside, then GOOG sets up as a high probability/Low risk short.


 I don't know if GOOG can make either one of these, if there was a decent market move I'd say the $910.85 area would be probable, that's where a head fake move can set up and the short term 3C charts going negative in to an area like that on some volume would be the confirmation I'd be looking for.


 GOOG's 30 min (longer term) chart already has rot or distribution set in so it's a good target.

 The 1 min hasn't responded today with the Q's so any upside would be drafting the market, which is indicative of short term weakness as well.

The 3 min chart

The 5 min chart is now at the deepest leading negative divergence and the price move is starting to get a little vertical or parabolic.
 
And the 15 min chart is at it's strongest leading negative divergence so every timeframe plays right in to that 30 min.

All we need is a move to the upside, hopefully an obvious resistance area broken on some volume and then 3C confirmation of a head fake move or selling/shorting by smart money in to the supply (provided by retail buying a breakout above resistance).

Back to stalking trades, this is where I prefer to be.

First we have to see if this market move will get going and I think it will, if not, then the sellers are stronger than expected, if they are willing to sell in to any bit of price strength, it's kind of like the AAPL decline situation.

Retail is bullish so the ground is prepped and ready to go, we just need a spark.