Friday, October 5, 2012

Market Warp

If you didn't have a chance to read last night's post, "Minutes" I would urge you to try and find 15 minutes this weekend to read it. Much of what I have suspected was directly addressed in the minutes by F_O_M_C voting members, so on many issues we weren't far off base and in some cases right on. So far from what I've seen, I suspect that the minutes may be a much bigger deal than what most people who never even read them realize.

Another important point that the market seems to have latched on to was realized during the post f-o-m-c press conference with what may be one of the difficulties of QE3 for the market, here's the post from that day, "What Bernie Said That the Market Didn't Like"

My job isn't to be a perma-bull or bear or even to try to sell you on my opinions, my job is to look where few others look and try to find evidence few others see, then look at the evidence and come up with probabilities and game plans. We have a lot of forward looking tools that have given us a head's up on asset direction even when the asset itself seemed to say otherwise. In watching the market every moment it is open for years now, you also come to understand some behaviors that are not found in the trading and Technical Analysis textbooks, things change and sometimes quickly.

On September 13th 45 minutes after QE3 was announced I said, "Conventionally my first instinct is to cut short exposure, but I think I'm going to wait just a bit and see how things shape up"

And...

"Right now the IWM, QQQ, and SPY/DIA to a lesser degree are showing negative divergences that I believe will bring them down as sure as the AAPL positive 5 min sent it up.

There's probably an argument that can be made to short some of these here as they can easily be covered on any move higher with pretty minimal risk, while you may not get the chance to short them at these levels. I'm fairly content with what is already positioned.

There are some other markets too that I have pointed out, but the main point is I'm not making any drastic changes on a 4 hour move, which is almost always a knee jerk reaction and against the bulk of the evidence without decent evidence to support that change."

Where the divergences of the 13th correct? Could you have made money doing the unthinkable?
The answer was yes.


The reaction to the Non-Farm Payrolls seemed out of place, I think it's either the minutes effect I described last night or the number simply wasn't believable in front of an election. Goldman points out:

" ...the official US unemployment rate fell 0.3 points to 7.8% as the survey of households uncovered more than 800,000 new jobs in September, 187,000 of which were due to gains in government employment. While last month’s job gains in the payroll survey were much more moderate (114,000), they accompanied increases in the workweek and came atop significant revisions in government employment."

Goldman did a good job of explaining why the unemployment rate dropped 0.3% below consensus in that the government found nearly 8x more new jobs than the month before, but refrained from asking if that data is believable.

What is believable and maybe because it's not in the headline NFP and most people don't even know about it, the "U6" unemployment rate remained unchanged at 14.7%. "U6" is considered the broadest measure of employment because it not only counts unemployed, but those who may want a job, but haven't looked in the last 4 weeks which is easy considering many people are unemployed well over 99 weeks. So this rate is nearly double the headline U3 rate, but true or not, there's nothing we can do about that except try to see what market sentiment is. 

As for Sector performance since QE3's knee jerk reaction to the upside, it certainly is curious:
 Healthcare +3.5%, Staples +1.5%, Utilities Unchanged, Financials & Tech -2.5%, and Energy -4.8%...

For all of you who are familiar with the Risk Asset Layout, you'll know that the top 3 performing sectors, Healthcare, Staples and Utilities are also the flight to safety sectors. The 3 most important risk on sectors, (so important I call them the "3 Pillars") Financials, Technology and Energy are the worst performers.

I want to show you the Risk Asset Charts and some other leading indicators that we have used to call both tops and bottoms, there's no bias, just the charts.

Since I brought up FCT today as a leading indicator that we have used before, but not that often, I'll start with that.

*Risk asset indicators are compared to the SPX which is always green unless otherwise noted*
 Today's performance in FCT erased 2-3 weeks of gains depending on where one would have bought, but at least 2 weeks solidly.

 In the past FCT has called a number of reversals, tops and bottoms; above is FCT diverging from the SPX at the 2007 top.

 Here is FCT positive diverging with the SPX at the 2009 bottom. 

 This is the divergence with the SPX at the March-May 1, 2012 reversal to the downside.

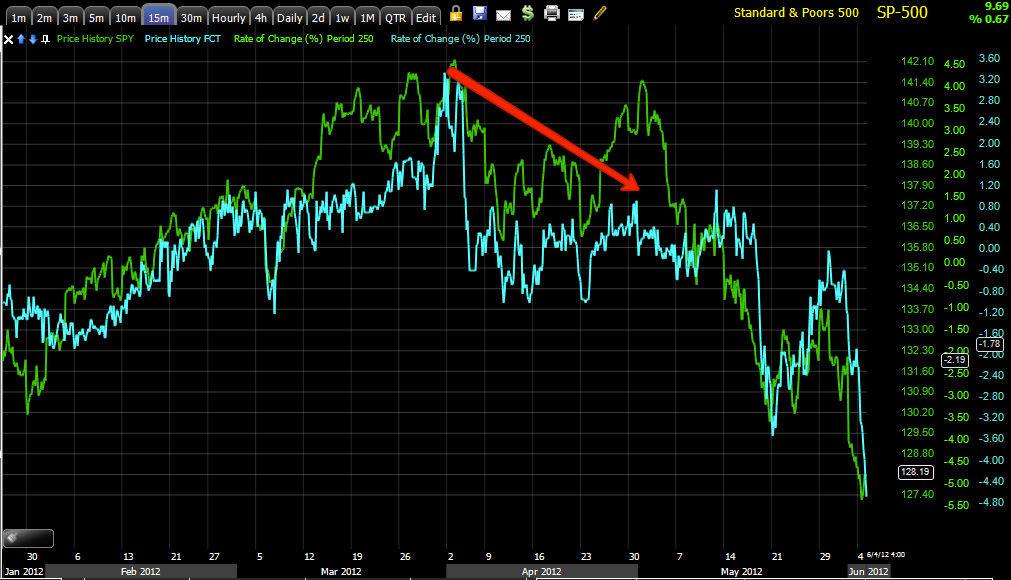
So today's massive move in FCT probably shouldn't be ignored and as far a it being a 1-day move, I again encourage you to read last night's "Minutes" post.

High Yield Corporate Credit... HYG (This is a very liquid asset and is a good leading indicator among credit assets).
 Earlier in the week when the 3C signals were muddy before the minutes were released, we correctly used Credit and the Euro to predict the market the next day, intraday Credit lead the market lower, it also lead a slight recovery toward the end of day. If you know my expectations for AAPL and therefore the market in the near term, this late day move in credit will make sense.

 Since QE was announced, Credit really front-ran the F_O_M_C, it also has not performed well since with it breaking below it's pre-QE3 levels a lot faster than the SPX (white trend line-SPX green trend line). Credit also hasn't made a higher high and remains negatively divergent with the market.

 HYG Credit and the divergence at the 2012 downside reversal... This is partly what gave us early warning to start building shorts in to strength in March, some were covered, some are still at decent profits.

 Junk Credit did the same thing as HYG intraday...

Junk Credit is similarly negatively divergent with the SPX which is not a good signal as it is high yield and a choice asset for a risk on position.

This is the $AUD (Australian Dollar, a measure of the Carry trade and therefore a measure of what hedge funds are doing in the market, positive correlations are good for the market, negative correlations/divergences are generally warning signs).

 Back in 2009 the $AUD/FXA called the 2009 bottom before the SPX hit the bottom, it also signaled the end of the QE1 rally as the SPX made 1 final higher high and finally it signaled a bottom just before the Jackson Hole Speech in which Bernie signaled QE2 so it has a good track record of calling tops and bottoms ahead of the market.

 Here's the pre-Jackson Hole 2010 bottom, the 2011 reversal with a nearly 20% decline following and the current negative divergence wit the SPX which is not only divergent, but lower than the 2011 top.

 Here's a closer look at the $AUD now, it failed to make a higher high with the SPX and has been diverging badly.

As for more specific Carry Trade (which is what Hedge Funds and others use as cheap money to finance higher yielding assets like stocks), the currency pair of AUD/JPY.

 Compare the SPX (green) with its 22 day moving average vs the $AUD/FXA in red with the actual currency pair below. At the white arrow the pair had already broken solidly below their own 22 day moving average, a warning sign that the carry trade was being taken off and risk assets sold. At the yellow area, the FX pair was already coming off a lower high as the market was making a similar high.

 The AUD/JPY pair at the same time period as above, at the red arrow, the SPX was making a second high almost equal to the first, that was May 1, the end of the top and start of the decline.

 Here's the same, except now with the SPX still above its 22 day moving average, the $AUD is negatively divergent.

Here's the same carry trade FX pair, note the June low, the same as the market, but notice how the carry trade has already been taken off and is below its 22 day moving average.


Finally the old Dow Theory standby, Transports
 As you can see Transports are diverging with the SPX, I should have used the Dow, but they are so closely correlated it doesn't much matter.

 What's interesting in that since 2009, there hasn't been a negative divergence between the market and transports as large as this, in fact there's only been 1 other negative divergence at the early 2012 rally top/downside reversal in to the June lows and that divergence barely stands out, so this is the largest divergence in transports in 3.5 years since the market got under way in early 2009.

The last time we saw a significant divergence between the market and transports was all the way back to the 2007 market top and we know that didn't end well.

I'm not trying to justify an opinion, I'm simply showing you the charts that you've seen so many times before in numerous situations. Is a decline possible? We've already seen one since QE3 was announced, Goldman Sachs has their 2012 year end SPX target over 200 points lower and they are well aware of QE3. 

While the probabilities between all of our analysis including: the 3C charts which seem to be very clear both in the market averages, individual stocks, Industry groups and the Futures; the breadth analysis; leading indicators and general market behavior seem to give us a probability and we'll look for the opportunities within the probabilities and elsewhere as the market does seem bifurcated more than ever, I want to assure you that if the data changes, so does the analysis. I don't care which way probabilities are, as long as we are on the right side of them.

Finally, someone did take the quick Gold/GLD short from yesterday and is in the green, glad to hear it!

Have a great weekend, I'll update as events and analysis warrant.


Market Wrap Up Coming

This isn't good

A member told me about this a while back, I did some research and back testing and it turns out to be a pretty decent leading indicator.

I haven't had time to look at the rest of the risk assets which I will, but it seems the minutes opened up a whole new dynamic in the market, much of it was explained in last night's post, "Minutes"

Take a look...
FCT-Senior Floating Return Income Fund has a strong correlation with the market, often leading, today's price action vs the SPY isn't a good sign for the market; this is since the June 4 lows.

AAPL Holding Support

As you know I closed an AAPL short position on positive divergences and a bounce, that was right before the head as made, so glad to have closed it, but I and others are still looking to re-open it. The $680-$690 area looked/looks reasonable for a last shoulder, that's what the plan still is as AAPL is holding sone support even as the NASDAQ doesn't.

 AAPL in green holding support from 12 pm, QQQ in red is not. This provides better odds as I expect AAPL to bounce at least 1 more time on a right shoulder to the $680-$690 level.

 AAPL 2 min positive at the support level it held on a 2 min

 Also out to 10 min

 The positive nature of the 15 min chart which was leading positive is all washed away, 3C is lower now than when it started although price is slightly higher. This is encouraging for entering the short, still we want the trade to come to us, not to chase it.

AAPL's 4 hour chart seems like a pretty safe bet, we had a MArch short in AAP that made money on a negative divergence, then the early June lows and positive divergence came-I also think it is likely this was the QE3 front running period-, there's a relative negative divergence in to higher prices as AAPL institutional position are huge and as usual, the relative divergence is typically followed by a worse leading negative divergence and this one is much worse than earlier in the year.

I'd still encourage patience and let the trade come to you unless $30 or $40 isn't a big deal for you in draw down within the bigger picture.

S&P / NASDAQ Futures

The 3C divergences on the futures are stronger than similar timeframes on the averages, perhaps because the futures are a much larger asset (price), but for whatever reason I'd say a 5 min 3C chart on futures is pretty close to a 15 min chart on the averages, the longer the chart, the stronger the underlying trade so a 1 min chart signifies intraday moves, but isn't where to look if you want to know what institutional money has been doing, although if you have a long enough trend like StockFinder provides (5000 bars), then it can be useful. For the most part institutional signals are picked up around the 5 min mark, the 15 min is pretty influential, but the 30, 60 and 4 hour are where the real trends of hat they are doing unfold-for the averages, again futures timeframes are even stronger.

The trade today on the NFP is horrendous, if you red last night's post you probably understand why a little more as it use to be "Bad news is good news" because the thought was it would usher in QE 3, but now it seems "Good news is bad news" because any improvements, especially after the F_E-D's new proposed yard stick of moving away from dates and toward economic developments now makes good news a potential adjustment in QE that market participants don't want, they want an amount and a date, not a "This could change", so as I suspected early today in the first post, the NFP coming in a bit better than consensus is now BAD NEWS, a total flip flop and all because of the minutes released yesterday.

ES/S&P mini futures
 On the ES 1 min, other than the 4-5 am positive divergence sending the market higher, 3C has been in line with ES all day, no positive divergences, just following the move toward pre-NFP levels.

 I rolled the 5 min chart back because I can't show this much history on 1 chart, that's Tuesday-Thursday in green, there's a positive divergence at the second set of lows (same level or support) that sent ES higher, but as it moved higher we see a negative divergence or selling/shorting in to price strength. Yesterday after the NFP, the divergence went leading negative, like what we saw in ultra QE sensitive gold.

 This is Wed. -Present on the same 5 min Es chart, the leading negative divergence of yesterday has just grown worse and worse, this will eventually bleed over to longer term charts, divergences always start on early charts and bleed to longer ones if they are strong enough.

 The ES 30 min chart shows a leading negative divergence and I doubt that the negative action on the 5 min chart has even made it here yet, so I don't think this will get better.

 On the 60 min chart, if you read last night's post or recall the theory of QE having been front run and priced in already, you'll see in last night's post that is EXACTLY what F_O_M_C voting members said in the minutes, I only proposed it as a possibility, they confirmed it or at least it was a part of their discussions. Therefore, if that is true, it makes some sense there's a negative divergence in to the QE announcement. Price stayed rangebound for several days after while 3C went leading negative, then price followed to the downside quickly. This move to the upside today that is near the QE3 announcement has not only a local leading negative divergence, but compare 3C on the date of QE3 and 3C now as prices are similar, it's much lower.

NASDAQ Futures
 1 min futures were pretty much right on all day, we just haven't seen the intraday or short term bounce from the most recent positive divergence, with futures we may see that in non US trade, like overnight, it's not the same as divergences in the regular market assets.

 The 5 min chart hadn't shown much other than a positive divergence Wednesday , it now shows a negative in to the NFP highs and a leading negative today.

 The 15 min chart was also choppy and looked like there wasn't a trend, it's there now with a leading negative divergence starting at the minutes release yesterday and getting worse in to the NFP today

 The 30 min chart shows the chop where I mentioned, it looked like the market was confused, very few good signals, again, that is changing as the chart went negative yesterday at the minutes and worse today at the NFP.


A close up of the 60 min chart shows a positive divergence Tuesday, trend confirmation and a negative divergence in to the NFP-this chart lags a bit, but that's a pretty clear signal.

Market Update

With the SPY being the only intraday chart without a positive divergence, who would have thought it was the one that was exactly right.

In any case, it looks like we have an upside move coming as divergences have built in, I'll show you how this fits in with the bigger picture (but still locally as in the rest of the day and early next week) and how this fits in with an SRTY trade and what needs to happen if we have enough time now. The futures have important information for early next week, but I want to get this post out and I'll post the futures next.

 The SPY's leading negative divergence (actually it's in line with price action, but leading negative considering where 3C is and where price is) was right on, but that doesn't mean things weren't happening while price moved lower, things are always happening that you'd never know by looking at price and conventional indicators.

 The QQQ 2 min was positive earlier, it did move up on that positive divergence around 12 pm, it didn't see a negative on the pullback so I think it's still in positive mode as it makes a second (larger) positive divergence. My guess is that the market rallies in to the close from here.

 The SPY 2 min chart was quietly accumulating and is now at a positive divergence and looks ready to move higher in to the close from here. The question is "Does it move higher in confirmation or distribution?" and that's an important question for the SRTY trade idea.

 The IWM was positive earlier, it moved a little, but kept on building a larger positive divergence. When I talked about SRTY earlier today, I wanted to see it pullback and do exactly this, that's where I would have bought it, now I'm not sure if we'll have enough time to get those signals in place before the close.

 As far as the larger implications, the IWM 10 min chart did not hold its ground today which actually means that despite market maker and specialist accumulation to move the market toward some VWAPS, institutional money looks like they were either selling or at least they weren't buying in with the middle men.

 SRTY 1 min remained positive and started going negative on a 1 min chart (intraday), it has enough of a divergence to turn down, again the question is, "Does it see accumulation in to the move down?", usually it would, but also they'll usually wait until it's a bit cheaper before starting to accumulate and now it's a matter of time in the day.

 The 10 min chart of SRTY, considering price is below the range, is leading positive, much like it's polar opposite, the IWM's 10 min is starting to lead negative, that's confirmation between two different or opposite ETFs giving exactly opposite signals, not good for the IWM as trade continues to unfold.

This is what needs to happen in SRTY, I doubt we have enough time today, maybe Monday, but it needs to pullback in price as I have drawn with a green arrow, go slightly sideways to allow for the divergence to build and the positive divergence needs to move even higher as I drew in with blue arrows. I suspect it will happen, I think today is not looking promising though which is fine as I'd rather not commit to a new trade before a weekend which is a wild card.

Futures next...

MCP Follow Up

MCP was a long idea, I'll have to dig back later and find the original idea as it is a more comprehensive post dealing with capitulation, a very clear support zone that was run on stops and those were accumulated and in general, the base-like nature of MCP and the idea of the trade which is a little longer term, not so much a day to day trade.

We've had some good trades that have returned between 25-55% (UNG depending on where you got in) and it hasn't even broke out of the base yet. If you reacted to every pullback and head fake move, you wouldn't have a decent gain in UNG.

MCP is similar, but I don't think it's a primary trend base, more like a sub-intermediate trend base so it won't be as big, but still it needs a little room which is why on initial trades, especially bases or tops that are volatile, I'd rather take fewer shares and have a wider stop to allow the trade space to develop.

MCP charts...
 MCP has a few things on the daily chart, a bullish descending wedge and we know that they don't react like the textbooks say they do anymore, instead of a reversal to the upside as soon as the apex is reached, it has been common place 90% of the time for a lateral base or top for an ascending wedge, to take shape before the move comes. The numbers refer to the stages of a stock's life-cycle, stage 4 is decline, stage 1 is accumulation/base. I don't think MCP is going to have a base large enough to retrace the wedge's base at $70, but I think it's still a good risk/reward position. Also note the change in character not only in price, but volume, this is what alerted us to UNG long before it started basing and moving up.

 As for the Trend Channel, it can't be used yet for a long stop because we don't have an uptrend, but a break above the $13.10 level on a close will totally end any lingering doubts about the downtrend and will likely put MCP in a better position to make a move higher.

 Briefly, MCP saw initial capitualation and formed obvious support, that support was taken out and all/most who bought on capitulation were shaken out of the trade and gave their shares to institutional money on the cheap. Look at the volume on that move as support was taken pout on a stop fishing expedition, only to see MCP rise 29% in 3 days  and over 50%  a little longer term in September.

 Here's confirmation of the downtrend at the green arrow on a 60 min chart, there are a few divergences in the trend, but mostly confirmation until a strong leading positive divergence in the white box on guess what day? Yes, the day the stops we ran, their shares were accumulated.

 On the 30 min chart, here's the accumulation of the stopped shares with a leading positive divergence, we see a smaller negative divergence turning MCP back down as it needs time to create a base and smart money isn't chasing prices higher, they bring them back to them, we also have a 30 min positive divergence on another recent break of support.

 The 10 min chart is sharper with more detail, here's the negative divergence to turn MCP back down to the range in which it can be accumulated at low prices, to the right a recent break below support and again a positive divergence in to the break lower, get it?

 On the 5 min chart, this is the recent break of support close up, look at where the positive divergence takes off as prices move below the support/stop level.

 The same can be seen on the 3 min chart

Intraday, this isn't a big deal, but we had some accumulation in to the open yesterday, prices ran up and saw a negative divergence in to today's open on a move that was too parabolic any way to sustain.

All in all, I still like MCP a lot as a long.