Wednesday, September 11, 2013

Near Term Chop

I'm not getting in to longer term expectations yet because we never really had any expectations other than a strong move up from the range and then to look for the distribution in that range.

For now though, as I've entered IWM puts and VXX calls, I do expect near term downside, I do think this will be choppy, but I'll have to have more data to make that case.

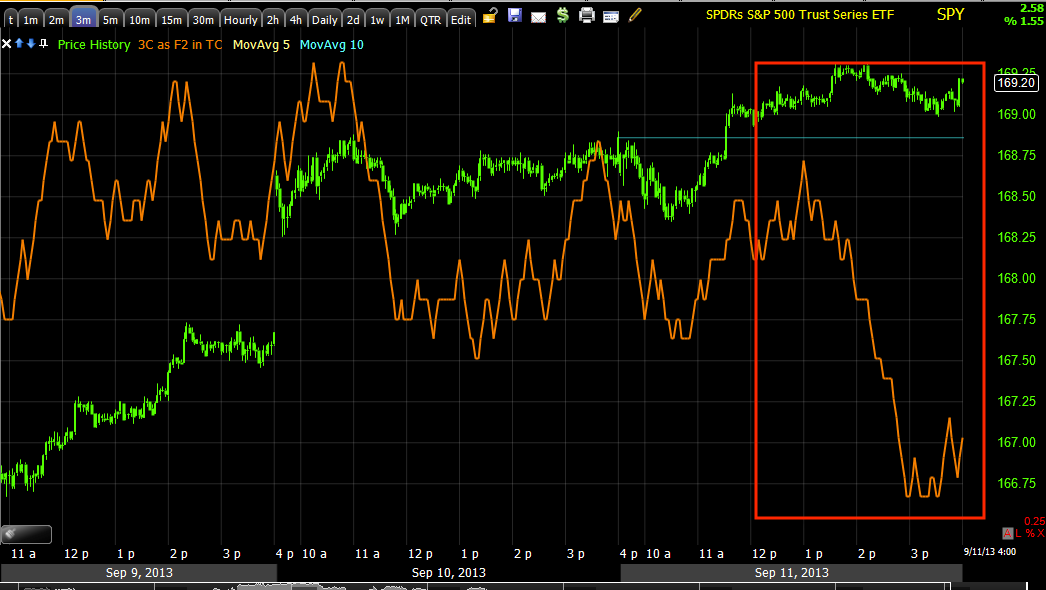
Here's what the intraday, more important charts looked like for the averages at the close.

 DIA 3 min with a nasty leading negative, this looks like the positions entered today should hit with little trouble.

IWM 3 min and this has been one of the strongest underlying averages.

The Q's I considered, but it was too much correlation for me so I stuck with the IWM and VXX.

SPY 3 min with a deep leading negative

And VXX confirming with a strong positive.

I'm probably going to be doing more research tonight than positing, I'd actually like to put together a video and I'm thinking about running out and buying one of those screen tablets to annote the video, I think this is the best if not only way to get the thoughts I have about the market expressed to you.

This really doesn't change anything since the initial range started to form, that looked like this...
 This is what the range looked like, the white arrows are accumulation areas on pullbacks, the yellow arrow is the expected pullback toward the bottom of the range and a heaad fake move below it would kick ogff the move to the upside, you can even see at "X" that the head fake started on Friday, that is why Monday the move lower was expected.

However at the same time, John Kerry changed the whole tone of Syria giving them a way out without a strike (I still don't know if it was a slip or real), whether it was a slip or real, Syria, Russia and China grabbed on to the "offer" which was a simple question asked of him, that changed the dynamics incredibly, but all it did from our perspective in changing expectations was to cut the range/accumulation process short by a day or two, we still expected the move at the green arrow.

This move to the upside is the "Final Market Gift" as we can enter shorts, core positions which we have not been doing because they have not been in the perfect place, but this move would allow them to move to areas that create supply and demand and allow them to be distributed, this is why this was and still is such a market gift, there's no way the market is coming back.

 Here's the 3C accumulation through the range and in line on the move above it, which was all expected so no surprises there either.

As far as the market's condition, just look at the leading negative divegrence right now even in to an in line rally. Compare price and where 3C was at point a and point b and you can see how much damage is in the market.

My gut feeling is we have some near term chop, but after that it's difficult to say because I did expect an upside move that last longer, however funadamentals can change all of that, for instance a Syrian resolution would most likely create a "Sell the news" effect cutting a distribution zone short.

When I say distribution zone, this all comes back to the concept of the reversal process and how they are proportionate. The market could move up in to distribution, but at some point we get more laterla (rangebound) trade, the head fake move would be the strongest indication of a market ready to make the next leg lower which is the last part of our expectations.

I hope that gives you a better feel, I'll try to make this as clear as possible as we move forward, but other than a couple of days that didn't change expectations at all, except maybe made the rally we are in now will be a little weaker than it would have been because it didn't get that final accumulation spot at lower prices Monday.

This doesn't change that some stocks will be ready to short as core shorts now and some will take a bit longer, but this is what was needed.

One of the best explanations for why we needed this move and why it is a market gift can be summed up in PCLN, you might recall where I wanted to short PCLN, take a look...

I wanted to short PCLN ABOVE the recent former high on a head fake move that has distribution in to the breakout, there was little chance PCLN could do that without market help (not saying this is all about PCLN, it's the concept). Shorting PCLN above that last high is where the best price and the lowest risk are to be found. So long as there's distribution and I can't imagine any circumstance that is probable that would stop PCLN from being distributed, then we also have a very high probability trade.

This is exactly what we look for, we don't chase, we stalk. PCLN up there is the best price for a short entry which is the same as being long, sell high and buy low, you just happen to sell first. It's also the lowest risk and we don't enter without confirmation so it becomes a high probability position as well, this is but 1 example of why this move is even in place, THE SECOND REASON IS THAT RETAIL WAS EXCEPTIONALLY BEARISH, TRADING IS A ZERO SUM GAME, WE CAN'T ALL BE ON THE SAME SIDE OF A TRADE AND MAKE MONEY SO ONE OF THE MAIN EXPECTATIONS I HAD FROM THIS MOVE AND THE REASON IT NEEDED TO BE "STRONG" WS TO FLIP RETAIL'S SENTIMENT TO BULLISH.

Wall Street needs someone to hold the bag, who better than retail? Who else other than retail?

Quick, but IMPORTANT Market Update

This is a gut feeling based on very imperfect information.

As you know from the IWM put and VXX call, I think we get a market move to the downside, I'm not convinced this is anything more than a move that is essentially chop.

I'm not seeing the large positive divergences in gold that I'd expect to see if the market were about to break down hard, in fact according to our initial expectations of the market coming out of the accumulation range, this wouldn't even be the end of the upside move as it was expected to be larger than the range.

So I'm thinking we get some chop starting with a downside move. Although they tried today to get the SPY Arb to work (see VXX), they couldn't, however I think the Yen pulls back, it may take a day or so to complete that move, but that would allow the currency crosses to come back to support the market.

You have to keep in mind what the original purpose of the accumulation range was, to send the market higher, to sell accumulated shares at higher prices and the grand-daddy of prizes, to short that strength. 

We did get a fundamental surprise as the week started with the Syrian diplomatic measures, not the market rallied right as that came out, when it should have pulled back to the bottom of the range Monday, but this would just have been to accumulate and create a stronger base for the market to rally from so it doesn't rally matter, the market moves up and that was the end result we expected from the range.

It's difficult to say if the market can put in any significant gains from here, there are a few stocks I see that need a little more on the upside like BIDU, PCLN (these are close to resistance areas and those are magnets, especially for those who want to sell short in size, they need those breakouts.

The general feeling I get is that the market (from initial expectations) should make a stronger move to the upside, but since the events (fundamentals) on the ground have changed and could change again, there's always a "Sell the news" on any Syrian resolution.

As I said earlier today, in my view, the market NEEDS more of a reversal process just so longs can be sold and shorts entered, it wouldn't be a big deal if the accumulation range hadn't been as effective as it was, but this in no way looks like a new bull market or resumption of such.

I think we get a lot more chop than people might expect, so that means more hit and run shorter term trades while setting up for the big trending shorts or core positions.

I think by the time the market is really serious about a major break, gold will be clearly under heavy accumulation.

This is a REALLY difficult market because we have 3 fundamental events, Syria, the Taper of QE and the replacement or not of Bernie which depends on Syria. In addition, the hedge fund herd will be breaking up so this looks to be one of the most challenging markets, however if we play hit and run on positions and ONLY take the best looking positions, don't get greedy that you'll miss a move, don't get scared that a move looks too strong, I think we'll do better than fine, we may be some of the only ones left standing.


VIX Futures

The intraday 3C chart for VIX futures is flying in a leading positive divergence.

Again, I get the feeling that were are about to see some market downside, but chop as well, I'm not convinced this is the big downside break as you know, but for the time being, I'll take VXX long or UVXY for a strong, even if short move.

1 min VIX Futures

VIX Futures: VXX / UVXY / XIV

We have good confirmation for a shorter term trade here like a call or a leveraged ETF, I'm not convinced of a longer term trade (as you know, VIX moves opposite the market), that means there's still a very open and unresolved matter of how much top/distribution we get here. Normally I'd say quite a bit more, but several things this week did not go according to the cycle that was set up, it seems Syria has more fundamental influence than any of the past MENA revolutions, for this reason it makes the market highly unpredictable which it already is with increased volatility and the probability of the hedge fund herd breaking apart.

This is why I think good signals are more important now than ever.

As for VXX or UVXY long, I mentioned them as longs earlier and that I'd be looking to get involved, I may even add to them if I am given the chance and it looks reasonable.

For now, I chose calls/leverage because I don't see this as a long trade like we might expect as the trend returns to a primary down.

 VXX 1 min intraday

VXX 2 min

UVXY 5 min confirms

And the inverse XIV with a leading negative 2 min (as well as several other intraday timeframes) also confirms.

VIX Futures. VXX is based on the VIX futures, but in this case I give the futures even more wieght because as I said yesterday, the most likely way the market can support itself seeing as how the carry currencies were failing is via SPY arbitrage and the 3 components of SPY arbitrage are VXX, HYG and TLT so price movement in VXX may have more to do with an attempt to support the market with the SPY arbitrage than actual demand. 

Since VIX futures ARE NOT part of the Arbitrage scheme, I trust the signals there to be cleaner.

This is the intraday 1 min

VIX futures get more impressive though as the 5 min is clearly positive, but here's where it really gets interesting...

VIX futures 15 min positive, this is why I'd add to VXX on a dip or a head fake move below today's intraday lows, because of the strength in futures.

As far as why I don't think this is a longer term trade as in, market crash yet, this 15 min chart "should" see a new leading 3C high, that's when I'll be convinced there's significant fear.

Trade: VXX Calls (UVXY long)

I was just capturing the charts for this post and VXX started to move.

Again, I'm not viewing this as a primary trend trade, but I think UVXY long (equity) will work as well as VXX calls, I'm going with $14 calls.

I'll have the charts up in just a couple of minutes.


Trade: Opening IWM Oct $105 Puts

I'm not counting on a long term trade here, I do think we see some near term downside though.

Trade Idea: AMZN (Short)

I already have exposure to AMZN as a core short (you may recall the long wait for >$287.50 and >$300) , I may very well add to it. I do prefer AMZN as an equity short as a trending position, this is obviously a longer term position.

As far as options, I'm not convinced this is the best place for them, but I'd be open to some puts if I felt the trade looked strong.

If I didn't have any exposure to AMZN short and liked it, I'd consider phasing in to the position in 2 or 3 parts, depending on the position size.

 AMZN's long term primary trend (2-day), note the time-scale in terms of years and specifically the strong leading negative divergence/distribution as AMZN moved above the psychological $300 level.

 4 hour chart with 2 of the "Phasing in" trade levels, >$287.50 and >$300, the current 3C position is leading negative since we came off the July top.

 60 min leading neg. at the July top and in leading negative position now, but 3C has been moving "in line".

I don't think it will take very long before the shorter term divergences move to these charts. The real damage though is on the longer 2-day and 4 hour charts, everything else is just timing the position.

 The 15 min chart is a significant timeframe, we nearly doubled a portfolio in less than 2 months just trading from 15 min signals. You can see the July negative, a small positive for this last run up and now the 15 min going negative again. I don't see an obvious head fake area for AMZN to hit other than $300, which it has already hit. As far as initial targets, all of the popular moving averages have provided support in the past, the 50, 100 and 200 day. For those who may want to pyramid the short (see my article "Making more than 100% on a short"), then these areas and bounces off them would be where I'd be adding to AMZN.

 Now from the shorter timeframes, the 2 min and the head fake move above $300 in yellow, this is a pretty sharp divergence, I expect it just gets worse and moves down the line.

The 10 min chart is negative, it has obviously migrated to the 15 min chart so I don't think it's long before the longer timeframes get real ugly as well.

I do like AMZN any where above $300 as a short play.

Closing XOM SEPTEMBER $85 Calls

I still like XOM long for a counter trend rally, this is why I'm leaving the XOM October $85 calls in place.

Trade Ideas

I'll be looking at VXX very soon for a call option, I think UVXY long equity would work as well.

Right now I'm finishing up a post on AMZN as a short.

IYT/Transports Follow Up

Liquidity is poor and the momentum for a put is not choice for me, I decided to go with IYT equity (ETF) short, I went with half of a  full size position.

I'll get some charts up very shortly.

Trade Idea: IYT (Transports) short

I'm going to be looking at IYT/DJ-20 Transports puts, to me this looks like a parabolic move from yesterday that is ready to fail, this also means the market is not at all as strong as price appears.

Closing TECL (equity long) & MCP (equity long)

In TECL (Technology Bull 3x leveraged), I'm just not convinced of any significant upside left, I'd rather take the gains and create some resources for new positions, shorting strength, adding back to core shorts that were closed because I expected a bounce and basically putting the portfolio in posture with the main or primary underlying trend is the MOST IMPORTANT task of all. I don't see TECL as being worth interrupting or delaying that task at this point.

MCP I actually still love, I have thought that this and a handful of other longs, could stand on their own feet without drafting the market, however (this is the equity long, not options), I think a pullback is likely and I'd rather not sit through the downdraft.

I don't fault any one who would rather just sit and wait it out, I'd just prefer to have resources available to put to work in areas where I think they'll yield the highest returns right now.

Financials Update

Financials look like a decent short, I kind of prefer the 3x short Financials ETF, FAZ right now.

Just like the head fake is a concept that we have learned about through 3C and paying attention to the market, understanding why it's important; the "Reversal Process" is a concept as well and this is where I have a little trouble committing to Financial shorts at least in XLF right now.

The "Reversal Process" is exactly what it sounds like, a process rather than an event. We look at the market through our experiences and biases and we know that if we want in or out of a position we can usually do it in seconds, however, Wall Street's positions are so large that they can't put their entire position out there like we can otherwise they move the market against their position and a gain can become a sharp loss. This is why we see reversals that look like "W" or rounded tops/bottoms, but very rarely do we see a "V" reversal because that's an event, not a process.

Other than a few charts in XLF that I'd like to see catch up in the longer end, my only real reservation right now is the reversal process is not proportional to the move and they tend to be proportional (as well as include a head fake move most of the time toward the end of the process).

Charts... XLF
 This is the longer term 30 min chart, there's a clear top which I believe is part of a sloppy H&S top and this last run at the green arrow would be the top of the right shoulder which is one of only about 3 areas I'll short H&S tops at.

You can see the 3C chart is not very positive, more in line, but some of the shorter term charts are very negative and I think it's a matter of time (the process) before they turn these longer charts clearly negative.

This is the intraday 1 min chart showing a flat range which is where we most often see accumulation or distribution. You can clearly see why I closed the XLF $20 calls yesterday, there's no more upside momentum after I closed them so they'd just be losing value ever since they were closed yesterday so that was a good decision.

The other obvious point is the distribution, leading negative.

 We see the same on the 2 min chart, it's a bit more serious than you might think, essentially nearly all of the upside gains have been sold in to, as I said, Wall St.'s positions are so large they need to sell or distribute them in smaller chunks and in to price demand other wise their long positions with too many shares out for sale, would alter the supply/demand dynamic and send XLF crashing lower, this is a large part of the reason that distribution in to higher prices is common.

The 3 min chart shows the same, from accumulation where shares would have been bought by smart money in anticipation of a move higher to the area where the market should have pulled back Monday and a strong leading negative divergence ever since.

I originally thought the distribution here was to facilitate a head fake move to send prices back to the bottom of the range and the large upside rally was still on, at this point though it's hard to say. Only the size and strength of distribution is going to give us the probabilities there.

 XLF 5 min leading negative is really the first serious institutional timeframe so this is serious distribution, this is why I prefer FAZ right now over an XLF put option, the matter of draw down and time decay until we have a better understanding of how long the process up here is likely to take.


XLF 10-min is also confirming heavy distribution.

FAZ, 3x short Financials, this is the opposite of XLF
I show this 30 min chart and the accumulation there for 1 reason, to show what the reversal process looks like and how they tend to be proportional to preceding moves. This current base in FAZ is not very old, not very well formed. Can you imagine a straight up reversal right now and the "V" shape FAZ would take on to the far right? You just don't see those reversal events very often, so to me it looks like XLF and FAZ both need some more time to build a base and distribute a top.

FAZ however is confirming XLF distribution with FAZ intraday accumulation in to a flat price range. As I mentioned before, accumulation/distribution most often occur in quiet, flat markets.

 The 2 min is leading positive in FAZ

as is the 3 min

and the 5 min so we do have the concept of "Migration" which tells us if a divergence is just noise or it's building a stronger trend which FAZ is doing.

As for the XLF H&S top, this is the daily chart. The reason I say, "sloppy" is because the move from the top of the head to the neckline on the decline fell way short. There was a small gap above that XLF filled so other than that which is now filled, the only thing I see that is holding me back (I'm actually just showing patience) is the reversal process, take a look at the process at the top of the left shoulder or the head, you can see it's much larger than simply 2 days. However with the market in the position it is in, I expect to see increased volatility and sharper moves, but I'd still expect a little more of a process.

We'll keep watching it, this may be a great candidate to phase in to and their may be some more mature individual financial shorts available.

GDX Update: Just as Expected

The earlier and last GDX trade update I'm going to do until it comes to management, was posted earlier this morning, I had captured and uploaded a chart of where I thought a small intraday head fake move would take place as a timing marker for an upside reversal and just as I was writing the post, the move started.

Now the move appears to be over, if you got in to a position on the head fake move then you got an excellent/low risk position. Here's what happened since the last GDX post this morning.

 This is the expected GDX head fake move as the smaller base was well formed and mature.

The accumulation in to the move below support is apparent in GDX...

 Also in the 3x long NUGT

And in the inverse, 3x bear gold miners, DUST as distribution on it's head fake move.

so far, so GREAT!

Market Update

Since the market seems to be in a place that was not originally part of the intended cycle (thanks to diplomatic efforts that kicked off the week, drastically changing the "war-footing" or saber rattling), I want to be careful to not make the mistake of assuming #1 that the diplomatic efforts will continue to discount the war premium as they seemed to have stopped, #2 that the current 2-day old initiative toward diplomacy is anything more than a 2-day old initiative  #3 I don't want to assume the market will do what it would normally do up here (flat-distribution).

In other words, there has to be some really strong signals that are unquestionable or as close as we can get to that place.

So far as expected yesterday and last night, none of the potential currency engines are working to support the market which leaves the SPY arbitrage which is not in effect yet, but moves in VIX futures seem to be an attempt to establish it again today since carry pairs aren't going to do the work.

There are a few areas where there are some interesting charts that are very close to trades, Financials (short) is one, I'll be featuring them shortly.

We still have plenty of time today to see where things are going and I wouldn't expect to get anything very useful from a.m. trade.

I'm going to try to give an overview rather than a long post with dozens of charts.

 None of the carry crosses (currencies) are in position to help the market as expected yesterday leaving the SPY Arb as the next choice in short term market manipulation.
 AUD/JPY 5 min

 E?UR/JPY, the former engine of early this week now failing

USD/JPY not helpful either.

As for the market averages thus far, they are not all confirming each other in all of the timeframes, but the general tone is confirmed throughout them.

 SPY 3 min intraday looked ready to move to the lower end of the range with the red arrow divergence as of late last week, that is what we expected as well until new fundamental data on Syria entered the picture and the discounting mechanism sent the market higher ion reduced chances of conflict and more certainty.


However, that move appears to have been sold in to which is exactly what we expected from the "expected" strong trend to the upside which is what we expected to occur after a brief pullback to make the base stronger to support the upside trend.

So we may in fact have a weaker upside move because the base wasn't re-inforced and we seem to have early distribution, essentially in to any reasonable price strength, this changes the out look of this section of the expected moves, it becomes more volatile and less predictable with most likely, a shorter lifespan up here.

 SPY 10-min  shows again where the market was ready to pullback to the lower end of the range to accumulate and create a stronger base for the market to rally from, we lost that move early this week on John Kerry's comments about dis-armerment that the Russians, Syrians and Chinese jumped on immediately, "YES, BRILLIANT IDEA! WE BACK IT 100%"

I still can't figure out if Kerry made a mistake that created this situation in talking off the cuff or if this was the administration's way of avoiding a congressional vote that they were destined to lose, likely even among their own party?

 DIA intraday 1 min leading negative, again apparently any strength has been aggressively sold in to.

DIA 5 min showing a sharp leading negative divergence in to higher prices, I think there's little doubt of what is happening, it is what we expected, the doubt comes in to play as to how this wraps up.

 IWM 5 min

QQQ 30 min, this is now getting to be a very serious negative signal, this is the kind of longer term negative signal that I'd like to see to have more certainty, but when a cycle is screwed up and you have a fairly large accumulation base, the shares (long) from the base need to be distributed and the main reason they were bought was to send the market higher to sell short in to so not only do the initial shares have to be sold, but the reason for buying them, selling short in to higher prices has to occur as well, I just don't know if the market has the support mechanism to hold prices in place in this area for long.

Trade Idea: GDX / NUGT Long

This is likely the last time I'll bring up GDX as a trade idea, it's in a great spot, I've mentioned it because of that several times, but by this time you are either in the trade or have decided to take a pass, so this will be the final update until we get movement with Gold-miners (GDX or the 3x long leveraged NUGT).

 The intraday chart since a move below obvious support, which looks like an obvious stop run (head-fake) because of the divergence there and the obvious range of well over a week.

I marked the intraday head fake level because it would not be surprising to see that, we often do with rounding tops and bottoms (I describe the head fake of a rounding top to look like an "Igloo, with a smoke stack", the bottom would be the same just flipped upside down. $26.42 is the area that would have to be broken and although it seems bearish, in this case, it's likely the timing marker for the start of an upside move since the lower base is proportional and positive already, in essence ready to go.

***As I'm writing this, GDX is making that move right now below $26.42, if I do further updates on GDX they will just be to confirm the head fake move here***

The 3 min leading positive at the larger head fake  / stop-run move.

A longer term 15 min chart, so in my view this is good for at least a swing trade, thus my consideration of NUGT long rather than just option (calls).