Tuesday, April 19, 2011

After Hours continues to be nutty

Just looking at IBM, it's been up over 2% and down over 2% from the close. I mentioned the other day that I believe some more important setup may be occurring in AH, whereas in the past I never paid them too much mind as they rarely held. So I suppose we'll see where IBM lands tomorrow on the open.

Going into tomorrow and Thursday the earnings load gets a lot heavier, I think there's about 175 reporting tomorrow and over 200 on Thursday, there's some biggies in the mix as well.

A Dizzying After Hours

INTC has the market in a tizzy after hours with a strong beat, IBM also came in on what was hailed largely as a beat (beat on earnings, upped guidance, up on revenue, and raised full year guidance, but missed on their margin). IBM was up 2% in after hours, and currently is down now on the day. I've watched several other stocks up quite a bit initially and now fading a bit. INTC  seems to be holding around $21.11.

Tomorrow after market we'll see what AAPL posts, I suspect I'll be spending a lot of time watching AAPL tomorrow after last week's last minute move in GOOG.

Last Market Update

There's some negative divergences on the 1 min chart that ma lead to some after hours selling or perhaps a weak open tomorrow, but everything after the 1 min chart seems to suggest there's more upside in the major averages, the still haven't filled the gap yet, I think there's a good chance for them to do that.

VXX Hitting All Time Lows

The VXX is similar to the VIX, it's a short term volatility index and extremes in these indicators usually produce inverse reactions in the market.

While my opinion of the market's near term action has been for the market to recoup some of the Monday gap down, and perhaps some, the big picture is getting uglier.

 VXX making all time lows

 The VXX in green vs the S&P-500 in red, you can see the inverse relationship and that we've never seen a low like this before.

3C actually worked well on the VIX showing a divergence that caused the market to fall in April of 2010, this divergence is even stronger then the 2010 divergence that saw the market fall approximately 16%.

JRJC FOLLOW UP

Yesterday JRJC was posted as a trade idea. I posted a couple of ways to trade it, ether way you'd be at a profit today as it's up 6.68% today thus far.

 JRJC 1 min in line and confirming the price move

 10 min is also confirming today's move

 And the 15 minute is also confirming today's move.

Volume is up, so far it's a pretty strong candle, the higher in the range it closes, the higher the probability of follow through buying. The Pattern implied target is $5.60. If you are in this trade and need updates, feel free to email me.

CAT Trade-Idea Update

Yesterday I presented CAT as a trade idea that should come to you rather then chasing it. 

 Today CAT gapped up and is right now at a strong zone of resistance.

Here's yesterday's leading positive divergence, the idea was to let CAT bounce up a bit and get better short positioning on it. Right now the 5 min chart is falling behind a bit, but I believe this is largely because of the resistance zone it is now trying to overcome.  As I mentioned yesterday, if you like the trade, keep in touch and we'll keep an eye out for the reversal which should provide a high probability/low risk trade on CAT.

Breadth

At the last update I commented that the negative divergence in the SPY seemed corrective and we may see lateral movement, that's what we have seen since,


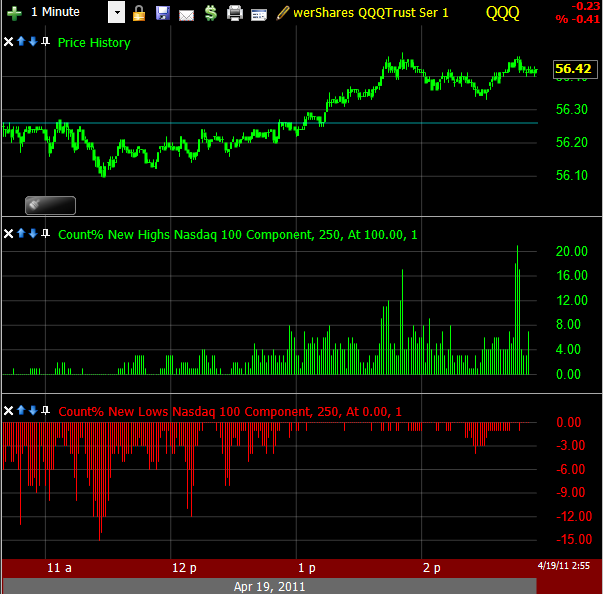
 Breadth in the Q's has been fairly strong since the lateral correction, it suggests to me that we still have room on the upside as was my opinion yesterday

More NASDAQ breadth, the A/D line has been strong, there's a slight dip now, but it's not anything I'm too concerned about right now. The TICK index has been rather mild today, it seems like a slow and steady move in the market. The only thing that bothers me in a market that is usually very volatile is the relative calm today, we saw that Friday right before breadth and 3C fell apart on the S&P downgrade of the US economy.

USO Update

 USO daily doing a lot of shaking the tree around support/resistance

 Here's the zone I identified last week as a likely target accumulation zone.

 Looking at this 1 min chart, once prices get too far out of that zone, they are knocked back down and it appears accumulated again near the bottom of the zone, this happened this morning with a gap down that showed a positive divergence driving prices up, now we see a negative divergence, presumably to send prices back to the accumulation zone.

And her's the same zone with the support/resistance level, each time it breaks above or falls below it shakes out a lot of traders or causes them to enter positions that they'll likely be shaken out of.

Although the choppy action is making the chart a bit more difficult to glean clarity from, I do think that USO is still under an accumulation period before a new leg higher is launched.

Market Update

 DIA 1 min-There's been an attempt to strengthen this chart since yesterday's weakness

 DIA 5 min Here we have a leading positive divergence

 DIA 10 min This chart is starting to fall behind a bit, but it may still catch up to in line.

 DIA 15 min this chart looks fairly strong, so my opinion as of yesterday with regard to the market's short term direction seems to be playing out as expected, there's still some room to go though to fill the gap.


 QQQ 1 min The Q's look a bit weak today on the 1 min

 QQQ 5 min The 5 min though is trading in line, confirming price action thus far

 QQQ 10 min The 10 is also confirming price action, in line with yesterday's theory.

QQQ 15 min The 15 min does look quite weak here. This will need to be watched.

 IWM 1 min, like the Q's the 1 min is showing some weakness lately in the afternoon trade

 IWM 5 min However the 5 min is still very positive as the IWM looked the strongest yesterday

 IWM 10 min On this chart, at the green arrow, you can see the up cycle that had started until Friday's leak sent it lower.

 IWM 15 min The 15 min chart , like most others looks like it wants to try to fill the gap

 SPY 1 min this is a minor divergence at this point and may just lead to corrective action, possibly lateral, however I'll watch it for signs of further deterioration

 SPY 5 min This chart is in line, suggesting there's more potential for upside and filing the gap

 SPY 10 min The same is true on the 10 min.

SPY 15 min Again, like the IWM, we see the interrupted cycle from Friday's leak, otherwise, this chart is in line.

The bottom line, while there's some mild afternoon weakness on what otherwise is a rather dull day (the days I'm always suspicious of), most other charts seem to indicate that the market will continue to try to fill the gap as was talked about yesterday in the most likely course of the short term market behavior.

NYSE MAGIN DEBT IS OUT.

You can find the actual data here for the most recent month, March and you can look back historically as well.

The bottom line is that investors continue to leverage up on margin, which now stands at just over 3 years highs (Feb 2008) which was also about the time the market top had been broken.

When you put together a low volume environment, a lack of participation by investors, over priced equities in a margin squeeze environment with extremely low short participation and multi-year margin debt; you really have the makings for the perfect storm. This scenario fundamentally speaking is worse then 2007 because at least in 2007 we had participants, volume, the market wasn't run by algorithms to the extent it is now and there were plenty of shorts in the market.

What this means for you as far as today, not much, but it should be noted, as a matter of fact this is a fantastic tome to keep a trading journal. We are really in a historic market which I believe will lead to another, even bigger historic market. It's good to keep notes on how it all went down.

POMO and The PD's

I remember last year there was a suspicion that the Fed had arranged deals with Primary Dealers behind closed doors which covered the PD's profits, risks or lack of risk, and what they were to do with their profits that would be mutually beneficial to them and the Fed. A pattern of bonds issued within the last few months, being monetized by the Fed, slowly started to come to light as suspicions were confirmed.

Now, there's no shame whatsoever. The Fed grabs brand new issuances at the first chance they get and the obscene profits the banks/PDs make for carrying no risk, just being a mule for the Fed, is astounding that they are so brazen to do it so openly.

This story details the issuance from the Treasury, how much Primaries took down and how much they flipped to the Fed just weeks later (because POMO was over, otherwise it would have been sooner). This is mass corruption right under every one's nose.

Market Update

 DIA 1 min, this is the distribution from earlier, not too worrisome, now we're seeing a bit of accumulation it appears.


 Same with the QQQ, early distribution which appears to be turning into accumulation for an intraday move up.

The SPY is also starting to show signs of accumulation.

PCLN Possible (Trade)

 PCLN has many of the features I look for in a reversal from an upward trending cycle that is ending. First the lateral movement that has created a clear resistance zone is very typical, we also have a break out on the close above that zone, which failed (at the white arrow).  I'd prefer that the breakout had been bigger to attract more attention, but it's there, possibly we may get one more.

 PCLN Here on the 30 min 3C chart we see several moves above resistance, all saw distribution.

 On the 15 min chart, we see the same thing again, every move above resistance sees strong distribution.

 On the 10 min chart we have several recent intraday attempts, both have seen negative divergences.

The same is evident on the 5 min chart.

I like this trade as a potential short right in this area, although I'd have a stop wide enough to handle any further potential false upside break outs.

Market Update

So far there are only light signs of distribution on a 1 min chart, the 5 min charts are largely unaffected to this point. Truthfully, not much going on yet, but just like last Friday, it's the quiet days that tend to get interesting real fast.

It's All About the Catalyst

Yesterday in my market analysis for today, I felt the most likely move for now was going to be to close the gap at least and there may be some good earnings report or something news out of the Fed that would be used as a catalyst to prime the move up.

Could this be it?

ZH Notices the Changes in After Hours As Well

Yesterday I remarked how the tone and activity of after hours trade seems to be changing, ZH just ran essentially the same thoughts, except they have a cool Bloomberg terminal.

It's certainly worth looking into, I'll have to look for some good after hours, real time software.