Wednesday, August 13, 2014

Daily Wrap

The F_E_D's accommodative policy skewed and screwed up just about every indicator out there since late 2008/early 2009 as there was really only one thing that mattered... the size of the F_E_D's balance sheet and expansion...
The F_E_D's balance sheet, up about $3.4 trillion dollars since late 2008 has a very clear correlation with the S&P-500. There are multiple reasons why this was the case, but one of the simplest was what I consider to be a "Stealth Bank Bailout" because as you may recall, the AIG/GM bailouts were not very popular and the banks needed it so to avoid political suicide, the F_E_D went to Quantitative easing which had a very bad ending in Germany/Weimar Republic as well as just about everywhere else it has been tried (i.e.- Zimbabwe).

If you wonder why technical indicators gave so many bad signals above and beyond the fact that Wall St. uses the dogma of Technical Analysis against traders as they refuse to adapt, just look at the S&P's performance during QE or similar operations or more specifically look at the market's performance between operations, there's an eye opener!

From left (March 2009) to right (Jan. 2013) we have QE1's expansion as it was originally only MBS, the expansion added treasuries and the market took off. The grey periods are when no accommodative policy was in place and they all decline, some as much as -20% in a very short period. In green is QE2, but the market started up before that as it was announced at the Jackson Hole Symposium well before it was enacted or officially put in place. Purple is Operation Twist, then Twist 2 or what some call QE3 and to the right, QE4. there's a very direct correlation between F_E_D printing/balance sheet expansion and the market rising, which is why it's mind-numbing to consider the perma bulls who think the market will continue up for the foreseeable future when we can very clearly see, "when the F_E_D is not expanding its balance sheet, the market is falling". Who doesn't know that the F_E_D is not only exiting accommodative policy/balance sheet expansion via the taper, but something far worse for the market, THE END OF ZIRP AND INTEREST RATE HIKES? 

I mentioned that to mention this; before QE, 3C timeframes were VERY predictable (this was also before HFTs dominated the market, but that seems to have less effect as the very nature of their speed is built more for scalping, arbitrage plays and front-running rather than position trades (you don't need to be able to trade in micro-seconds for a position you plan on holding for 6 months).

One minute charts were market makers/specialists moving the market intraday, 2 and 3 minute charts are essentially the same. At 5 mins we have the first or fastest time-frame that picks up institutional actibvity intraday (although that can be seen on longer term trends of faster time-frames like 1-3 minute). A divergence on a 10-15 minute chart was almost always a clean swing trade, in fact in an experiment after the July/August 2011 plunge, there was a range bound market from early August until early October. We used 5-15 min charts and traded EVERY swing up and down with 2x leveraged ETFs and hit everyone for a portfolio gain of +85% for the period which is normally a very difficult market to trade or what most traders find to be a meat grinder as few trades lasted more than 3-5 days. In addition to calling the August bottom 2-days ahead of time, we caught 9 swings with 100% accuracy as well as calling for a new head fake low to be followed by  strong rally (which came October 4th).

The 2011/-20% decline in which we called the end of the decline a couple of delays before the market bottomed in early August, we traded every swing long and short with 2x leveraged ETFs like QLD/QID and called for a new head fake low before a strong rally. That's how easy these swings were to call with a 5, 10 or 15 minute 3C chart.

*Note this was also a period in which there was no F_E_D accommodative policy in effect.

The 30 and 60 minute charts typically were very good at calling intermediate move such as the 2008 USO decline of -80% after we had gone through the G.W. Bush-era oil boom.
Over nearly 8 years oil had seen a move up of approx. 700%, we called the USO top within 2 weeks, ironically the same week Cramer was telling his audience to go out and buy the next bad EIA Energy report in what he termed a, "Contrarian Trade". I don't know how millions of viewers all buying oil on the same day after a +700% run can possibly be called "Contrarian" . If you followed Cramer's call, you were left holding Goldman's bag as oil plunged -80% from there.

As the F_E_D unwinds QE via the taper, these charts are once again becoming more and more accurate or perhaps timely is a better word as they have shown underlying trade with uncanny accuracy as we recently learned when Bank of America/ML released this infographic of the net positioning of Hedge Funds, Institutional Money and Retail.


The 3C divergences and the velocity of them matches up nearly perfectly with Institutional "Net Sellers". Look who the net "Buyers" have been... Once again, retail will be/is holding Goldman's bag.

In any case, I won't enter or exit a trade without strong, objective evidence which has led to periods of inactivity, most recently an approximate 2.5 month period just after the February Rally in which we had no good signals for several months and our trade ideas fell off by 90% by the end of the period...
As we live on the right side of the chart and don't have the benefit of hindsight, all I knew at the time was it was very frustrating not to have any strong signals for trades, it was only after when looking back that it was apparent there was a 3% range in the SPX which was eating longs and short alike alive, a MEAT GRINDER.

I just wrote about "Patience" Monday night, which dovetails nicely. I'm always learning something new from 3C as the market changes, but one of the most important lessons I've learned this year is to wait for the signals, if they are not there, there's probably a good reason and missing a trade is a lot better than taking on a low probability trade. It took a while for me to learn to take losses and be happy about it (before they turned in to catastrophic losses), it also took a while to learn (and I'm still fine-tuning the lesson) to understand that missing a trade is not the worst thing in the world, in fact it's no bigger a loss than opportunity. However, as I said earlier, "It's a lot easier to keep it than to make it back" with the example of a 50% loss requires a 1005 gain just to get back to break-even.

With all of that in mind...I've shown some bases forming and it appears we were right on these lateral trade areas being bases. Last Friday's (8/8/2014)  Week Ahead Market Update said the following,

"Last week as the market was moving down and things were getting oversold (breadth), the "Week Ahead" post (8/1/2014) expected a wider base to form early this week and a bounce off that base. It seems we have a wider than anticipated base and I say that because there's improvement on the intermediate charts that represent a bounce of the scale that can move the market from deeply oversold (breadth) levels which it has been sitting at all week, to a sentiment changing move. This would be the first major pivot/trade set up since the short from late July. I typically want to enter my trades at these major pivots and then let them work until the next one sets up.... 

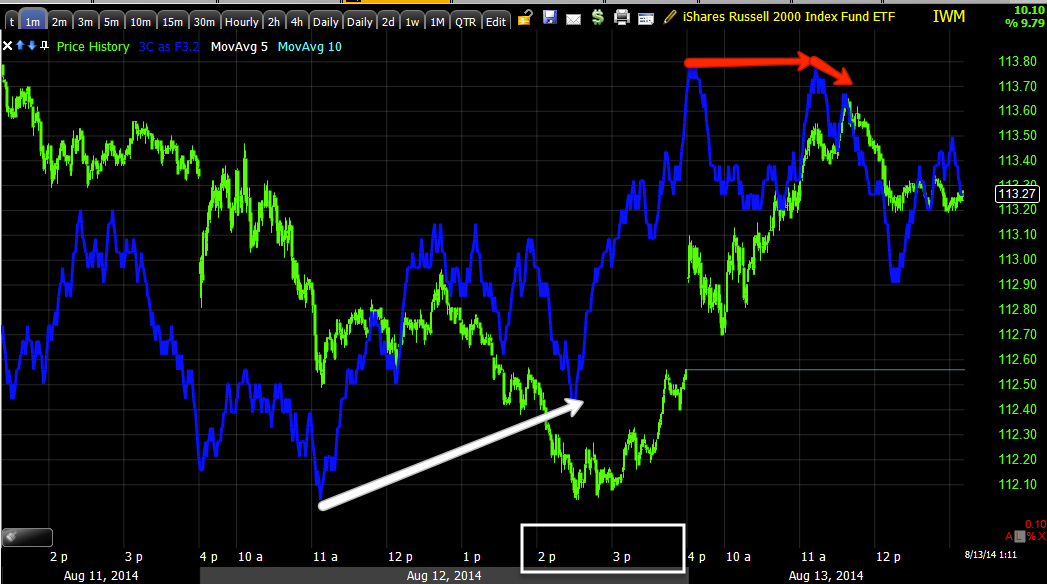
The 2 min charts look like we'll see some weakness moving forward today, maybe in to early next week,  it is this weakness that I want to use to re-enter a call position, likely in the IWM, but it will depend on what looks like the best set-up at the time.

ideally from here we get an ugly intraday pullback that can be used to enter a leveraged long ETF or call options. I still consider this speculative as the larger trade and best use of any bounce is to short in to price strength for long term core positions.

That's what I see as of right now so I suspect that we will be seeing a stronger bounce next week so I want to look for the right entry for something like the IWM calls closed earlier."     8/8/2014 1:30 p.m.

So our forecast from 8/1 was for a wider base to be built which was actually wider than originally anticipated. Friday's (8/8) Week Ahead Market Update forecast was for early week intraday weakness that could be used to enter some bounce longs and a move up in to this week off this base...
 The lateral base for the QQQ (60 min chart) and this week's initial pullback intraday Monday and most of Tuesday followed by higher prices today which was in line with last night's Dominant Price/Volume Relationship, the non-influential "Close Down/Volume Down".


We even have a strong 10 min 3C positive divegrence at the base area, but we haven't had any strong trade set-ups. I don't know how this story ends as we live at the right side of the chart, but  as I said earlier today, "We don't trade probabilities, we trade high probability/low risk set-ups".


Here's what I've noticed about the market thus far today...

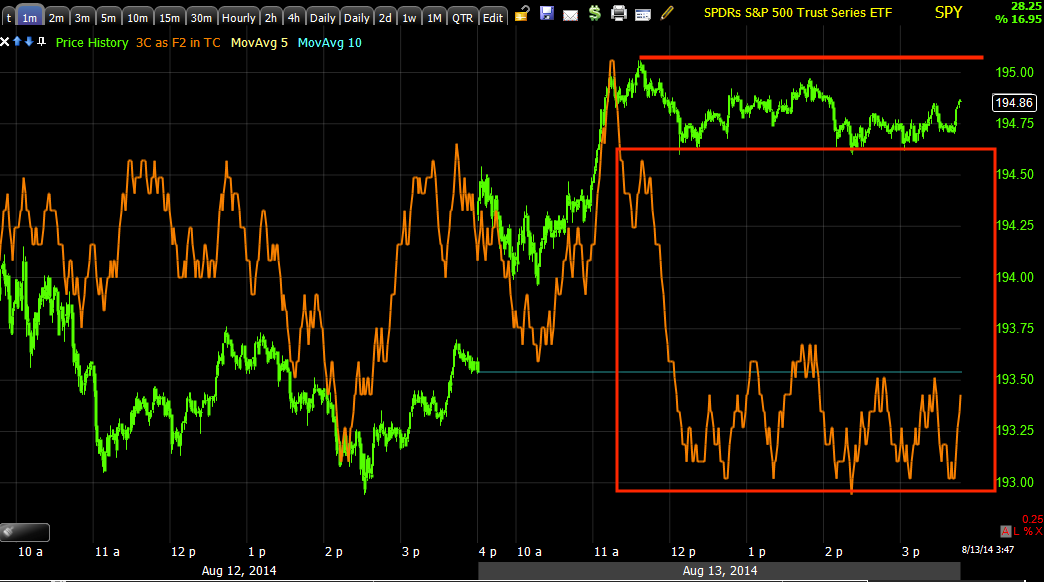
Yesterday's late day positive divergences in the 1-3 min timeframes which developed very quickly, never made it to the 5 min timeframe which is essentially the line in the sane, unless there are very good reasons, I rarely take a trade without the 5 min charts confirming as the concept of 3C migration would mean a 5 min divegrence shows institutional money is active and probabilities are on our side for a short term trade.

Last night the late afternoon divergences were described as a late day ramp attempt to unchanged and/or VWAP.

Today...
Today ES hit the upper S.D. of VWAP, the ideal area for a market maker or specialist to fill a sell or short order for an institutional client. Intraday 3C charts, especially in the 1 min range (intraday movement forecasts) seem to take a hit right around the European close and then spend the day drifting as if market makers/specialists are working the bid/ask (tweaking supply/demand) to maintain the market's range near VWAP and or holding back an all out plunge.

 Today on the SPY intraday chart, right at the European close 3C goes leading negative and remains there, losing no more ground, but not allowing price to gain any ground either.

Monday and today both saw similar price action right as Europe closed.

 The major averages on Monday all top out at the European close, although we had forecasted intraday weakness for the early part of this week on Friday.

Then again today, except for the QQQ, none of the averages managed to gain after the European close which as you saw above, came with a sharp leading negative 3C divegrence.

In fact, none of the carry crosses moved after the European close (USD/JPY, AUD/JPY, EUR/JPY)...
USD/JPY goes dead in the water with the other carry pairs after the European close making me wonder if DE Shaw's algos' are still tied to the USD/JPY-ES correlation or perhaps something else was going on and the markets were having more trouble treading water at the upper channel of VWAP than we realize...

The "Short Squeeze" has been virtually a thing of the past. Earlier this year we had short squeezes that lasted weeks, since July 1 I can't recall one that has made it through an entire day, although the opening squeeze has been quite common.
 Our MSI (Most Shorted Index) popped on the open and then once more in to the European close and then underperformed the rest of the day.

In fact, take a look at the MSI on the day...
I saw a bit of this at the close yesterday, but today there's clear underperformance of the squeezable shorts as they underperform even the broad market averages, which has me wondering about breadth.

You may recall what happened the last time the MSI underperformed the market...
5 min MSI vs SPY. The last time is the move that took several of the averages, notably the Russell 2000 to red on the year and brought market / NYSE breadth down to such low readings that they were in many cases, lower than what we saw during the last bear market in 2008 with only 20% of NYSE stocks trading above their 40-day simple moving average, the reason I expected a bounce in the first place...based on not an oversold indicator, but an oversold market of stocks.

What is interesting as most of the averages sat near an ideal selling area of VWAP...

 The stronger intraday 5 min chart which is the first or fastest timeframe in which we can observe institutional activity intraday shows the SPY seeing strong distribution , this happened Monday and again today with an even stronger leading negative divegrence today (relative to price). Again, both of these divergences are picked up around the European close.

Although the Q's had the best relative performance, they too see a strong leading negative divegrence right around the European close today. These 5 min charts looking the way they do is why I won't enter any short term long piggy back trades as initially intended. *This is also the same kind of strong, immediate distribution we saw during the last two bounce attempts, essentially distribution on ANY price strength.

The IWM did end the day with several decent looking positive divegrence, but the overall look of multiple timeframes as well as the other averages would have me enter nothing longer than a 1-day (enter today, likely close tomorrow) position, but even at that, the risk just looks to be too high to even consider it.

Also, as pointed out earlier today and this morning in the first post of the day while the market was in an "apparent" risk on mode off our base, bonds were bid essentially creating a risk on and flight to safety trade at the same time.
The SPY (green) vs 10-year yields closing the day at 2.41%.

However this flight to safety action in bonds started well before the horrible Retail Sales print at 8:30, you may recall as was the case with so many assets at the European pen until 5:30 a.m., 5, 10 and 30 year treasury futures were under accumulation and made their first move up not at 8:30 on retail sales, but 5:30 a.m. after 2.5 hours of accumulation.
5, 10 and 30 year Treasury futures all accumulated overnight and moving at 5:30. The point this morning was to show that none of this fit the "Talking head's" narrative in which they explain why the market does what it did in 30 seconds.  We may have bought the Treasury buying on the Retail Sales print if we had not seen the 3C chart showing Treasuries were being accumulated long before retail sales, in fact well before the European open.

High Yield Credit has been leading the market and supportive of a bounce as pointed out for over a week , yet underlying action in HYG is getting quite ugly, not at the point in which I'd call it a short, but at the point in which the near term resolution of price is becoming plainly obvious.
HYG's 15 min 3C chart.

In fact, considering HY Credit's underlying performance or lack thereof, Treasuries bid, the only asset seemingly not in sync would be VIX futures, but notice I dais, "Seemingly",,,
 VIX futures (5 min) have seen a positive divegrence since this week started and...

VIX short term Futures have also seen a similar positive divegrence. Just like HYG not being quite there, I wouldn't enter VXX long yet based on the lack of a reversal process on its own, however it is interesting to note that protection is being bid here.

Internals...
We've already seen S&P Futures at 40% below average volume 2 consecutive days this week, today marks the third, but at half of average volume (50%). As a reminder because the lost art of volume analysis is going to once again be front and center as the Bernanke put is completely removed from the market, "Any move higher in price on fading volume is highly suspect" and without the F_E_D to backstop the market, these concepts are going to be very important again, but I fear few traders of the "new normal" have any idea what volume analysis is. If I had only two  indicators on my chart, they'd be candlesticks and volume.

The Dominant Price / Volume theme today was co-dominance between Price Up/Volume Up and Price Up/Volume Down. The first is the most bullish, but often leads to a 1-day overbought event with the next day closing lower. The second is ironically the most bearish of the 4 relationships ad tends to have a 1-day overbought condition attached as well, but not as strong as Close Up / Volume Up. Being it was a co-dominance, I don't give it much weight in forecasting.

Of the 9 S&P sectors, all 9 closed green with the recently defensive acting Healthcare sector leading the way at a gain of +1.21%.

Of the 239 Morningstar Industry/Sub-Industry groups I track, 191 of 239 closed green, this is a FAR cry from last week's readings which were polar opposite and the main reason (other than the 10-15 min positive divergences) I expected a true, "Oversold" market bounce.

As far as the oversold breadth condition which was worse than a full fledged bear market, new high/new low ratios have returned to a more normal state. As far as momentum stocks trading 1 or 2 standard deviations above their 40-day m.a. there was very little improvement which fits with today's MSI readings vs the SPX. The Percentage of NYSE stocks trading above their 40-day moving average barely budged today from nearly 33% yesterday to 36.5% today, still a small move considering 55% points were lost over the last month. Advance /Decline lines are moving as you'd expect on the day, but are no where near repairing the damage of recent. The Russell Indices being the most recent victim with the NASDAQ Composite being the most dislocated and longest running divergence.

I'd remind you that even with the slight improvements the last several days, the breadth indicators that I've been watching for 15 years and only seen them in this condition twice are looking as bad 2007's top.

For now, unless something is obviously standing out, I think Monday's message of patience is still the way to go, we have plenty of opportunities and plenty of positions already in place, now is not the time for a mistake.

*As of this moment, the intraday 3C charts for ES/NQ and to a lesser degree, TF are all leading negative, however this is not a time frame I generally trust overnight unless the trend continues. I'll check on it later tonight.

Quick Update

I'll try to get more charts out before the close.

In my view the base that was created "looks" strong, but in such a weak market it's not performing anything like what a base like this 5 months ago would perform like. I can sum up intraday "Flat" price action with one word, "VWAP", and it looks very clear that this is exactly what's going on.

VWAP is an institutional standard by which market makers, specialists and those playing the role in HFT land are graded by, you fill a sell order (or short) at or above VWAP and you did good and get extra business, you don't, that's likely all the business you hget.

Market makers and Specialists are in a unique spot to influence intraday price by working the bid/ask stack as any orders that come in at market and don't have a match, get what the middle men post as their bid/ask and in this way and through small intraday support (or distribution), they can hold prices steady which is why we often see the heaviest intraday 3C action during flat periods that "seem" to be boring.

If you've been here for more than a month than you know I always compare these flat areas of price (like today intraday) to  "The kids in the room next door being just a little too quiet, YOU KNOW THEY ARE UP TO SOMETHING!".

I'LL GET SOME CHARTS OUT SHOWING YOU WHAT'S GOING ON, IT LOOKS LIKE SECOND VERSE SAME AS THE FIRST, DISTRIBUTION OF ANY STRENGTH.

This doesn't mean I want to enter any particular trade right now as there's a bunch of mud between intraday "steering" divergences (working the bid/ask and tweaking supply/demand) and larger underlying price action which would surprise you considering how flat the market "seems".

Again, I don't enter trades based on what I think will happen, I don't enter them based on the probabilities, I ENTER THEM BASED ON HIGH PROBABILITY/LOW RISK SET-UPS.

In that sense, patience is probably still the best take for the moment, however I will say there are quite a few signs/signals that this is a market unravelling fast,  this is why I refuse to let go of position/core shorts even when I know there's going to be a bounce, I keep my core positions in line with the resolution of highest probabilities and in the end, they'll be fine. Until then, I'd still urge patience and waiting for the right trade set up , the one you can't ignore, not just something to keep you busy or because you are afraid you might miss a move. MISS a MOVE! I guarantee it won't cost you anything other than opportunity.  It won't kill you, but getting run over on a trade because of bad timing, even when you were right, is something that take s a lot to recover from.

If you lose 50% on a position, it takes a 100% gain just to get back to break even. PATIENCE.


Trade Idea-Set up (Long Term) KOL

There's a little reading you might want to do on coal and its rend and a very recent change to that trend, you can find that article here

The very recent change in the trend is not yet a new trend, but as we say, "Changes in character lead to changes in trends".

This is US Coal Imports, note the uptick to the far right.

This is just a small part of KOL as it is an ETF that covers the Market Vectors GLOBAL Coal Index which includes not only coal, but assets of the ETF cover production, mining, cookeries, storage and trade and again it is GLOBAL.

As for the charts, this looks to be an interesting long term long position that's late in a stage 1 base and close to stage 2 mark-up with a significant base.
 The 3-day chart of KOL since 2009 is a great example of the 4 trends in a stock's cycle, these tend to be fractal so you can see this same cycle play out on something like a bounce from the current/recent market base to intraday trade, you just have to align you trading/investing style with the timeframe, but it's a great map to know where you are so you have a better idea of where you are going.

2009 market lows sees stage 1 base/accumulation followed by stage 2 Mark-Up/Rally, a clear Stage 3 Top/Distribution and stage 4 Decline before starting all over again. It appears we are at a large stage 1 base right now.

Here are some traditional indicators used in slightly non-traditional ways...

 3-day chart of KOL using a standard Wilders RSI period 14 which is about as high as I want to go, I often use period 6.

Below is a MACD Histogram, but to uncover the trend and isolate the noise I tend to use longer settings of 26/52/9 which shows a positive divegrence at what I suspect is a large base, just as RSI also shows.

At the bottom I use Stochastics for divergences, not overbought/oversold and I use a long period of either 50 or 100, this is 100 and it too shows a positive divergence at the base area.

 The long term 3C chart of 3 days shows 2009 accumulation, some lighter 2010 distribution and very heavy 2011 distribution in to a H&S top followed by a large positive divegrence in the area I suspect is a large base.

That seems to be a bullish strategic view of KOL over the long term which are few and far in between in the current market environment. On a more tactical level...

This is the daily chart, it recently broke out of a range and on volume with quite a bit of volatility.

The 4 hour 3C chart which is a very long term/strong timeframe supports recent 2014 strengthening positive divergences  so if I was looking for a longer term long play that had some staying power (perhaps a year or two, maybe more on the upside), I'd consider KOL.

The 60 min chart shows a positive divegrence just before the breakout from the range so all in all this is looking more and more like it is reaching the end of stage 1.

 As for a tactical entry, KOL is a bit choppy intraday which makes it difficult to analyze on very short term charts, but it looks like this 10 min chart is suggesting a pullback which is where I'd want to enter KOL long.

The 5 min chart which was confirming the price trend has also gone recently negative, again suggesting a pullback. All of the longer term charts would put the probabilities of a pullback being a useful and constructive entry very high.

 On a daily chart I like candlesticks for reversal areas, especially on increasing volume over the previous day such as the bullish hammer to the left and what looks to be a more bearish star today. Taken with the 6/10 min charts, I'd expect a pullback and probably a decent entry in KOL very soon.

This 3-day version of my Trend Channel has held almost all of the trend (even though there has been very little trend other than lateral) for almost all of 2014 so I'd trust it as an initial stop in the $18.60 area on a closing basis, I prefer a 3-day chart's close, but that determination can be made at the time.

I'd also look to the trend channel if/when KOL breaks out to stage 2 Mark-Up or the uptrend, I'd use the appropriate timeframe for the channel and just let this one trend and not try to trade around it much.


Yields Don't Trust this Move

This morning I showed how the "narrative" wasn't exactly making sense  with what we were seeing on charts, for example the 5, 10 and 30 year treasury futures being accumulated from the European open until 5:30 a.m. when they started to move higher, but only really got attention on the move from the missed retail sales report this morning, the fact is, they were moving higher well before the retail sales miss and being accumulated at least 5 hours before it came out.

Now take a look at the 10 year yield (red) vs. the SPY (green) intraday as it sits at 2.409%
It seems there's a flight to safety trade at the same time there's a risk on move in equities.


Market Update

I think the post from Monday about patience may have been the right post at the right time.

We just came out of the best looking base since July 1st, the two previous bounce attempts since July 1st have shown a huge change in character which leads to changes in trend. Specifically bounces use to move up for several days before distribution would start, the previous two bounce attempts saw immediate distribution the first day, the first hour of their bounces.

I suspected because of the size of the base and the decent divegrence on 10/15 min and even a 60 min chart, that this bounce "may" be different, but I was definitely very interested to see.

While it's way too early to say definitively, there's certainly some price/underlying trade action that suggests , "Maybe this is no different than the last two bounce attempts". Maybe Wall St. isn't using bounces for the same reason they did prior to July 1st which was usually to set up some head fake / bull trap. Perhaps they are doing the same thing as the last two attempts and selling any and all price strength in which case there's very little reason for me to consider a bounce long, but rather focus on position shorts.

In any case I'm going to be putting together a post that is going to take me a little bit of time, it's an asset that I think may be one of the few longer term long positions that may hold up in a bear market decline so before I do that I wanted to get an update out.

Because it take so long to capture and post these charts, some of the faster 1 min charts may look a little different now, in that case I'll try to give you the closest update verbally if there's a difference.

NASDAQ 100 Futures / NQ 1 min intraday gone negative, they still are, but not tracking lower, but to the side.

 ES/SPX Futures intraday have gone leading negative as well, also tracking a bit more laterally and slightly with price, but overall in a negative position.

SPY 1 min leading negative has a slight improvement from this leading negative divegrence which seems to have hung up price in the area, still leading negative

 SPY 3 min chart is in line, this was the migration and the charts looking better and closer to the 5 min chart at which time a long trade is safer.

The SPY 5 min chart shows the fix it needs to be in line or positive, rather it continues to show what looks like the same type of selling at any price strength as we saw during the last 2 bounces.


 This is the 10 min SPY base/positive divegrence which should support a strong bounce, I haven't given up on the idea, but today's action seems to look a lot like the last two bounces that didn't get far as every bit of price strength was sold in to.

 QQQ 1 min looks pretty much the same.

 It's the 3 min chart showing distribution in to today's move. It seems to me that the intraday 1 min steering charts are being held in place (like a market maker/specialist working the bid/ask to keep price from collapsing while selling in to the price strength.


 This 5 min QQQ leading negative today surprised me, this is still in place and just tends to back up what was said above.

A closer look at the 5 min chart today which "should" be in line with price this early in a move out of the base area.

QQQ 10 min base - Now I'll have to be paying extra close attention to see if there's any deterioration here, if so, I'd be focussing on position shorts sooner than later.

 IWM intraday saw a positive yesterday gapping it up and in to higher prices it has stalled.

 There's some improvement on this 2 min chart, again as if there's something like a market maker/specialist working the bid / ask to maintain prices near a sell level like VWAP which we will see as well.

The IWM's base which is a very sturdy base, I'm still on the fence as to whether this can move like it should or if its fate will be the same as the last two bounces which would indicate a greater urgency on the part of sellers rather than waiting for higher prices, they just want out.

 TICK has lost any sense of trend intraday which is in line with price action.


My custom TICK showing buying late yesterday and selling in to today's highs.

What I'm still looking at is whether there's an attempt to repair or get the 3 and 5 min charts in line for a strong move worth trading long or whether this is the same story as the past 2 bounce attempts.

 Looking at the base area, you can see TICK improving in to this week's initial move higher, but it seems to be deteriorating in to today.

And the top channel of ES's daily VWAP which would be the ideal area to sell/fill orders.

More as it becomes available, but I think "patience" was and is a good idea, there's just not a strong trade on the table here worth the risk.