Thursday, February 20, 2014

Daily Wrap

This morning, based on the charts we had available at the time, I posted "Scenario"  at 10:36 a.m. this morning.

The gist of the analysis was as follows (excerpt from the linked post above)...

"This is a possible scenario I've come up with for today's intraday trade based on the charts we have now. I started considering this based on the USD/JPY overnight action... why save it for now? Here's a scenario...

First let me show you the QQQ, we have been watching this deteriorate and it's in unrecoverable position, but this is what we expected from a head fake move as well so it shouldn't be a surprise....
I want to let you know because it allows you to consider how you might want to use it to your advantage, I'll tell you at the end how I'd be looking to use it....


 As far as all the intraday chart like 1 min they were negative and in line, this is at reversion. From here on an intraday basis, the Q's could make a lateral price move (with the broad market) that allows enough intraday accumulation for a intraday pop higher from here. I think the minutes sealed the fate of this last trend so it's not anything I'm concerned about, but it may be something I can use."

The thing I was wrong about was the lateral intraday price move that allows accumulation for a short term move. The easiest way to think about this concept is a lateral base is like putting gas in your car, the larger the base, the further it can take you (even though we are talking about a very small base/move). Instead what we got was...

This is the 2 min QQQ today, you can see there's a VERY small positive divegrence around 10 a.m., but there's no lateral trend which would allow the Q's to build a little strength, again it's like putting gas in the tank if you don't have a substantial base, it's very difficult to support any upside move, we did not get the lateral move today. In to the upside move expected AFTER a lateral base to build a little strength (even to support a very short move of a few hours to a day or so) we see intraday distribution.

Back to the a.m. expectations...

"With the SPX so close to resistance, a pop above will change retail's sentiment to bullish as it is a breakout above resistance, many of them will buy it and that creates the trap as you can see above, the destruction in the charts is complete, however intraday, that makes sense especially looking at the QQQ price trend I drew above."

Although we got a move to the upside, we didn't quite get the SPX move suggested...
 This is the resistance zone I was talking about this morning, we didn't get a break of it and if we did, we have no base to support much here, thus the initial expectation of such a move creating a small, but effective bull trap would be even more effective.

On a 60 min chart though we do have a wider topping process, this is similar to the base mentioned above, the larger the base, the further it can move the market; however it's a bit different with a downside move, markets fall of their own weight, they don't need the same lateral move, but they often do have a wider top reversal compared to the narrower bottom reversal pattern as you see.

The clear change in the market is HUGE volatility, you may recall as we transition from stage 2 mark-up to a stage 3 top, price sees an increased Rate of Change, it looks bullish at first, but it's a red flag that we are transitioning to a stage 3 top. As always, changes in character lead to changes in trend. The point here in a primary trend, the increased volatility on this scale is a major change in character which precedes changes in market trends.

Back to this morning's "Scenario" post....
"USD/JPY 1 min is already negative and we are already seeing some downside volatility, but this divergennce should be bigger to really break the Carry trade, to do that it needs the Yen to develop a bigger positive divegrence and the $USD to develop a bigger negative divegrence, that all is just a matter of time, that's it."

Here's what we have in the USD/JPY , the Yen and the $USD... the key influential element for the market this week ($102)...
 This is the intraday 1 min USD/JPY, the divergence is deteriorating here, but beyond that, what the Yen and $USD do is more important, this comes back to the concept of how much gas you have in the tank.

The intraday Yen not only subsided in its downside, but did exactly as we predicted this morning in making a lateral move and allowing accumulation. This move is not the primary trend in the USD/JPY in which the carry trade is close to entering a primary bear market as the carry trade is closed, it is a shorter term divergence to get the primary trend jump started again and to break $102 on the downside in USD/JPY specifically which for now is a market negative.

The longer 5 min $USDX saw a deep leading negative divegrence in to the afternoon.

This is the primary trend in the Yen and thus USD/JPY and Market...
4 Hour Yen positive leading divergence which largely formed near the start of 2014 (green arrow). 
To understand what is going on here you have to understand a Carry trade, institutions use Carry trades to increase their AUM (Assets Under Management), it's a kind of leverage, the trade moving up makes them money, but it also allows them to leverage their portfolio size.

When a carry trade is opened (in this case) the Yen is sold and the $USD is bought, as long as the trade moves up, there's much danger, but when it starts moving down, the 100:1 leverage that is common to these kinds of trades can literally destroy a company.

Note the uptrend and more so the positive leading divergence in the Yen, this is a reflection of the carry trade being closed, the last thing that needs to be done to close a carry trade is to buy back the Yen, thus the upside move in the Yen this year and the accumulation in 3C.

Why close the carry trade?

This is the USD/JPY carry pair, since the start of 2014 (we noticed a change in character late December) is now trending down, each pip down (typically 100 pips in a $1 move) costs a 100 pips in losses, so the carry trade is being closed. One other thing that is done to close the carry trade is to sell the asset that was financed by it, if you look at the decline in market breadth you can see how this is true. 

We have lower highs and lower lows since the start of 2014, a downtrend and right now a bear flag/consolidation. It's possible there's a head fake move on the flag, although it's largely pros trading FX in size, not as much retail like equities, it has long been known that currencies trend better than stocks.

The bottom line vs this morning's expectations is that we got exactly what we were looking for, the Yen to stop its downside move and to move lateral and the USD to see distribution.

If you are newer to trading or got involved after 2009-2010, then the correlation you are use to is $USD up / Market up; THIS IS NOT THE RULE, IT IS THE EXCEPTION. SOON THE $USD CORRELATION IS GOING TO FLIP BACK TO THE HISTORICAL NORM, "THE LEGACY ARBITRAGE CORRELATION".

Because of the "Bernanke Put" via QE, institutional funds felt safe to open carry trades and leverage up their portfolios, however the correlation of $USD/JPY (or $USD up) and market up is not normal, the historical correlation is $USD strength and stock , precious metal, oil/energy weakness, the opposite of what we see now, the reason we see it now is because of the carry trade, but historically they are not that common, they only have been because of the Bernanke put. THE CORRELATION WILL FLIP AT SOME POINT AND $USD STRENGTH WILL CAUSE MARKET WEAKNESS.

One of the effects of QE/printing more money or increasing the money supply is a weaker $USD, as QE is phased out, the $USD will gain in value as it is no longer being diluted, that will send the market lower and by that time the carry trades should be completely closed and we'll return to the historical $USD correlation (opposite the market).

Back to this morning's post...

"While all of this is building, the market is not usually going to just sit in one place so why not hit buy limits just above on the SPX in the mean time, it only helps as a head fake with downside momentum once the USD/JPY is ready to break down.

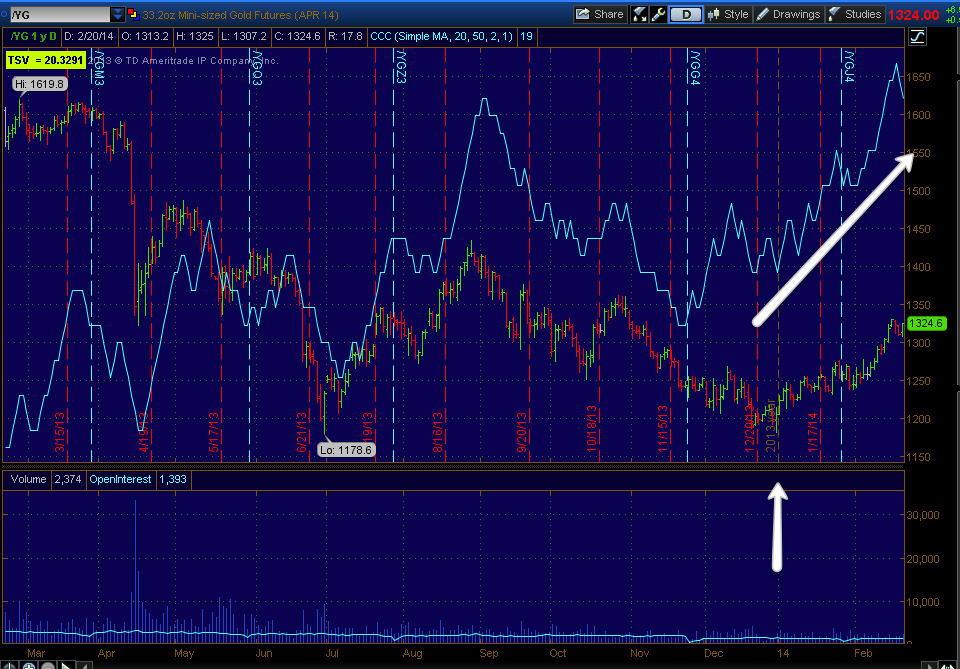
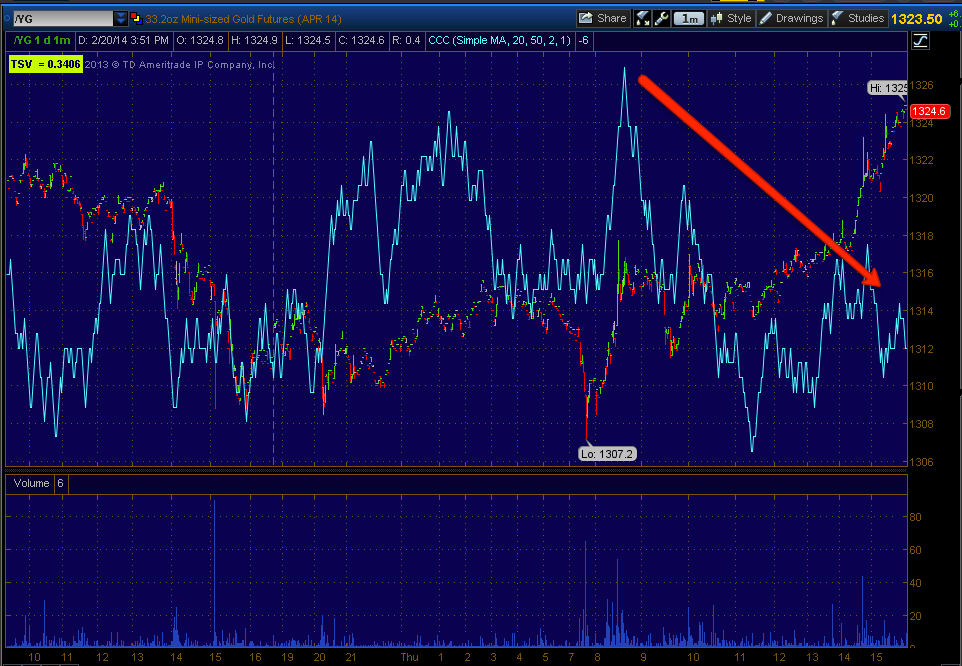
The way I'd use this is in assets like GLD I mentioned yesterday, I wanted to short them in to strength, if the SPX does what I am proposing, that strength in price in GLD should appear allowing me to enter the position that I refused to chase lower yesterday.

There are plenty of other assets tat the same concept can be applied to."


Although we didn't get the SPX move through local resistance, we did get enough of a move to move assets like Gold.

I closed the AAPL March $535 puts for a +24% gain  because I think it has some upside, whether it's part of tomorrow's Option Expiration Max Pain Pin or just a bounce in AAPL, there was no reason to hold it when I can take the gains, wait for the move to end and re-enter the trade and make another gain on an AAPL put.

Here's how AAPL ended the day, it looks a lot more like what I had expected from the market today in creating a small lateral base...
 AAPL 30 min chart with large distribution and then the accumulation that was around the same time as the head fake accumulation in the market creating the last move to the upside. The overall divergence is still leading negative so AAPL still has downside in the bigger picture, I do like other assets better though as discussed earlier.

3 min intraday, the distribution is obvious, it's on a much larger scale, but we did get a positive divergence today in AAPL, thus closing the puts and preserving the gains was the most reasonable course of action.

Note the lateral trend in price (green arrow), this is what I expected in the market, but we didn't get that, this means the market doesn't have much support at all right now even for a very short term move.

 AAPL 5 min intraday, it's not just the divergence, but the lateral trend/base. This will allow AAPL to make an upside move with some support, the size of the base and the following move are proportional, a 1 day base isn't going to create a 2 week rally.


AAPL 10 min with accumulation at the same time as the market in to the head fake move, AAPL has moved up like the market off that accumulation which was about 6 days of accumulation for AAPL, the leading negative divergence is significantly bigger, but this is what we expected to see as was posted before any upside move even began. The current positive is seen to the far right, when this fails after a small move up I'll look at another AAPL put or maybe short position although there are other assets I like more for a longer term short.

Note that despite having evidence of a bounce in AAPL, I did not enter a long/call position, this is because the probabilities for AAPL and the market are skewed severely to the downside and when a market is getting volatile like this at a trend pivot, I DO WANT TO TRADE WITH THE PROBABILITIES, NOT AGAINST THEM. So my plan for AAPL would be to set some upside price alerts and look for the next short entry, there may be other assets that look better at the time, but AAPL is on the watchlist for another trade similar to the one closed today.

Tomorrow is an option expiration Friday which means the market typically opens around today's close and usually stays pretty close to that range for the Max Pain Pin, around 2 p.m. most contracts are closed and the market will do what it will do the last 2 hours, we usually get very good signals those last 2 hours, they allowed us to predict the range starting the next trading day (over the weekend) on Jan 27th, they allowed us to predict the head fake move and ultimately the last run to the upside so we'll be checking that out carefully.

FB was brought to my attention, not their acquisition of WhatsAPP, but the fact that it's VWAP closed today almost exactly where it closed yesterday, often large institutional orders are filled at a consistent area and VWAP is used to rate the performance of the market maker or specialist in this case who filled the order, it's a sign of institutional money exiting the asset. Buy the rumor sell the news? Perhaps. FB has a daily divergence on par with the market, but that's not what's interesting.


 Daily 3C chart, you may remember when FB was the most hated stock, we were among the first to go long at accumulation to the left, actually at the low of the trend and did very well. Currently there's a much larger negative divergence, part of this is broad market based.

As far as the specific move on the acquisition, here's what we have...

FB intraday, so it looks very possible, we'll see if we get migration to longer charts, if so, FB would make a nice long term trend short.

I'll check futures later tonight, right now there are 1 min negatives in NQ, TF and especially ES right now.

ES after market leading negative divergence, NQ and TF are similar, but these are only 1 min intraday, I will check them later tonight.


GLD Update

As far as this mornings USD/JPY and SPX expectations, we're pretty much on track.

As far as GLD, yesterday I was very interested in GLD short  with 2x leverage, DZZ long, but I refuse to chase anything and wouldn't even consider a partial entry, that's because Technical Analysis is used against us so often it's predictable. My plan yesterday was to wait for GLD to bounce and short in to that, if I missed the trade, so be it, but to take on a sub-par entry with increased risk is just what I said I was feeling about the position yesterday, GREED and that's an emotion and the last thing I want to do is make emotional trades rather than objective based trades.

GLD should move with the SPX as it has on this entire run, we'll see what happens to the correlation after, but for now, if you know what the SPX is likely yo do, you have a good idea of the directionality of GLD.

The charts as GLD did start to make that move I was hoping for yesterday.

 As pointed out yesterday, GLD looks like a great long term trend trade (long), but it needs to pullback first, the pullback is the trade I'm looking for, when we get to the bottom we can look at GLD as a long term trend trade.

Remember the gap and bearish candlesticks in GLD in this area? Then yesterday some downside, this is the downside that I refuse to chase and today is a perfect example as to why. This is the kind of move I was hoping to see, it just took a little patience and maybe a little more.

 This is an ugly chart, but still shorter term as far as the type of trade, it's not so short in duration that I think options are needed, but I'd like to have at least 2-3x leverage and since the only leveraged short ETF/ETN with any kind of volume is DZZ, that's the asset I'm looking to go long at the right moment (2x leverage short GLD).

 When this 2 min intraday chart goes negative (it's nearly perfectly in line-intraday), that''s the cue to enter DZZ long.

I also looked at Gold Futures to confirm what I was seeing in GLD the ETF...

The daily chart of gold futures has a huge leading positive divegrence so once again, as a long term trend trade I'd like to go long GLD without any leverage, but first it needs a pullback and that's the move I'm looking to trade using DZZ.

The 30 min chart in gold futures suggests gold futures/GLD will pullback, that makes the DZZ trade work and that helps get us to a more reasonable area for a long term trend trade in GLD.

Intraday 1 min gold futures are seeing some distribution in to the move up which is somewhat parabolic, the fact they seem to be distributing in to any sharp move up immediately suggests the DZZ long position should be available very soon, I'd think tomorrow if it weren't an options expiration Friday in which they'll look to pin the market.

This is why there are certain concepts like NOT chasing prices, but letting them come to you. This is the opposite of a century of Technical Analysis teachings, but those are so consistent that they are predictable, I can predict them, Wall St. is even better especially as they have the full book available to them and know where any and every order that has been put in rests.


Leading Indicators

Leading Indicators are in line with the market's overall cycle / pivot weakness, we saw some of the initial downside from it yesterday, today we have a little noise, but Leading Indicators are indicating this is what we've been expecting.


 Today we see HYG (High Yield Corporate Credit) which is often used for short term market support/manipulation falling off vs the SPX (green)

The 3C chart of HYG shows distribution which makes perfect sense

This is the longer 10 min HYG chart leading negative as well, the market has a very hard time moving up without HYG support as there's very little organic demand.   In other words, "When smoke and mirrors fail, the market has a difficult time holding its ground and smoke and mirrors are failing".

 This is High Yield Credit, it too is falling off with the SPX, this is important because as the motto goes, "Credit leads, stocks follow".

As far as professional sentiment, the first of our two indicators is showing sentiment falling off vs the SPX.

Our second Sentiment Indicator is clearly falling off, in fact moving nearly straight down vs. the SPX, these are good Leading Sentiment indicators. In other words, pros are moving out.

 VXX/ VIX short term futures (vs SPX with price inverted so you can see the correlation) shows protection being bid, we also have a nice rounding bottom in VXX or reversal process, even though it only pulled back a little bit.

 VXX intraday 3C charts showing accumulation in to the reversal process.

This is migration to longer timeframes in VXX.

 This is the longer term base in VXX 15 min with a huge leading positive divegrence, you can see it recently started to run up and a small pullback today that seems to be building it's short term reversal process.

 Here's TLT, 20+ year Treasuries, we see underperformance and right now as the day proceeeds, outperformance vs inverted SPX prices.

This is a flight to safety trade.

The intraday TLT chart with accumulation, which also looks like a move out of risk assets and in to safety.

Another TLT chart (longer intraday) that shows the negative sending it lower and now a positive in an increased ROC toward the lateral.

Yields intraday had a positive divegrence late yesterday so today's prices make sense, but now it's starting to fail, this is short term only. Longer term...

You can see how Yields in red have led the SPX days in advance in calling trend changes, we have a SIGNIFICANT leading dislocation . Think of Yields this way, they are  like a magnet for equity prices, that would mean they are pressuring the market on the downside as the pivot area progresses.

 This is the 1 min USD/JPY (candlesticks) vs ES ([purple) 1 min, you can see the correlation which drove Index futures lower last night, before reversing around the European open.

However, now that the correlation is reconnecting, we have a longer term disclocation that should revert to the mean.

Here it is, 60 min USD/JPY vs ES, I figure there's somewhere around 60-80 points in ES that need to be wrung out just to revert to where USD/JPY is right now, assuming it didn't move any lower which I think is inevitable.

There goes GLD

This was the move I was hoping for yesterday as I didn't want to chase GLD lower for a short  which was a good idea considering today, however this may open the opportunity I was looking for yesterday which may be GLD Puts for a shorter term or swing trade or perhaps the DZZ (2x leveraged Short GLD ETN long).

I'm just finishing up with Leading Indicators, I'll have a GLD/ GDX update right after.

Carry Trade Update

As was proposed earlier today, the USD/JPY suspicions remain on track, take a look...
 The 3C intraday USD/JPY is seeing a continued negative divegrence, at this point it has moved to a stronger leading negative and pretty intensely.

The Yen and $USD should confirm...
 Here the Yen is confirming with a larger positive divgerence. What I said I was looking for earlier today was the Yen downside to subside and a lateral trend to establish in which a positive divegrence would build, that has been the case all day and as you see we are not totally lateral in the Yen, confirmation.

The $USD is seeing a larger negative divegrence which is what we would want to see.

As far as the SPY Custom TICK Indicator, we see the intraday market breadth is weakening here.
Note breadth deteriorating as the USD/JPY also deteriorates in 3C underlying trade.

I still think an SPX breakout of local resistance has a decent probability, maybe 65%-70%, this is based more on market behavior and keeping retail confused and locked in to bull traps, it's not as much based on underlying trade, but I wouldn't expect anything very serious, it's not that far to go and there should be a lot of limits and maybe a few stops, that's easy money for Wall St., even if you only consider the Bid/ask spread on a spike in volume. It's so close, I wouldn't let it go if I were running the criminal syndicate, however it has no importance other than using it to your advantage as laid out earlier today.

The main point is the expectations of deterioration in the USD/JPY are no longer theoretical, they are real.

China's Aggressive Stance Tells Us a Lot About Their Economy...

It seems once again today at the regularly scheduled PBoC Open Market Operations (Tuesday and Thursday), the PBoC drained liquidity from the system for the second time this week after an 8 month hiatus to prop up trusts and banks with liquidity that were on the verge of failure. Today (Thursday) the PBoC used Repos again for the second time this week, again this is after an 8 month hiatus . China still faces soured loans rising and possible trust failures, but they seem to be fine tuning monetary supply.

The main point though is one longer term members are familiar with, the Chinese provocation regarding the disputed ownership of the Senkaku Islands that Japan bought. The correlation we have noticed is China's saber rattling every time they see negative economic numbers.

Just yesterday the Chinese HSBC Flash PMI readings declined from 49.5 (last) which was also consensus to a drop to 48.5, anything under 50 represents contraction.

Worse than just the headline number was the deterioration in the Flash PMI sub indices. 

The following indexes in the Flash PMI not only deteriorated, but changed direction from positive to negative:

Output, New Orders, Backlogs, Output Prices, Stocks of Purchases, Finished Goods and Quantity of Purchases.

Among those that worsened at a faster pace: Output PPrices and most importantly the Employment Sub-Index which fell to February 2009 levels.

I was sent this article today which is about the Chinese saber rattling in preparing for a quick strike against Japan, apparently an amphibious assault which seems to make clear that this was about the Senkaku Islands.

Being that China is facing multiple problems in which the solution to one exacerbates the other (such as providing liquidity to support banks with increasing bad loans or trusts in risk of failing, but needing to withdraw liquidity at the same time as the housing market is a bubble and inflation in various sectors, most notably housing and food is getting out of control).

My response to the email and article was as follows, I believe it tells us a lot about the state of the Chinese economy and thus the world economy. All of the observations made in this response are ones we have seen over and over when it comes to Chinese economic troubles mounting, it's so predictable that we get stories like the linked one above right after the very disappointing HSBC Flash PMI reading.

My response to the article...

"I think this is about more than economics, well not really, but you know what I've thought about this in the past. You know who the Chinese government is terrified of? Their own citizens, whenever you get a country that's going through economic pains and the population starts looking at the leadership with the hairy eyeball, the governments always do the same thing, they focus the populations' view on an external threat and stoke nationalism, take Nazi Germany for example before the war started.

This tells us quite a few things, one of which is Chinese officials know how bad their economy is. They are also known for making long term economic decisions unlike the F_E_D, but that is also a lot of time for the population to suffer through, I think that's what we are seeing, an attempt to stoke nationalism."


As you know, for a while I've been hoping for a counter trend rally in FXI (china 25) to open a long term / trend short in FXP long (inverse/short China 25). I'll take a closer look at these and see if there's any opportunity, but I do like this as a core short as it diversifies positions  and I think China is at a pivot from external export driven economy to trying to move to a consumption driven economy, it could be a painful process, but Chinese seem to always think in very long terms, I'm not so sure the Chinese population will feel the same, thus the stoking of nationalism over the disputed islands. Last time this happened (sometime within the last year) it worked as Chinese citizens desecrated and vandalized  Japanese assets such as Toyota dealerships in China.

For several months I've been looking for a counter trend bounce in FXI to allow a better entry and lower risk in opening a short position via FXP below...

Ultimately, long term I want to be long FXP (SHORT the Chine 25).

I'll be taking a closer look at these and seeing if this may be an area worth investigating as I believe China has multiple problems that are beyond their long term transition from an export to a consumer led economy such as inflation, bad loans threatening banks and trusts.


AAPL Follow Up

I had a good question from a member about AAPL. Yesterday I was talking about AAPL and said I didn't see it as having as much profit potential as a short as some of the other assets like BIDU because AAPL has already discounted quite a bit of downside (-45% drop if you recall from the highs).

The member was wondering why I chose AAPL as a trade over some of these other assets. When I was talking about AAPL's profit potential I was talking about it in the context of a core short position or a longer term trend position, but the trade was using options so it was obviously meant to be a short term trade. At the time, AAPL looked better than say a BIDU for this kind of trade.

This is an excellent question because it deals with the concept of multiple trends all existing at once and THE IMPORTANCE OF MATCHING YOUR TRADES AND THEIR MANAGEMENT TO THE TIMEFRAME YOU ARE TRADING.

For example, as for the Option / Put trade that I just closed in AAPL...
 The 10 min AAPL chart above has a VERY clear negative divegrence and a very strong one as well, there are multiple timeframes, but this is good enough for the example.

This is a clean, near term short set up, because I didn't see it as a long term trend trade I used options as a tool to increase the profit potential, rather than 2.75% profit (AAPL short), it turned out to be a +24% profit.

Now look at the same chart in BIDU...
 The BIDU 10 min chart does not have the same, clean, clear negative divegrence for a short term options trade.

However when we consider longer term trend trades which I want to be setting up and finishing up now, take a look at the two assets again...
 AAPL's 30 min chart is negative, but if you had to chose, would you choose AAPL or...

The VERY clear longer term leading negative on the BIDU 30 min chart?

It's important to match your trades and the types of trades with the signals and timeframes you are trading, BIDU is a much better looking trend short,  but for a very near term, quick trade, AAPL clearly had the edge.

As far as why I decided to take the AAPL gains off the table in the March $535 puts... I could hold the puts through March and probably have a larger gain when all is said and done, but why go through possible draw down when I can just take the gains (not lose any) and then re-enter the same position when it's ready to make a new leg lower? It's a matter of losing the recent profits because of theta at bear minimum.

The 10 min chart shows a VERY clear negative divegrence so it was a good choice for the particular trade, an options position.

 However looking at a 5 min chart to the far right, we see a small positive divegrence forming, I'd think that AAPL is very likely to move sideways for a bit here and probably pop to the upside as I mentioned this morning, but even if it just moves sideways, my AAPL gains will disappear just as a matter of time decay.

The 2 min intraday chart has a relative positive divergence as you can see between 12 pm yesterday and right now, there's was no point in putting those gains at risk when I can simply re-enter the trade after this section has resolved and make the gains a second time.