Tuesday, July 3, 2012

BPZ Update

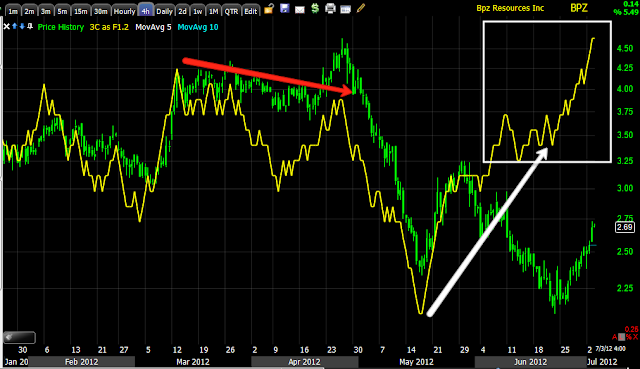
BPZ was a long idea from June 18th.,  subsequent updates on June 22 and #2

 Here's the original trade idea the day after what looked like mini-capitulation. With the downtrend and the bearish continuation triangle, in retrospect, I should have waited for the bear trap to set up and buy in to that weakness.

Since we didn't have an uptrend to work with until the June 22nd update, we used the hourly Trend Channel which has held the entire move thus far, the trade is up about 14% right now.

The current charts...
 BPX is starting to look like it has the potential to be a longer term trending trade as this is one of the few stocks out there with a positive divergence on a daily chart, or the primary trend.

 The 4 hour chart from distribution to a leading positive divergence (accumulation).

 The 60 min leading positive would be more than impressive, but with the 4 hour and daily, BPX looks to be something special in this market.

 The 30 min chart offers more detail as it should, it is also leading positive.

 As for a pullback, the 3 min went from a relative negative divergence to a slight leading negative today.

 The negative divergence stretches out to the 15 min chart, which is basically in line with the market averages. I have mentioned many times how the market is the primary driving force behind any given stock on any given day, but over the last several months we have seen an extraordinary amount of correlation, stock pickers can still do their thing, but the amount of market correlation makes stock picking somewhat futile at the moment, it's only stock like this that stand out on a daily chart that are really standing out from the strong correlation in the market.

 I would look for a pullback somewhere around the $2.50-$2.55 level, which means our 60 min stop will have to be adjusted to a wider daily stop, which would have been necessary any way for a longer term trending trade.


Here the 60 min x-over chart to avoid false crossovers gave a recent signal and remains in line as a long trade. We may have to move this out to a daily chart as well soon.

I would definitely keep this one on your radar for a pullback.


Risk Assets, Credit, Commodities, Yields, Currencies, etc.

 Commodities vs the SPX, gold and oil were obvious out-performers today, but nearly across the board and as you'll see in Basic Materials in the sector rotation map, commodities as a whole did well despite their losing the FX correlation.

 Most commodities are effected by the $USD in an inverse manner, since it's more difficult to see inverse divergences I use the Euro as a proxy as it makes up 50% of the US Dollar Index and is a pretty reliable proxy. Here the Euro is in green, commodities and the Euro should be moving roughly in sync, the last two days the commodities have been stronger than you'd expect considering the $USD. Strangely however, commodities have basically pulled up to a correlation with the Euro's close from last week. Unless something happens in Europe tomorrow to send the Euro higher (the European markets saw a bit of a short squeeze the least 30 mins of trade today), than commodities and the market both seem to be overextended and missing that FX support, but all kinds of correlations can be easily broken during a short squeeze which is nothing short of an emotional panic as we have been updating you over the last month on the record bearishness and in our opinion how these bears were going to be burnt before the market resumes a primary downtrend.

I hope you can now see the logic in my thinking when I decided to keep the core shorts which 5 of 6 are in the green with only 1 at a minor loss of less than 1% (in case of a black swan event) and added leveraged longs when the market was near its lows in anticipation of a short squeeze. As I was saying back then, "There are too many people on one side of the boat and in a zero sum game, Wall Street can't make money allowing that to go on".

Nothing has changed with regard to the sub-intermediate and long term outlook. If all goes according to plan, the shorts are hedged, the longs will make money (actually are all making money except 1) and when the time comes, the longs will be sold at a profit, we may add some shorts or fill out existing positions and prepare for the next primary leg down.


 High Yield Credit is the risk asset in the credit markets, today it was a little out of sync with the market which is fine, especially if we are looking for that pullback to materialize.

 High Yield Corporate Credit was off yesterday, it's back in line today.

 Although Yields made an attempt today, they are still negatively divergence, if the market pulls back and there's some reversion to the mean between the two, we are fine, if the market keeps moving higher with yields continuing to diverge, we'll have a very unstable move up.

 The $AUD was perfect today, no problems there.

 The Euro made an attempt, but still remains divergent.

Sector momentum today saw Energy, Basic Materials and Industrials do very well, Tech came in toward the end of the day, Discretionary fell off and Financials were roughly stable. The flight to safety trades were out as you'd expect-Utilities, Healthcare and Staples.

SPY/IWM

I mentioned earlier in the week the IWM tends to be the leader of risk on moves, we saw that as the IWM shaped up quite a bit yesterday. The most underlying movement today has been in the IWM and SPY...

 If you look at the IWM 1 min price chart you can see where the short squeeze momentum was in effect, as the 1 min started leading negative you can clearly see the loss of momentum in the short squeeze that started yesterday afternoon.

Adding ROC to price makes this even more clear.

IWM 1 min with ROC applied to price.

 This is the migration through the timeframes or the process of distribution, there clearly was selling in to price strength, we can't differentiate between selling and short selling, but there's a possibility there was some short term market maker/HFT short selling if we are to get a pullback Thursday as the US markets are closed for the 4th of July.

 The 3 min in the IWM. It would be interesting to see how this would have played out during a full day, if the negative divergences would have grown worse and if the migration would have continued. I suspect it would have. Thursday's very fast accumulation is still in my mind and I think it can't be separated from this move since. However, I have the gut feel that if the short squeeze were to continue this Thursday, we wouldn't have seen an event and very quick strong accumulation, but rather a process with longer duration (thus a larger institutional long position).

 SPY 1 min leading below yesterday's readings

 SPY 2 min also leading below yesterday's readings.

SPY 3 min leading negative.

Now I'm going to check and see what happened in the risk asset layout.


ES Update

Volume is exceptionally thin and by this time most traders are off to the Hamptons with the machines running things.


ES has a small positive divergence here after seeing a large leading negative divergence, this move looks like fluff.


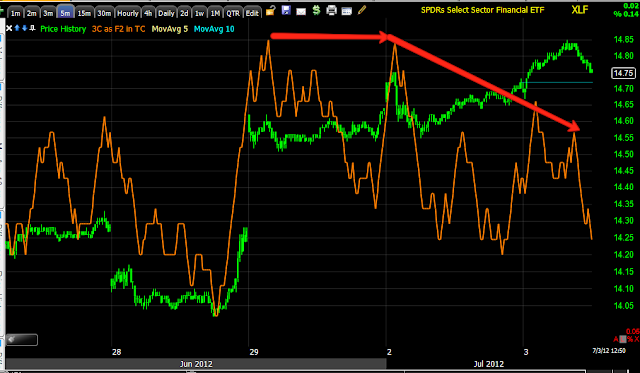
Financials/XLF

 1 min leading neg.

 2 min leading neg.

 3 min now leading neg.

 5 min still suggests a pullback

The 15 min overall looks good for the sub-intermediate trend to continue, but it looks like a pullback first.

Financials Update coming next

To answer several emails at once, there's continued 3C deterioration in Financials.

Charts coming...

USO

I've received several emails about USO, while I don't like USO up here especially where the EUR/USD is relative to USO and with the EIA report due out Thursday (as we have been near capacity for the last several weeks), I feel there's too much event risk in USO which is what it is responding to despite the legacy arbitrage FX correlation.

I also don't like USO long for the reasons stated above, I'd be patient with it because as of now, I see it as a gamble, not a high probability trade backed up by hard charts.

GLD Open

I decided to go with August $160 puts

GLD Spec Position

GLD is not EXACTLY where I'd like to see it,  but it is pretty close. I'll be looking to enter a speculative Put, same as the last 3 as far as the type of trade (short term).

 GLD 1 min'

 2 min

The 3 and 5 min are pretty close to in line and the why I say "GLD is not exactly where I'd like to see it"

However,
 The longer term 15 min has not confirmed, it has had enough time to do so.

The hourly is also still telling me I want to trade GLD on the short side in to price strength.

I'll be looking for a PUT position, likely August $160, I'll let you know for sure, this will be a rather small speculative position.

QQQ out to 3 min

 QQQ 3 min negative leading...

This is why I would not be shorting the market here and rather looking for a pullback entry and holding established longs that were picked up for this move and as a hedge to core shorts.

The QQQ 15 min is looking very good overall, the accumulation event on the 28th can be seen here, it is VERY strong. However we still have that current 15 min ngative signal, this suggests to me nothing more than a pullback in which smart money is likely to accumulate in to, although they already did a lot of accumulation as you can see.

Be patient, let the trade come to you and remember there's a bus every hour.

SPY Migration of the negative divergence

 SPY 1 min deeply leading negative to new lows on the day

 2 min is now leading neg.

3 min as well.

I would not personally short the market as a short squeeze move to even higher highs is what we expect, I'd be looking for a pullback to buy in to weakness for the short squeeze to continue and move to higher highs.

IWM Charts

A Divergence alone is not great information, multiple divergences among the averages and migration through the timeframes from short to long is good confirmation, we are seeing better confirmation suggesting smart money is selling in to the price strength and perhaps even shorting some.

  1 min IWM near new lows on the day, leading negative

 migration to the 2 min as it is negative

And the 3 min....


The IWM is seeing migration of the negative divergence

I'll post the charts next, but what I was looking for on the institutional side seems to be making its way through the timeframes as the 1,2, 3 min are all going negative, in other words it looks like smart money is selling in to this move.

Summary

To answer a bunch of emails in one post, lets go back to the very first sentence of Sunday night's Start of Trade for the new week

"As of late Friday, I expected a bit of a pullback from Friday's gap up, although we are above major resistance in the SPX and were above major resistance in the EUR/USD, both of which could create a short squeeze."


Thursday was VERY unusual activity as we saw an accumulation event, rather than the process, meaning there was strong accumulation very fast, from there the market gapped higher Friday.


What we are seeing right now is the start of the short squeeze we have been looking for for quite a while now.


Most of the action we are seeing has very little to do with underlying institutional trade and has more to do with the strongest emotion in the market, FEAR as shorts are panicking and the snow-ball effect is taking place.


 The IWM since breaking out of yesterday's triangle, that parabolic price action with no pullbacks is a short squeeze, it is probably nowhere near as powerful as it could be so the main institutional activity we want to be on the lookout for today is whether there is selling in to price strength or not, if there is then we may expect Friday to look a lot different than today thus far, but again, this actual squeeze has less to do with institutional money (although it seems by Thursday's action they knew something) and has more to do with the snowball effect of a short squeeze. This is what we have been expecting, the reason we bought longs for the sub-intermediate trend and as a hedge to core shorts and the reason I haven't closed a single long or short for that matter as I expect we'll see the re-emergence of the primary trend after the short squeeze.

What we want to know is where this is going Thursday and that's what I'm on the lookout for. I still don't intend on letting go of the longs bought as hedges as a short squeeze should be much more powerful than this when all is said and done, whether we get some interim trades and good set ups is what we are looking for now and that will depend on signals we get on the institutional side.

IWM since the breakout of the triangle yesterday.


I'll update you on any changes that will offer opportunities or suggest a change, but for now, retail is rolling over itself to cover as the snowball effect and fear take hold.

GLD Trade

I'm going to be looking to enter a GLD put spec. trade at some point soon today. Yesterday I was looking for a breakout move above Friday's highs, we certainly have that, at this point it's just a matter of tactical timing and the short term signal there.

Follow Up


 As mentioned in yesterday's Risk Asset Update, the Euro's failure to confirm and relative $USD strength vs the move in the market is the major concern in this move (IWM daily vs Euro).

 Although the Euro is much weaker than we'd expect to see for a move like this in the market, it is seeing a little intraday strength. (IWM 1 min vs Euro)

Also lets not forget where this move originated, from a clear bullish consolidation triangle and an obvious one at that as that is where the IWM short squeeze started on a breakout from the triangle, this also casts some suspicions on "THIS" move.


 The DIA isn't seeing the same divergence on the 1 min chart that some of the other averages are seeing, it is a relative negative as 3C is not making higher highs with price.

 At the next timeframe the 2 min, there's not much migration here.

 The IWM 1 min is where we see some of the sharpest moves in the 1 min intraday charts.

 Just for perspective, this is the same chart zoomed out to cover the last day and a half.

 Thus far the migration to the 2 min chart is not as sharp. I believe the intraday move in the Euro above is lending some near term support, even though on a longer timeframe, perhaps as of the close today or the open Thursday, I feel this will be a problem.

 The Q's 1 min is similar to the DIA

 there's some migration of the divergence to the 3 min chart, although not horrible.

 The SPY is the other average (the IWM being the first) that is showing deterioration in the 1 min

However it's rather new and has not seen much migration to the 2 min chart as of yet.

There's the chance that the Euro improves and the market gets some more support. Thursday's accumulation event clearly seems like someone knew something in advance, the question is how far does this go. I would NOT be chasing this move, however I do plan on keeping already established longs open.

As of now the TNA long is up 26%, ERX is up 16.5%, FAS is up nearly 7% and 5 of the 6 core shorts are all in the green up to 21.5% with the only core short at a loss being XOM at 0.28%.

This looks like it will be a fast moving market as we approach the close.