Friday, February 17, 2012

Oops, pushed the wrong button...

On options expiration it's hard to judge volume as it is generally high on options expiration, but there was no such event in ES and the trading volume there can be analyzed with surprising results.

In essence, ES didn't move much on the day at .40%, however volume was a standout. Today's ES volume was the lowest volume for a non-holiday trading day in nearly 5+ years!

AAPL looks like nearly the perfect pin,

Calls

 Looking at the calls, had the lows of yesterday around $486 given up another buck or so and closed at $485 an additional 38,396 calls would have expired worthless, but 55,567 put contracts would have been in the money (roughly, you have to calculate transaction costs, etc), but it was clearly in Wall Street's interest to pin AAPL right about where it closed.

Puts

AAPL's close in a very narrow range, an obvious options expiration pin.

AMAT which beat on earnings last night, gapped up big today gave everything back, a loss of -6.8% to close down 1.67% on the day on huge churning volume, talk about a head fake!


The 15 min 3C chart put in a huge leading negative divergence today, one of the biggest 1 day moves I've seen, it even went leading negative all the way out to the 60 min chart which is hard to do in a single day, so there was massive distribution in AMAT today and that after positive earnings and a great start to the day.

WWWW did something similar after good earnings last night,
 WWWW still managed a decent gain, but a horrible close, giving up 6.7% in intraday gains at the close on huge volume, leaving it looking like a big distribution/churning day as well.


3C never moved an inch to confirm the move up, this will likely end as a head fake move as well.

In fact a number of stocks that reported god earnings last night and were up in after market either gave back a substantial part of their gains today like CLD, or just closed down badly after being higher in last night's after hours, BIDU is one example that was up in after hours and closed down nearly -3.5% or even worse (Guidance is what it's all about-not what you did, but what will you do?) CBEY which was up in AH closed down an incredible -12.74% on volume!  I'm sure there were some very unhappy after hours buyers today, but the action is downright strange.

Our natural gas long play was one of the leading ETFs today, UNG up 4.28%

Biotech, GILD was thrashed today, down 14.25% on heavy volume. The industry group as a whole was hit pretty hard technically speaking doing some damage beyond the 2.42% loss.


***Post continued

DD also had a strange day giving up a lot of intraday gains...

DD gave up around 11% in intraday gains to close near the lows and form a ugly shooting star candle (bearish).
LIFE, NVDA, BIIB, LRCX, SPWR, JAZZ, BRCD, and MRVL also had a strangely ugly day.

Don't get me wrong, there were quite a few stocks with impressive gains today, but there were a strange number of stocks sporting early impressive gains that gave them up. Of course everything was strange today, from the fake US bonds to the ECB debt swap, the announcement out of Greece after the European close and on an op-ex day (which the market must pin and therefore is less likely to react) that they are pursuing retroactive CACs


In last night's post, I mentioned Dr. Copper's underperformance, that carried through today


The Copper Index lost 2.65% on heavy volume.

GLD was down a bit, but the gold miners GDX and junior miners GDXJ took a bit more punishment.

While TLT was virtually flat on the day, there was an afternoon move toward a flight to safety with the 3 day weekend.


The price volume relationships were all over the place from skewed positive to skewed negative and skewed much further then the market averages gains or losses would suggest. Furthermore the major averages, although none made big moves, were all over the place with the S&P and DOW up and the NASDAQ and Russell down.

I know op-ex can produce some unusual trade, but skimming through the chart, the trade was notably unusual.

Have a great weekend, I'll have some updates out and hopefully the swing template finished with a couple of great scans built in.


NYSE Volume Decent/ES Volume Not So

On options expiration it's hard to judge volume as it is generally high on options expiration, but there was no such event in ES and the trading volume there can be analyzed with surprising results.

In essence, ES didn't move much on the day at .40%, however volume was a standout. Today's ES volume was the lowest volume for a non-holiday trading day in nearly 5+ years!

AAPL looks like nearly the perfect pin,

Calls

 Looking at the calls, had the lows of yesterday around $486 given up another buck or so and closed at $485 an additional 38,396 calls would have expired worthless, but 55,567 put contracts would have been in the money (roughly, you have to calculate transaction costs, etc), but it was clearly in Wall Street's interest to pin AAPL right about where it closed.

Puts

AAPL's close in a very narrow range, an obvious options expiration pin.

AMAT which beat on earnings last night, gapped up big today gave everything back, a loss of -6.8% to close down 1.67% on the day on huge churning volume, talk about a head fake!


The 15 min 3C chart put in a huge leading negative divergence today, one of the biggest 1 day moves I've seen, it even went leading negative all the way out to the 60 min chart which is hard to do in a single day, so there was massive distribution in AMAT today and that after positive earnings and a great start to the day.

WWWW did something similar after good earnings last night,
 WWWW still managed a decent gain, but a horrible close, giving up 6.7% in intraday gains at the close on huge volume, leaving it looking like a big distribution/churning day as well.


3C never moved an inch to confirm the move up, this will likely end as a head fake move as well.

In fact a number of stocks that reported god earnings last night and were up in after market either gave back a substantial part of their gains today like CLD, or just closed down badly after being higher in last night's after hours, BIDU is one example that was up in after hours and closed down nearly -3.5% or even worse, CBEY which was up in AH closed down an incredible -12.74% on volume!  I'm sure there were some very unhappy after hours buyers today, but the action is downright strange.

Our natural gas long play was one of the leading ETFs today, UNG up 4.28%

Biotech, GILD was thrashed today, down 14.25% on heavy volume.

In last night's post, I mentioned Dr. Copper's underperformance, that carried through today

Pinned

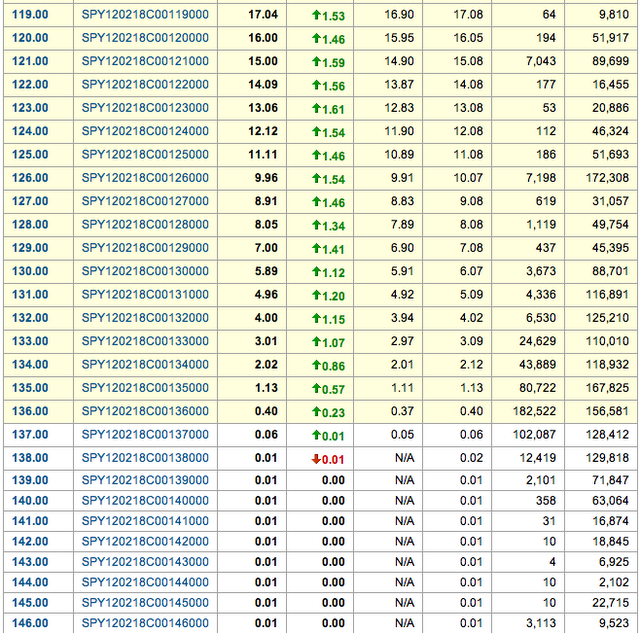
The S&P-500 up .24% , the Dow -30 up .36%, the NASDAQ 100 down .31% and the Russell 2k down .15% generally equals a flat day, not a follow through day after yesterday. As suspected and mentioned several times, "I don't expect the market to do much today and the reason being can be found in the options chain I posted of the SPY...

Calls and open interest

Puts and open interest...

Just take a quick look at the open interest for both. After Wednesday's decline, any further downside carried a cost as the puts had significantly more open interest then the calls, therefore to cause the maximum number of contracts to expire worthless, yesterday's move was necessary, it apparently got the market right where they wanted it for the maximum pain on a market pin.

There wasn't a move in the market today that would have changed the level in which they needed to move it to yesterday to pin the most contracts and those were on the put side.


I said Next Week Would Be Interesting, but this...

One of our member has connections to Greece and there are rumors swirling around that there may be a military coup. I checked the news and there are press reports of fear of coup

While these are rumors for now, lets not forget unemployment among people under 25 ( I believe) is at 50%. The police union released a letter last week threatening IMF Troika members with arrest for trying to destabilize a democracy. The leader-Papademos is an un-elected technocrat from the EU/Goldman Sachs who was put in place as an EU puppet.

I don't want to spread hyperbole, but anything is possible at this point, there's not a lot of historical precedent for a country being stripped of its sovereignty for the first time using finance rather then bullets.

The anti-German and EU rhetoric has been very high with swastikas and the burning of both flags as a regular occurrence.

Whether this has any truth or reality, the likely default next week is enough to make next week a pivotal point and probably the most important week since the EU debt crisis erupted.

Chart Request and Trade -Joy (short)

After what I explained in the DE post, JOY is the perfect follow up because it is doing what I warned DE would do, meaning JOY also looks like a good short sale candidate, but we need to acknowledge and play by the new rules that are meant to use technical analysis against traders. Once you understand how and why, it is a huge advantage for you.

 Again, starting with a weekly chart, we see a nice trend, not too volatile and then a large volatility area typical of a top.

 On a daily chart we see some of the new way Wall Street manipulates trades, for example the head fake/shakeout where JOY makes a new closing high (yellow arrow) and then loses 12% in 4 days only 2 days later. The head fake is there for a reason, traders love buying new highs, when the stock falls, they are trapped and sell at a loss increasing supply and sending prices lower, faster. This is a bull trap. However, as I mentioned DE is likely to see a volatility shakeout, JOY has already started it with a 4+% move today alone. The shorts that got involved on the breakdown are now being tossed from the trade, even though the trade i almost certainly a worthy short, it's still timing and understanding how Wall St. manipulated the trade; their goal is to make as many people wrong as possible, even when you are right.

 Here JOY breaks the Trend Channel, at this point, I consider the back of the trend to be broken, but it doesn't mean this is the best entry to take advantage of a real trend, not yet...

 Money Stream also shows there's a clear problem in this stock, smart money has moved out.

 The same can be seen on the 60 min 3C chart, the October lows saw the largest accumulation and this the strongest move up, the December accumulation was not as strong and the move up was not as strong, but the bigger picture is these moves up have been used to sell/short in to strength.

 The 15 min chart since the October lows with accumulation, by contrast you can see how much shorter the December accumulation period was and the selling in to strength.

 Here's a closer look at the same chart, notice the recent accumulation for the volatility shakeout we are seeing today.


 The 5 min chart is not confirming the move, that' because the move is almost certainly being used to sell/short in to strength.

It's a bit more difficult to say where the target zone is here because the accumulation period for the shakeout was longer, I would guess at least a test of resistance and maybe a head fake high... Watch volume as it moves up and watch for declining volume, smaller candles or smaller daily ATR and a loss of momentum as well as the usual tricks like a head fake breakout. JOY should make for a good short once this shakeout is done. If for no other reason, it's worth watching just to understand how Wall Street operates, you won't find this in TA text books. I'll keep this on a watchlist as well.

DE Trade Set Up (Short)

When looking at a stock, I like to look at the long term first as well as the stock's industry and sub-industry group to see how they compare to the market and how the stock compares to its industry group.

 Here's the weekly chart, DE is obviously turning down from an intermediate up trend

 Here's the daily chart showing an RSI divergence meaning DE was warning it was losing momentum, when momentum is lost, it opens the stock up for a reversal and DE's break came on heavy volume and wide ranging candles, it was a serious break and counter trend vs the market which tells us there's real trouble in DE.

 On a relative basis DE has underperformed the market since October, but even worse since the new year. Relative performance gives you a goo idea of the stocks you want on your watchlist whether you are looking for longs or shorts.

 Here DE is compared to its industry group which behind market direction, has the strongest gravitational pull on the stock all things being equal. The Industry group has also underperformed the market. You can see DE's break with its industry group and it is one of the larger ones in the group.

 The sub-Industry group also has underperformed the market and is reacting more then the Industry group as there are fewer stocks and DE is one of the largest.  You may end up finding other stocks in this group that will suffer as a result of DE.

 Following the recent move up, the Trend Channel has held the move without any breaks, although the close within range indicator has been showing gradual daily deterioration this year in DE.

 On a daily chart, you can see all of the important accumulation/distribution areas and the last accumulation area that was large enough to give DE a solid run from October, there was confirmation at the green arrow, which recently went negative.

 The 60 min chart shows the same with more detail, the lower timeframe charts will always be sharper and leak in to the longer timeframes, but a 60 min and daily divergence is a serious matter.

 As mentioned above, the shorter timeframes will be sharper, like this 15 min which has been leading negative for weeks.

 That weakness flowed in to the next longer timeframe, 30 minutes and distribution occurs in a flat area as it most often does.

 Once the longer charts are sufficiently negative, we look to the short charts again for timing , this is a 5 min chart.

 However, like I have shown you with real charts over and over again, a serious break can no longer reliably be shorted on the first break, three's almost always a volatility shakeout, we've seen these in different assets and the degree of the shakeout usually is correlated with the degree of how serious the break is, think about the Euro bounce after 41.30 was broken or even the move in the market now after nearly a 1 year top was broken, the bigger th break, the more it takes to change sentiment before the next leg down, someone has to hold the bag. This 1 min chart is showing some accumulation after DE broke -7% in 2 days, so expect a volatility shakeout/bounce before entering in any large size, although phasing in to a position is an option. These volatility bounces have been in the market for a long time in the major averages, there called bear market rallies, but in individual stocks, it's rather new and is Wall Street taking advantage of what technical analysis has taught for nearly a century, which is, "short the break down" or buy the breakout. You have to adjust, DE looks like a solid short, but if you are not aware and prepared for a volatility bounce, you'll be stopped out.


I would look for a move to the yellow area before committing in any size. I do prefer phasing in and having a little exposure in case there's a rapid change in the market, you at least have your foot in the door, but risk management planning must come before the entry and you must plan for the bounce.

DE looks like a great short, it's just a matter of patience to get the best entry given the market rules have changed.

USO Update

 USO intraday failure at the open

 RSI shows the loss of momentum and divergence

 The reason USO failed is the Euro didn't support the second run, so the first move should be to revert to the Euro intraday which is happening now.

 The 30 min chart is perfect for a swing move like thi, it's already divergent

 Same thing with the 15 min chart. First the short term charts will show the start of distribution, as it gets stronger they bleed in to the longer charts like the 15/30 min. Then the process kind of starts again whereby the short term chart go negative showing that the middle men whether specialists or HFT start filling their sell/short orders for the decline, I'll explain in more detail in my 3rd installment/post on 3C.

 Here are the short term chart doing that and at the second high which was the test that failed.

 I'd expecct the first target to be a move to revert to wherever the Euro is, currently this is where it is.

On a longer basis, USO is still rick to the FX correlation so the next target is around the red box, also note falling volume in to the bounce.

Longer term daily, USO has a lot of downside to revert toward the FX implied correlation, but it has to start somewhere.