Friday, May 31, 2013

Moody

If you look at the market's price action today, you'll see why I said earlier that as a trader you'd be better off majoring in psychology than economics. Today's market had nothing to do with supply and demand and and a lot to do with emotion, BUT, that wasn't all. In fact it was nearly a perfect storm between ignorance of events and fear of an event that has been at best, unreliable for the last several years.

Now understand, I'm about as bearish as you can get on this market, but we have to look at things as they are, not as we'd have them be and today was a really tough day to look at the market in that light.

The events contributing to today's move that may actually have nothing to do with follow up trade....

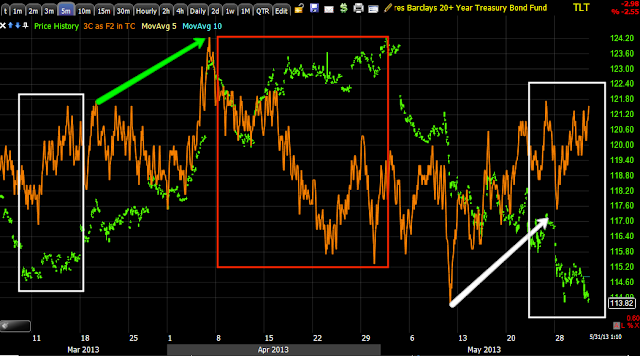
Because this has been the worst month for bonds since 2009, The first issue I'm covering for today was  managers in balanced portfolios. Because of the bonds/Treasuries performance, managers were forced to do a month-end rebalancing 'into' bonds and out of stocks to ensure the weightings remain with their mandates. 

Take a look at TLT near the EOD, actually right around 2:40 p.m., the same time the SPY broke under support

That's the monthly balancing out of stocks and in to bonds so funds don't violate their mandates that are provided within the prospectus.


A big part of today's panic was the apparent spotting of the "Hindenburg Omen" which is...

  1. The daily number of NYSE new 52 week highs and the daily number of new 52 week lows are both greater than or equal to 2.8 percent (this is typically about 84 stocks) of the sum of NYSE issues that advance or decline that day (typically, around 3000).[2] An older version of the indicator used a threshold of 2.5 percent of total issues traded (approximately 80 of 3200 in today's market).
  2. The NYSE index is greater in value than it was 50 trading days ago. Originally, this was expressed as a rising 10 week moving average, but the new rule is more relevant to the daily data used to look at new highs and lows.
  3. The McClellan Oscillator is negative on the same day.
  4. New 52 week highs cannot be more than twice the new 52 week lows (though new 52 week lows may be more than double new highs).

However the rare omen isn't as rare as you might think. There were a cluster of them in 2010 on August 12, 20, 24th, 25th and August 31st those are all the same month, the same year. Then again on December 14th 2010 and the next day, the 15th. There were two on July 23rd and 24th of 2012, then November of 2012 there were several and the last one was April 15th, 2013, however this is not a full list of all of them that have trigged and failed.


The Omen is considered to be very accurate, or at least it was. If you read around the net some people swear by it, others think its antiquated, one thing is for sure, the advent of ETFs have generated a lot of false signals so that was part of the market panic today.

Another factor is that today is the last day of the month, Window Dressing.  So we typically see portfolios tweaked here and there as part of the art of looking smart, window dressing use to be quarterly, now many funds report monthly.

Finally one of the most relevant events today was the MCSI Index rebalancing, in fact here's a warning from earlier about late day action today...

"Trading could become more volatile near the market's close because the MSCI indexes are slated to rebalance at the end of the day. Credit Suisse forecast $19 billion in total trading as a result of the rebalancing, with $15 billion related to developed markets."

I'll be posting some follow up charts later or over the weekend, you know I believe this market is going over a waterfall, but at the same time it doesn't do us any good to pretend something that isn't truly relevant to the market for more than a day, is taken as proof of our convictions that are fact based, in fact it cheapens them.

SPY 15 min chart

This is kind of interesting, we can't cal it a "W" anymore, but ...
I find it VERY interesting the SPY JUST broke support and yet the 15 min chart has barely budged.


NYSE TICK

Talk about volatility, this is another reason I really feel there's a red flag on a complete market breakdown, but I tell you there are a number of stocks that look so bad, I'm starting to think if the "W" base can even fire to the upside, it may very well be a head fake and fail shortly after,

The downtrend looks right, you can see the channel, more and more NYSE stocks are making lows and then it just jumps out of the channel and we have +1000 readings meaning 100 more NYSE stocks are making higher highs, that's not natural.

Volatility is really insane, I've never seen it this bad. I think most traders can't hold a position more than a few hours before being stopped out

MCP -Calls

In fact the MCP calls are down by 16% which isn't that bad for options. I believe I'm going to add to them here as this triangle breaking to the upside fits well with a "W"W base and actually sets a bull trap.

MCP Spec Long

I still have the MCP calls open, for those of you interested in a speculative long position, MCP looks very interesting even as just a straight equity long.

Remember in this market, almost anything long is going to be speculative and should be treated as such with position size and risk management.

The bulk of positions I have open are to the short side, they are mostly all good positions in the green or with very little draw down, so I have most positions positioned in the direction of the highest probability outcome, but I can still try to take advantage of short term trading opportunities as long as they look high probability.

Market Update

I'm sure a lot of you are climbing the walls wanting to know what's going on.

If I had charts that were screaming I'd post them.

This is one of the hardest calls I've had to make in this amount of time, however the F_E_D's POMO schedule didn't change and that was the main event risk, now it will be the June meeting, I kind of figured that would be the case, they aren't going to change 4 years of policy with a POMO schedule.

I also see numerous assets like the averages looking better in the short end, the trouble is in the middle and long end, I'd short these every time, but this is a different, volatile market.

I see VXX/UVXY not as bullish as they should be and HYG picking up strength, lastly I see bellwether stocks looking better than they should, GOOG looks like an outright long swing trade here so I'm guessing the "W" holds.

I'll add positions as they warrant and not on anything other than evidence that they are warranted.

Covering the AAPL shares Added Short Today

I should still make 3 points, but I just don't want the risk right now

Filling out the HYG Call Position-June $93

Filling out still means speculative in size, I try to keep these around 5% of portfolio, unless you are using options strategies to manage risk.

I still view these as short term trades.

Opening GOOG Calls, June $870

The Ticker GOOG1322F870

Update

The $USD looks like it's slipping and the Yen has a short term / intraday positive divergence, that's good for the market, they were the opposite and that is what was sending the market lower, but that seems to be reversing at least intraday.

There are a lot of initial 1 and 2 min positive divergences in the averages. I don't want to chase those even if they are correct, in other words, even if there is a "V" reversal to the upside, I'm not chasing it, I'll wait for the next set up, but not chase a sub par one.

If the market puts in a little more of a reversal "process" rather than a "V" event, then I'll look at going in with a little more commitment to this "W" base actually firing off.

Opening Half HYG Spec. Position, June $93 Calls

I'll open the other half on a little more confirmation.

Going with GLD $134 June Calls

Of course these trades are all speculative, this market is insane with volatility, but I like what I see. I'm going to open a small call (long) GLD position.

Another Surprise-GOOG

GOOG is a bellwether, right now, GOOG looks a lot closer to a swing long than a short. I may, if I confirm the market is shaking the tree right now, even enter some GOOG calls.

Volatility

Obviously volatility is huge, but one of the things that has me holding and staying patient here is the fact the short term charts in VXX and UVXY I'd expect to look a lot better than they do if this is the break.

I'll try to get some up if I get a moment

HPQ Sure Looks Like a Good Short Here

Even if there were a bounce, the charts look horrible, the stock looks horrible (head fake move).

I'm seriously considering at least starting a short equity position there.

Quick Update

So this is the time to be watching for signals that "Diverge" with the trends. I've seen a few, right now although we are young in the process for today, my gut feeling is we lose a little more ground and then we pop to the upside so I'm still being patient, watching HYG very closely and almost ready to pull the trigger, I need to hold myself back and remember that it is based on actual data, not gut feelings.

HYG is Right at Support- $93.55

This is where the head fake move comes in, if there are retail traders in HYG and there usually aren't many, where do you think they put their stop orders? $93.54 would be my guess, so volume should rise.

I want to see evidence that the shares were accumulated, but I also want to get in while the momentum is to the downside rather than wait for the normal "reversal process" as the best discount will be on downside momentum.

Possible HYG Trade Set-Up

As Always, we want the trade to come to us on our terms, we want to have a plan and not react emotionally and last minute.

This is what I see as a potential trade, it would be long HYG which is like being long the SPY, there's a chance HYG shows better relative performance as it may need to be pushed more (as a lever) to get the SPY up because there really is no institutional demand, they have set up this "W" base, it can be seen by most traders, they saw the dip, they see the base, if it breaks out, then retail is going to chase it and they are going to do the work of driving it higher as smart money is going to be feeding their demand on the other side of the trade by selling the small amount of accumulated shares to create the "W" base and short selling is also selling and fills a buy order the same as a sale does.

This would be a speculative trade, remember a move from the "W", if we can get it, is an emotional game, it's the move that comes after that is what the market is really about so again as I've been saying with all of these calls/long trades, they are hit and run, they are short term and speculative.

Here's the set up.

 the 3 min chart saw a positive divergence on the break of intraday support

 Here's the 5 min, the last time it fired (the divergence for the last move up was actually larger, you just can't see it as it was further off to the left, but notice the head fake move right before the reversal up.  We see accumulation on the 5 min chart at the same area today and volume confirms either some stops were hit or shorts jumped in, either way it's selling they can accumulate.

Back to the 15 min chart, the lower yellow trendline is where I'd really like to consider HYG as a short term call trade.

I want the downside momentum, the calls to drop in price and buy in to price weakness with 3C strength, I'm setting an alarm to let me know if it breaks.

I was planning on using HYG June $94 calls, but now I'm re-thinking that, here's the ticker  HYG1322F94

For $93 calls, the ticker is HYG1322F93.

The 93's are about twice as much money, I'm actually steering more toward 93's if we get that break.

Context

This also would make you think that the "W" base will fire and will complete it's emotional destruction mission, feeding both fear and greed-neither one are good in trading, but that's how they make their money, people's own fear and greed are literally their downfall.

This is Capital Context's ES model vs ES, it is based on various risk assets and their correlation with ES and suggest that ES as of 10:30 (I don't know why it is so delayed) is about 30 ES points undervalued (ES is the SPX e-mini futures).

Since there are very few risk assets that are positive beyond stocks (for instance credit is horrible, commodities are horrible, etc), I believe their model probably needs to be re-calibrated which they do as needed, the reason I say so is the peak in the model's bullishness seen on the histogram was right when Treasuries hit their low of the day and yields hit their high of the day so I think treasuries are representing too much of the model, but in any case, it makes the argument that the "W" base does fire and if this is based largely on Treasuries being down and you know what I think about that, then the market is really dead meat when the move runs its course and treasuries blast off like a rocket to the upside.

Market, TLT, VXX, HYG Update

As for the market, some averages like the SPY have now put in an intraday positive divergence, most of the other averages are very mixed, but even that is a big improvement over the clear leading negative divegrences that had before the 11:20 a.m. decline this morning.

I'd say that it appears to me that levers are being pulled, in some cases not only intraday, but along the lines of what would be needed to support the "W" base actually breaking out.

Here are some examples.
 HYG is a High Yield Corporate Credit Bond ETF, it is very liquid, it is used by smart money a lot since putting together a basket of HY corporate bonds and creating your own trade is very difficult since the banks have been taking these assets off their balance sheets since 2008 so if smart money wants a balanced HY Credit instrument, this is their choice as the real credit is hard to find and has low liquidity.

As such, this is a risk asset, one that has been destroyed lately, but it is 1 of 3 SPY Arbitrage levers and when HYG is manipulated up, it is like short term manipulation of the SPY on the positive side. ARBITRAGE ALGOS READ THE ACTION IN HYG AS BEING CONSISTENT WITH SMART MONEY TAKING ON RISK POSITIONS AND THE ALGOS TREAT THAT AS A BUY SIGNAL FOR THE SPY.

 The 15 min chart is like some other 15 min charts I've shown you like the SPY's,  seem to suggest that smart money is also getting ready for a hit and run trade, the advantage they'd have here is not only are they long the risk asset, but by being long the risk asset they are helping to ensure it's profitable move higher.

However once again we are faced with, "What's in between this chapter and the next? How are we going to get there?" If indeed this holds up, then the "W" thesis is correct, I believe it was correct from the start, it's just a matter of whether it can hold out as the market's volatility and unpredictability rise.

This is a true leading positive divergence by the way.

 Longer term, the big picture, you've seen the HYG vs SPX charts and seen the damage in HYG, any move to the upside is no different than what we are doing with hit and run trades, they are not position trades, they are short term trades to take advantage of shakeouts, head fakes and otherwise emotional warfare.

The 4 hour chart is horribly leading negative, HYG's serious position traders are long gone.

 TLT which is the 20+ year Treasury ETF, the one I think is going to make a huge move to the upside (did you see last night's post on Treasuries?) Although prices are moving down, which is positive for the SPY arbitrage (as this is the second of the 3 levers), we see exactly what you know I'd expect to see, accumulation of lower prices.

We are near a support region that I will guarantee is broken to the downside (head fake) just before TLT makes a big run up.

I will continue building the TLT long option position started yesterday, I think this will be a huge trade.

 TLT 5 min is showing where TLT was sent lower, I believed at the time to help send the SPY higher and at least a 1 week period that was true, but now I wonder if this isn't part of a much bigger trade as TLT has been under accumulation most of 2013 DESPITE the market rallying.

I think this is a last chance opportunity for smart money to accumulate Treasuries while they are out of favor and very cheap, I believe this entire move served both purposes, but most important is to buy the last bit of T's as cheap as possible.

VXX is the Short Term VIX Futures ETF, when it moves down in price, it also helps the SPY as it is the 3rd of the 3 arbitrage assets. The market reads selling here as complacency or lack of fear and buys, the same with treasuries. The 1 min chart looks like VXX is being worked lower.

This is the 30 min chart. Beyond the fact that the VIX which made at least a dozen new lows last year to the point we were at 7 year new lows, has not only found price support, but look at the 3C trend.

Again, if the "W" base really fires and can complete its mission which is to scare the hell out of shorts and convince longs that buying the dip is still the only trade in town, then VXX could make a head fake move below the trendline, if so, that's where I load up-probably bigger than my max trade size and I'll sell some on the first big move.

Adding to AAPL Equity Short

This is one of the core positions, one I'm a bit nervous about as AAPL is at a deep discount, but as I said yesterday, the market is a pendulum and swings much further than what most would consider reasonable.

If it turns out that on a decline AAPL is accumulating, then I simply cover the position or part of it.

As you know I already have a partial position opened at a profit, this addition will bring the position to about 2/3rds of a normal, full size Core position-these are longer term positions I expect to trend.


Quick Update and possible GLD trade

What I can tell you (this is not the exactly the same for every average as there's always some relative performance differences) is that so far while we don't have any positive divergences going in to that decline (intraday), we do have several averages that had leading negative intraday divergences before the decline and they are now in line, so in line is definitely a step up from leading negative.

It seems to be creating the chop traders hate, but that is also the potential start of the lateral zone I need to see if the issue is being accumulated or not as I expressed today before we even started a move to the downside. Remember it still is an op-ex Friday so there's still the probability of trade being effected to some degree by the pin, to what degree I don't know. We don't need a swift upside rally, that would actually be more damaging to the stability of the "W" right now, what the "W" needs is stability which means it needs accumulation and for that it needs a rather flat (or choppy lateral) range, the most boring and frustrating kind of market is actually the most significant right now, lets see if we get it.

The GLD trade possibility would need some leverage, it is likely that it would be a very short term trade, possibly even a day trade so make sure you aren't violating Regulation "T" for day trading.

Here's GLD
This is a 2 min chart leading positive, GLD has positives here out to 5 mins.

In my view, if GLD took off right here, I'm not interested, there's a better than 50/50 chance that it would come right back down to finish this little reversal area, remember that reversals are almost always a process, not an event. Judging by the preceding trend, I'd guess this "process" is about 1/3 to 50% done. If we get a shakeout/run of the stops below the trendline, then we have a much higher probability trade with a better profit profile as well as risk/reward profile.

I'd like to see GLD come down toward the trend line, 3C to keep moving up and then a run on the stops with 3C going even more positive and then I'm interested in a GLD June $134 (monthly) call.

Soon we'll need to start looking at July calls.

There it is

There's that corrective move I mentioned in the last market update and as expected the $USD is finding a patch of weakness and the Yen a little strength, it's more about $USD weakness, but it doesn't matter, the point is the $USD/JPY is the correlation, the carry pair and as expected it's moving down and the market with it.

We should be able to get some information from this intraday decline that will tell us a lot, but it's not even starting yet, the intraday charts are leading negative so "if" we get accumulation of the dip, the market will have to turn lateral (sideways) first).

AAPL probably makes for a decent intraday/day trade using a put right here, but its speculative and I'd take the profits quick and not fool around.

Quick Update

The IWM, QQQ, SPY and Index Futures all have slight negative intraday divergences.

I believe this is because the Yen has a positive and the $USD a negative which means the risk carry pair of USD/JPY is likely to fall and the market moves in the same direction.

It is very early by intraday market trend standards, we can go a lot of ways with this much time left, but I'd watch the NYSE intraday tick and its trend for reversals intraday, I think we get something here and we need it to see if the market accumulates lower prices/pullback or not.

Market Update

Right now, any one who says they know what's going to happen in the market is simply guessing (I mean short term ), I can't even give you a decent probability YET, but I suspect something will develop.

I don't see this as an advantageous area to be trading so if anything I'd be doing some portfolio maintenance/Spring Cleaning and paying attention and looking for changes in character and subtle hints, they could be any where, in credit, Treasuries, VIX futures, the A/D line, market breadth, VWAP, currencies, etc. It's a lot of looking which I'm doing.

Here is what we have so far and why I say no one can tell you what will happen, especially as we have increased volatility, unpredictability, we have those trying to pin the market for options expiration of the weeklies and we have those who are just selling any strength, plus it's a Friday before a weekend when traders rather not hold risk and I believe we have the F_E_D's POMO schedule for June coming out after the close, not to mention currencies, emotions, etc-we have a thick stew of a lot of different dynamics.

This is all we know for certain right now, that will change-it always does.


IWM
 1 min had a positive divergence on the open, this is the NYSE Specialist effect, although I'm not saying they did this, this is the same concept, gap down to the lowest area of the bid/ask stack, buy there and run it up, that doesn't tell us much.

3C being almost perfectly in line since doesn't tell us a lot either except there isn't a really ugly negative in to the move.

 2 min chart was also positive at the open, then in line, now a slight relative negative.

The 15 min chart shows the massive distribution on the reversal, the "W" area (yellow) and the accumulation of that base, but it doesn't look so hot today.

This could lead to a number of scenarios with this volatility, a move down in to the close and then a resumption of the base's implications to the upside next week or a break down today, there are a dozen scenarios I could name. Until we have more information, it's impossible to say, especially with the 15 min looking this way right now.


QQQ
 1 min distribution yesterday thus the PUT that was closed this morning, you see that, how nimble you have to be even with a small trade like that? Imagine those who can't see what we see and are trying to buy the dip or swing trade, they're getting slaughtered in the volatility.

Again we have a positive on the open-the NYSE effect,  and in line now

3 min negative yesterday, in line now-at least as of the capture of this chart-actually I looked, still in line.

 QQQ 10 min not seeing any strength from this morning's move, so it's not that strong.


SPY
 1 min perfectly in line and still is.

the 5 min is in line intraday, but back out to the trend of 3C and give it some context beyond intraday...

The period we are looking at is the last leading negative divergence to the right.

The 15 min chart with the "W", this gives some impression of hope.

Looking at the chart above, it "seems" like the "W" base is still or can still be salvaged and/or in play. Today's Op-Ex pin makes price do funny things to make sure roughly 90% of all options (calls and puts) expire worthless because Wall St. writes the most options, retail (like us) by them, actually the juice is in writing them, the premium is in writing them and so are the probabilities as roughly 90% expire worthless and the writer keeps all the premium.

The point I'm trying to make is this, even if we take this 15 min chart and move forward as if the "W" base will still pop to the upside, there's still the story of the journey between here and there, just like there's the bigger story of the journey from here to...
HERE

I'll give you whatever I come up with as soon as I come up with it. 

Needless to say, with as many assets as I need to watch, my first priority is to all members which means I'll be slow like yesterday in answering individual emails. This is a perfect example of the problem I face in trading a model portfolio of my money, it sure is hard to put money in the market and not have it be your first or even second or third priority.


QQQ, XLF, DGLD P/L

Here's the P/L for a bunch of trades all taken on yesterday in the last hour of trade.


The fill for the QQQ Puts gave us a gain of +18.5%


The fill for the XLF Puts gives us a gain just shy of +15%

Not bad for an hour of market exposure.


DGLD actually didn't fill for me until this morning, I placed it late, it went in to the next day's que and I couldn't find a cancel so I left it and the 3X inverse ETF yielded a small gain of $1 a share, less than the 1.89%

I could have made a decent gain with MCP had I closed it on the open.

I still have this 15 min positive and range as does the market so there may still be hope.

I have been considering putting a real model portfolio on the new site which is coming along, this has been something I've wrestled with for a long time. It obviously would not track all positions, it would be a specific trading portfolio but my fears are that too many members may try to follow what I do exactly and that's not what I want to encourage, I want to encourage you to use the information and incorporate it in to your own style of trading. What works for me isn't going to work for all of you. For instance, I have an extremely high risk tolerance, it doesn't cause me to lose sleep, I don't get nervous or upset about deep drawdown so long as I still have an objective edge I believe in and if members tried to follow my trades, I don't think all members could stick with them and even a fantastic trade could end up being a horrendous loss for members. 

WOWS was NEVER meant to be a "Follow me", "guru" type of site, it has always been about helping you find what works for you and incorporating the information and concepts we have as well as tools to enhance your own trading. In essence, to teach a person to fish (and help them teach themselves how to fish) rather than create WOWS crack heads that just want to be lead by the nose. 

I'll admit, I'd have a much bigger site if I marketed myself as a guru and just gave away trade ideas and didn't waste anyone's time with the concepts, there are a lot of people that want nothing more than that, but to me, that's very dangerous.

The other problems have been, well the MCP problem. MEMBERS COME FIRST, which means my money would come second or third and rather than selling MCP at a profit, I'd be watching the open to make sure nothing horrendous is happening, looking out for my members.

Certainly not lastly as there are many issues, but one of them has been that I've had a lot of members over the years ask if I trade my own account and what my policies were if I did, what they were concerned about and rightfully so was whether or not I was entering trades and then posting them, effectively front running my members which wouldn't make much difference most of the time, but in an illiquid stock, it could make a big difference and I could stand to profit off my members. Those of you who know me know I'd never do anything like this, but its a valid concern. I suppose a timestamp of the execution of my position would clear that up.

So those are a few issues I'm wrestling with, otherwise I think a real model portfolio that goes in to more risk management on actual trades, would be beneficial.

We'll see.

Quick Market Update

The averages according to price and 3C charts in the early/fast timeframes where it matters this morning have a foothold, it's tenuous at best, but this entire "W" process has been as well so nothing new there.

As pointed out last night, although the AAPL-Effect or AAPL-lesson (It doesn't matter what the intraday divergences are when the herd starts to stampede which is what happened in AAPL just before it broke, but that was on a specific catalyst that Dan Loeb's top 5 holdings no longer included AAPL and the herd likes to follow Loeb as he's about the only Hedge Fund manager out there consistently beating the market-seriously, about 90% of them aren't even keeping pace with the SPY) can take hold at any time, we still have the 15 min positives in several of the averages for the "W" pattern so that's a bit of strength still in place.

Otherwise for the most part we are in line intraday in most averages and timeframes, some are a bit better, some are a tiny bit worse, but all in all, kind of dull looking at the moment.

Remember we do have an op-ex and that's a lot of premium so a pin is still probable, even if not as probable as the recent past. After 2 p.m. or so when most contracts are closed, the market starts to move out of the pin. We should have a good underlying read of conditions before then.

It does appear there's some effort being exerted to pull the levers-HYG, TLT and VXX.

As for Index Futures, most have actually headed higher and met up with the 3C leading divergences from pre-market.

The Yen intraday looks as if it wants to head higher, that's not good for the market, we'll see if that divergence fires or not.

More coming, but as we hit the leading positives, the market is now at a neutral point as far as short term divergences.

Selling DGLD (3x Short GLD opened near yesterday's close)

Closing XLF June $20 Put

Closing QQQ $74 Put

Note TF and NQObservations and the old NYSE Specialists' Trick

I was going to point out part of this before ES's 3C chart exploded higher and the open gave me more to work with.

 NQ (NASDAQ 100 Futures)  overnight, note there was a positive divergence before that comment out of Japan which is a VERY sensitive topic as USD/JPY is the last carry trade open and at 200:1 leverage, every pip (the smallest measurement of price-usually out to the 4th decimal) can mean millions of dollars. 

The pre-market positive is like ES's, except ES shows a very clear change right before the open with a leading positive spike.

  TF (Russell 2000 Futures)  overnight also were building a positive divergence, of course its impossible to say, but perhaps this was strengthening of the "W" base before carry traders hit the Panic (Super Fast Sell USD/JPY red button).

USD/JPY futures  overnight with a positive divergence, actually quite large which leads me to believe we are seeing an old NYSE opening tactic, I needed to see the open to try to confirm.

We knew yesterday that the charts in intraday and further out were negative so a drop this a.m. is no surprise, however on a short term intraday basis, the SPY just caught down to 3C, so far they are now in line which is an improvement over leading negative.

So far my theory is right, but it played out faster than I can type, we'll have to see where it goes from here.

Oh, the theory...

A lot of independent professional traders, especially day traders, will or would not trade any NYSE stocks at all. Why?

There's a difference between NYSE and NASDAQ stocks and the primary difference is the match-maker or middle man. On the NYSE they are called "Specialists", when you see the floor of the NYSE and traders holding up tickets and screaming, many of those traders are "Specialists".

Since the NASDAQ is not a specific place like the NYSE, but rather a series of networks that makes up the market, they have what is called a "Market Maker". Both middlemen have a function, they usually work for a big house like GS or MS and represent 1 or several stocks and make a market in those stocks, there job is to facilitate the smooth flow of transactions.

By law, even if a market is dumping and there are no bidders willing to buy shares you want to sell, "If" you sell them at market and are willing to accept the bid from the market maker, the MM has to, by law (in exchange for many perks like naked shorting, etc.) take the other side of your trade- same for Specialists.

The main difference is that the best bid/ask are the opening for NASDAQ stocks and they open at 9:30, by contrast on the NYSE, the specialist determines supply/demand and the opening price, they also determine what time the open is, I have had NYSE stocks open at 10:30.

One of the Specialists tricks use to be to see a negative/ugly pre-market and gap the stock they represent down to below the level of the sellers, then they'd buy that gap and since the entire ask stack was taken out (sellers), the stock would rise so buying the opening gap down would usually net you money, but traders don't like the arbitrary nature os Specialists powers.

It looks like that's what has happened at least on the open, it's clear in the all of the averages this morning.

From here we watch 3C, we still have an Op-Ex pin to contend with. We may see a small base here before we can head up which would be useful, IF we get a strong divergence with it.


Pre-Market

**Update, 3C Index futures are rocketing higher.

Overnight the main event was pretty silly, but a Tokyo professor by the name of Takatoshi Ito, who use to be a deputy at the Japanese finance ministry, said overvaluation of the yen versus the dollar has been corrected, that in turn sent the USD/Yen plunging overnight and right through the $101 support to a low just over $100, ironically there has been a small "W" that appears to have put in a temporary bottom for the time being, however this took all risk assets down with it, for instance, ES....


You can see the event quite clearly and normally I'd dismiss it if the timing of the comments and the move didn't line up perfectly.

In any case, since the USD/JPY, which as I said yesterday "is all that matters for risk markets now", has put in a small "W" bottom, ES has put in a positive divergence and is starting to reclaim some ground, this in itself could require a small base, not necessary, but could.

Europe didn't help matters, but this was more about sentiment already having gone south so it didn't matter what came out, but  the European April unemployment rate hit a new record high of 12.2%. Then some comments that the ECB is ready to intervene on rates and will consider all measures to maintain credit conditions sent the EUR lower, which is largely irrelevant to risk recently, whereas it use to be the main driver with nearly a 1.0 correlation. There were some good economic data too and more banks scheduled to pay back their LTRO loans, but as I said, sentiment already went south, this is why fundamentals don't matter, valuations don't matter, everything in the market is sentiment. You are better off majoring in psychology than economics if you want to be a trader.

Actually, I'm off, something just sent ES 3C rocketing higher....


"W"

Lots of things going on, I could write a huge post just on the macro-economics and certainly on the big picture, but right now everything in the immediate future can be summed up with a letter, "W".

Does this "W" base hold and make the move we expected and the move that would be a gift from the market spirits or does the increased volatility, unpredictability, fear and chance the herd stampedes starting with a big hedgie saying, "He who sells first, sells best" send this market DOWN?

 The SPY Trend Channel is very close to a change in character that changes trends.

 Like I said, "Changes in character lead to changes in trends".

This price pattern could be interpreted by technical traders as a bullish flag, a bullish pennant or something else, at this point the market will give you whatever you want to see, bullish or bearish, you can make your case. We try to do better than looking at the price pattern of 1 chart, but if this is anything, then it is...

 A "W" base that can support a emotional move to the upside, but it's very close to failing.

How can I say this is a "W" base, I can say that because I can prove the accumulation at the lows as a "W" base should do.

Lets look at the SPY 3C charts through a variety of timeframes, you can see two things, 1) there has been significant selling in to any bit of strength and the base has seen real damage the last couple of days, but there's also a bigger picture that can still pull this out of the jaws of the bear, if only for a week, the end of the story is already written, it's just how the final acts gets us there.

 SPY 1 min, a little price strength is sold hard. Will the sellers overwhelm those who put together the base? Remember, they didn't build a strong base which simply means they weren't willing to invest a lot here as things can easily go wrong.

2 min leading negative- same story

5 min chart shows the accumulation where it should be in the "W" base. Today saw a lot of damage as sellers took advantage of any price strength they could get to and these aren't retail traders.

 The SPY 30 min shows that even if the base holds and we get an emotional 5% 2-day gain which would scare even some of our traders who have a keen understanding of the market, this chart alone tells us that it really doesn't matter what happens on the upside as it is just emotional warfare, you put your money where your mouth is so to speak, and this clearly shows there's no faith left in this market.

Any bounce or rally is capped by this chart alone.

If we go to the 2 hour chart where huge flows of institutional money are tracked, we see a leading negative divergence that is exceptionally deep, this is like taking the importance of the 30 min chart above and multiplying it by 10, this is a really ugly chart, the bottom is going to fall out and soon, it's just how they write the last scenes leading to the climax.

 At 15 mins on the SPY, this "W" base and accumulation is still strong enough even with today's butt whipping to pull a rabbit out of the hat, this chart tells me that this is still the most likely ending for our story, it may or may not matter, but I understand the F_E_D releases the JUNE POMO schedule tomorrow after the close, that could tell us something before the June F_O_M_C meeting.

This is an old political trick, if you have ugly news you want to bury, you do it around 5 p.m. on Friday when no one is watching the news so this could be a real wild card.

 The 2 hour SPY chart, the trend and big picture doesn't get any clearer than this.

HYG intraday

High Yield Credit intraday. Both look like they were ready to participate in a short term move, the same as we are when we open call positions for short term trades.

FCT as a sentiment indicator.

FCT's bigger picture, this is one of dozens upon dozens of charts that all tell the same story at the same time. I said, "The back of the market is broken, but just like a snake with a broken back, this is when they are the most unpredictable and the most dangerous." 


As I always say, "Yields are a magnet for equity prices, the SHORT TERM has reverted to the mean.

A strange and uglier than usual day for another group of risk assets, commodities.

 Commods had no excuse today for such poor performance, but things in the market are often the opposite of what they appear.

 This is what I said about the set up in the VIX last night in the daily wrap, it looks like I was about as close as you can possibly get...

"And the VIX, this is really interesting because it just barely closed outside the Bollinger Bands today, a close inside the bands tomorrow sets up a VIX sell as we can see in the past, which would make sense with the pop higher in the market off the "W" base, but this is such an ambiguous signal in the VIX, I read it as being enough short term for the bounce, but not enough to halt the downside slide."


 The USD/JPY needs to move up to save this "W" base, the $USD looks ready too, not only the 3C chart's position, but look at that range, that smells of accumulation without even looking at 3C.

The Yen is the other half of that equation, the USD/JPY, for the base to be saved, the Yen needs to fall and while its longer term is setting up for a big move higher that takes the stock market lower, this chart suggests the $USD and JPY cooperate to save the "W".

I told you, "Wall St. isn't going to make this easy". Just imagine how difficult it is for those who are looking at price and MACE only, trying to buy dips and so forth.

We'll know more tomorrow- remember the market is free to start moving after about 2 p.m. as most options are closed by then.

As hard as this is to call at this point, it's really a pretty simple situation, it's "A" or "B". In my experience, once Wall St. sets up a plan, they rarely let it fail, the only thing that would do that at this point is a stampede.