Wednesday, April 9, 2014

SPY Broad Market Update

All of these charts were captured around 11 a.m. to about 12 p.m. today (Wednesday, April 9 2014) so some of the intraday charts or shorter term are going to look different, but the market updates will keep you up to speed, we are really interested in the big picture any way as well as concepts we can pick out and use to our advantage.

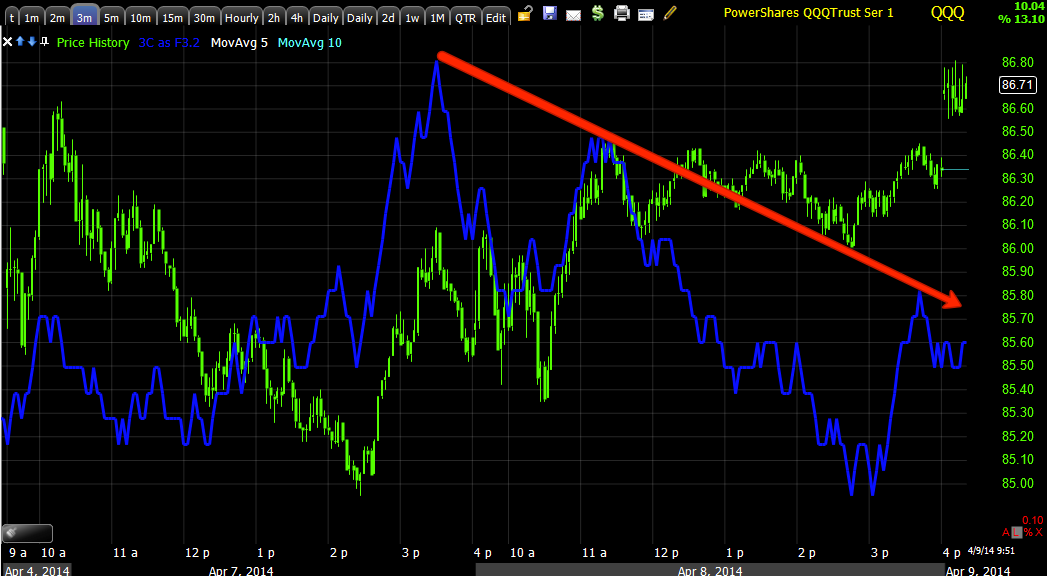
 This is the trend of the 1 min chart, we usually use this for intraday signals, but there's value in the trend as well. At "A" we have a clear distribution period (red arrow) through the later half of the stage 3 top's range. At 1 there's a small H&S price formation (whether it's a true H&S or not doesn't matter as few traders know how to verify the price pattern or bother to, thus you can see a micro view of how Wall Street uses Technical Analysis against traders and why. The first "HF" or head fake move is a break below the neckline of that H&S top-looking price pattern, that's where traders will short the pattern as the break of the neckline represents confirmation to them, this is why the get shaken out so often right here. As the shorts enter and price moves against them their stops are usually right above the neckline which by T.A. standards should serve as resistance, once broken there's a mini short squeeze as they cover and that gives the market enough momentum to make a higher high that serves as a larger head fake move above the stage 3 range which pulls in longs buying breakout confirmation, another head fake, another trap. 

These head fake moves are used to create positioning and momentum, look at the downside price momentum on the smaller first HF and then the downside price momentum on the larger second HF, if you haven't already I encourage you to read the two articles I wrote about head fake moves which are always linked at the top right side of the members' site, you'll find there's a lot of meaning in seemingly meaningless moves or deception in those moves which after some time becomes very predictable.

I highlighted April 4th because it was after the op-ex pin (weeklies) was lifted around 2 pm (as usual) that we saw the first signs of what this week would look like, a base built early in the week and then upside which we have already seen even if we end up with a larger base or nothing else. The white box around late Friday through present (at the time the chart was captured) shows the underlying trend of accumulation in to the release of the F_E_D minutes today.


 This is the intraday view of the 1 min chart, there was a negative divegrence, not a deep leading negative, it almost seemed like it was just holding the SPY from moving higher at each attempt, almost steering it in to a range. The day ended with a leading negative divegrence on this timeframe.


 SPY 3 min shows distribution at several points, one happens to be the larger of the two head fake moves that received its momentum from a small short squeeze that was based on a head fake move, of course late last Friday afternoon the first positives started showing up giving us an idea that we'd see a base and upside rather than continued downside as the new week (this week) began. The far right red arrows are relative negative divergences, the weakest form and very small as well as a fast timeframe so they aren't that meaningful, but need to be watched for further development.

Again the accumulation area and 3C signals are outlined on the time-scale below.

 The 5 min chart shows the same distribution at the same areas, the fact that the 5 min chart was signaling distribution at the head fake break higher is important because the 5 min timeframe is where we really start getting stronger institutional signals.

You can also see accumulation at 1 and some distribution in a weak relative negative divegrence, this is still very similar as of the close today.

 The 5 min trend shows the entire February cycle from accumulation that started Jan. 27th through Feb. 6th, that's stage 1 "BASE". 3C moves with price confirming the price trend at stage 2 mark up and distribution at stage 3 top, note the depth of the leading negative divegrence, this is proof of what we anticipated before the move even started, that it was to be used as a distributive move to set up momentum for the stage 4 decline which half of the market is already in (from the Feb cycle).

 The 10 min chart goes back a bit further, but the Feb cycle is the defining feature on the chart, note the positive divegrence starting Jan. 27th, also that last head fake high mentioned above can be seen here as well so it was an effective move to draw in longs and create a bull trap, thus downside momentum.

Here we see a positive divegrence on the 8th, it actually started late on the 4th, but it wasn't strong enough to show up on such a strong timeframe until it was more well defined which is around the 8th.

If you take anything away from this chart it should be the usefulness of a head fake move in creating momentum, look at the fall after that head fake / failed breakout.

 The 10 min trend... I marked where the accumulation for the Feb cycle would have been, the depth of the leading negative divegrence through the Feb. cycle is more proof that this was never meant to be anything more than a set up for stage 4 which is what we had predicted before the first point was made on the upside.

 This is the 15 min chart scaled to recent action, again note the strength of the distribution at the head fake move, that was a significant amount of distribution to show up on a 15 min chart in such a small area, for the SPY there's no positive out this far, just in line status, that continues through the close today.


 A longer 15 min trend and the Feb cycle, again the stages are apparent, the range of stage 3 (top) and leading negative divergences through that area which are now at a new leading negative low, we should see a serious stage 4 decline shortly.

 This is the full perspective of the 15 min chart, this gives you some idea of the trouble this market is in.

The 30 min chart is interesting because you may remember me talking about distribution in to Q4 December 2013 Window dressing, look at 3C after that and in the area.

Once again the Feb cycle is revealed for what it is, a large distributive event which looks to me like we will be moving in to a primary downtrend, even though we already have averages like the Q's and IWM in downtrends, they are not primary yet.

The 60 min chart with the last two areas of any serious accumulation to the far left and the Q4 window dressing distribution again, you might even go back to the 23rd of December , in and around that area when we were noticing odd distribution at window dressing for the full year as well as Q4, the market never recovered after that as you can see and the Feb trend or cycle is truly seen for what it is. This is why I can't put any serious contemplation in to this market moving higher (in any meaningful way) and why at this point any price strength should be considered as a gift to short in to.

The 4 hour chart is one of the strongest, I think it speaks for itself.

And the daily chart with Money Stream (similar to 3C in what it does) below in light blue, both indicators showing massive distribution.

On a 5 day chart note how small the 2007 distribution was compared to now and how bad the trend down was after the 2007 top, just imagine what we are facing on the downside now with a divergence this much worse and a totally different indicator, Money Stream confirming the same.

2014 shows particular weakness.

Well there's a look at the multiple timeframes of the SPY. As you can probably tell, there's not much I can imagine that will save this market and the multiple timeframe analysis is telling us that everything is lining up for what we might term, "The perfect storm".

EOD Indications

I'm not worried about that IWM Put, although it was fun watching it move in value pretty fast.

The Index futures (intraday) for the most part (ES not so much) are doing the same thing as the IWM...
 Intraday NASDAQ 100 futures leading negative

Russell 2000 futures intraday leading negative

These 1 min charts of futures I don't trust to hold overnight like the 3C charts of the averages, but it does show what's going on in to the knee-jerk move, confirming what the averages, especially the IWM are showing us.

Speaking of which...
 The IWM is still leading negative, in fact you can see a worsening divergence on the pop back up after the initial decline so I'm not concerned, especially with all of the other charts/timeframes, at least not for the Put position.

I think this probably puts the "W" formation back on track, although we'll have to really watch it and make sure it's still a base, that means falling prices need to start showing accumulation, otherwise this base that has been put in so far is or was simply for the move off the lows and the knee jerk reaction which as I said is possible on leaked data which has happened before.

The NYSE TICK isn't "screaming" anything, but it is negative at the second high, so it too is supportive of what we saw on the IWM charts.

I'll check leading indicators as well, but I feel pretty comfortable with present positioning.

IWM Update

Just so you know why I chose IWM for a put and what we are looking at, this is vs the Q's which were a close second.

 QQQ 1 min

QQQ 2 min

QQQ 3 min

QQQ 5 min


IWM
 IWM 1 min

IWM 2 min

IWM 3 min

IWM 5 min...

As you can see, it was a pretty easy choice.

With the divergences above, I'd anticipate that were still looking at a run down to the "W" base lows which are around $112 for the IWM, although when the position is closed is a function of how the market reacts, I anticipate it will be open through at least part of tomorrow.

Going with IWM April (monthly) $115 Put

This is a very short duration position and very speculative.
The intraday IWM chart at the knee-jerk, not looking good.

I'd like to catch this on a tiny bounce, but I don't think it matters that much.

Trade Idea... IWM Fade Trade

I'm looking at a possible, very fast, very speculative trade, IWM short/puts. I personally am thinking IWM May (monthly) $115, really a shorter expiration would be much better, but I'm considering if I were to get stuck and need the time.

This move is parabolic and to me it doesn't look like 3C is improving, in fact in some cases like the IWM and SPY it is looking worse so I have that on deck and looking for confirmation to pull the trigger.

I think other assets that would work would be the leveraged short ETFs like SRTY for 3x short IWM or SPXU for 3x short SPY.

I'll let you know before I do anything, just wanted to let you know I'm considering it as a VERY quick, likely 1-day position.

Keep an eye on the NYSE intraday tick chart (1 min) to give you a feel for what's going on with market breadth, it's a great early warning indicator for a reversal intraday.

Where we go from here

So it sounds like the F_E_D had an emergency meeting on March 4th about forward guidance which was ultimately dropped for qualitative guidance which is essentially arbitrary and difficult for the market to discount, just look at market performance since the last meeting, not exactly inspired.

In any case, the minutes reveal that the F_O_M_C was VERY aware that there was a dichotomy between the "DOTS" regarding where rates would be which is a larger sample of the F_E_D, not just voting members and that was clearly more hawkish, the F_O_M_C policy statement was considered to be more dovish.

The question I have is if the minutes reveal that the F_O_M_C was talking about the problem of this dichotomy in the 2-day meeting, WHY IN THE WORLD WAS YELLEN SO UNPREPARED TO ANSWER THE QUESTIONS AT THE PRESS CONFERENCE, I think her best or maybe only answer was, "Who knows why people write down what they write down".

I have an answer for you Ms. Yellen, the rest of the F_E_D (regional Presidents. etc.) are much more hawkish than the F_O_M_C, of course the F_O_M_C makes policy, but voting members DO rotate, we just saw a rotation with Yellen coming in, so the market may take a little time to digest this, remember the knee jerk reaction which seems to be underway right now.

This is what the charts (intraday) looked like just before the minutes and a couple of minutes after, what's important now is what these charts look like in 30 mins or so.


The averages intraday today, we already know we have positives stretching to 10 mins in some cases so upside is not surprising, it's just where the upside is going, when the "Actual" start begins, it could be now in which case I just wait for the next set up (short) or they could move down to that "W" after this initial knee jerk and if charts hold together at that area, we have some long trades that would make sense, but they still are only trades.

 DIA intraday negative

IWM intraday negative

QQQ intraday negative

SPY intraday negative.

Lets see if these hold, if so, there may be a fade trade.

Pre-Minutes Update

Intraday charts in all of the averages look a lot more like the initial move on the minutes will be down, they have been building this intraday negative most of the day.

We'll see where it goees from there, but I'm largely sitting on my hands until I see something more high probability/less risk.

Update

I've been looking around at some different stocks, especially some of the core short positions with nice gains in them like BIDU with a +9% gain and it hasn't even gotten started yet. I was looking to see if it made sense to protect those gains and re-enter them and maybe even enter some long positions for short term trades, BIDU or XLF, but other than some of the ones I've already called out like NFLX or the Q's (but at a particular area in which the trade comes to us for the Q's call /long) I really am not seeing much to motivate me as of yet to make any significant changes.

I can't show everything, but I think the two mentioned above are good examples of the trend I'm seeing overall.

 I was considering whether to protect BIDU (core short) gains and re-enter, but with a 60 min leading negative divergence like this I really need some good reasons, core positions aren't trading positions, they are more trending positions and they're not meant to trade around every jot and tittle in the market.

 BIDU 5 min tells me the probabilities are that BIDU bounces near term, but as I'm always looking at and saying, "Knowing the probabilities is not the same thing as entering a high probability, low risk trade/position".

With pretty much only a 5 min positive, the trade I want to consider here is adding to the BIDU short on any price strength or call it out as the market tells us it's losing momentum as a new position for some that may be interested; that's letting the trade come to you, trading the probabilities with high probabilities, low risk and overall excellent entry timing.

I was also looking at whether it might make sense to close some longs like FAZ, 3x short Financials, especially as they are more of a trading position, but once again...

 The February cycle in XLF and the 60 min leading negative divegrence needs a lot of confirmation for a shorter term move for me to exit and/or reverse the position, even if for only a short time. I have found that during that short time the market tends to surprise you and trade with the highest probabilities like the 60 min chart above in a massive gap down one unsuspecting morning, THE AAPL LESSON!

WHILE XLF DOES HAVE A 10 MINUTE POSITIVE, I THINK I'D REALLY NEED TO SEE SOMETHING MORE AKIN TO THAT "W" BASE IDEA I'VE BEEN LOOKING FOR.

If we had something like that, probabilities for short term trades would increase dramatically and the trade would be coming to us, very different than where we are now.

I'll continue checking and unfortunately this is one of the VERY few days of the year I'll have to turn on CNBC to hear the minutes as I'm watching the charts. I may be a little quiet as we go through the initial release of the minutes, but any edge I see I'll have it to you immediately.

Trade Idea: Reiterating NFLX Long

This is for a swing type trade, NFLX is still a core short for a primary trend in my book and any decent upside should be considered for shorting in to, but in the mean time, NFLX continues to look like it's going to see some decent upside, I don't think you need options (leverage) to make this one worthwhile, but I think you obviously could look in to some calls.

 This 60 min chart of NFLX shows the longer term trouble its in and why it's a core short position, however, closer to home...

 We have a positive divegrence out to 30 mins in NFLX, this is why I mentioned it and put it in the trading portfolio.

The 10 min chart is just confirmation of intermediate timeframes also positive, but recently the very short term charts have been looking excellent and when they all line up like that, some movement is usually just around the corner.

This is the 3 min chart with a positive at recent lows and a leading positive in the flat trading range (intraday), I like this one a lot for a swing type trade (LONG)

Intraday Market Update & Broad Market Update

I've had some people asking to see a full set of 3C charts which I'm not typically focussed on because I know how bad they are, I'm more focussed on the tactical as the strategic implications are already in place, but we do have a few new members and it's probably about time to put out a full update, I'm going to use the SPY, when you see how many charts there are you'll understand why I don't do all 4 major averages, but there's really not much difference between them. Since this is a long post with at least 15 charts I'm going to work on it through the day as I have time, right now the market is dead in the water ahead of the 2 p.m. EDT release of the F_O_M_C minutes, things should get exciting shortly after that.

I suspect the minutes have been leaked, there's the start of a base or stage 1 cycle set up that we saw late Friday begining and all this week thus far it has gone on except yesterday when it just kind of floundered around which I suspect is so it can be timed with the release of the minutes while the media would say it's "Nervous anticipation ahead of the minuted", I suspect it's something different. 

Once in a while we do catch leaks, we've caught about 3 F_O_M_C policy meeting leaks before the announcement that were clear as day, we also caught the F_E_D red-handed sending out the minutes almost a day and a half in advance to 154 firms (mostly private equity and the big Wall St. investment banks), the F_E_D EMAILED them to these institutional investors and not one of the 154 mentioned to anyone that, "We got these in our email a day and a half ahead of schedule".

Moreover, since when has the F_E_D had a custom email list to distribute data that's suppose to hit the market at the exact same time for all participants? How do I get on that email list? In a normal data release, the HFT's would receive the data (according to NANEX) milliseconds BEFORE it is actually released, so why would email be a faster way unless it's just sent out a day and a half in advance, that beats milliseconds every time.

So I'll be working on the post and watching for any signs of a leak beyond what we've already seen so far this week and also watching for any changes in character as far as what's been built this week.

Remember that almost all F_E_D / F_O_M_C data has the mandatory knee-jerk reaction at first which is usually quite strong and almost always quite wrong, it's usually faded within a day or two, the Sept. 19th announcement of QE3 comes to mind, the initial knee jerk was higher of course until 2:24 p.m. in which the high was put in and the market faded the QE3 announcement for a loss of -8% that wasn't regained until January of the next year.

Right now, the market intraday is divided with the SPY and IWM leaning more to the negative while the DIA is in line and the Q's are somewhere in between. If the SPY makes a deeper leading negative divegrence soon then it might make for a decent day trade using weekly puts.

The SPY intraday 1 min TICK data is deteriorating as well. VXX is accumulating as it should be as I suspect that's what most of this is about as any market bounce seems meant to send the VIX futures lower to their accumulation range which is unidentifiable because they are accumulated on ANY price weakness.

 DIA non confirmation at the open to confirmation.

IWM leading negative intraday

 QQQ with a relative negative divegrence.

SPY leading negative intraday and close to making a lower leading negative low which would change the dynamics and likely send the SPY lower.

QQQ Options Trade Follow Up & Opening Indications

I like to keep options trades as short as possible, at the first sign of a loss of momentum I want to be able to sell a call in to higher prices and a put in to lower prices, I don't want the premium going south on me when I'm trying to unload them. So I may not get the BEST exit, but I get an exit, I reduce my market exposure and wait for the next set-up, if I get stuck holding an option longer than I had hoped, I'm usually ok because I'm almost always going with expirations that are 2-3x longer than what I think I'll need. The next set of QQQ options (or wherever they may be) will be out to May monthlies, this isn't the way to hit home-runs with options, but I'm not using them for that, I'm using them as a tool to give an otherwise decent trading signal the profit potential that makes the position worthwhile when an equity trade just won't do. I've blown up an options account trading the way they are designed to entice you, buying out of the money with short expirations and holding way too long, these are Wall St. derivative products meaning they're like Vegas, if you sit at the table long enough you lose so I do everything the opposite of what their allure is, buy in the money, buy longer expirations and hold them for the least amount of time possible, you can always re-enter.


With a cost basis of $1.44 and a fill of $2.10, the QQQ April $85 (not $90-my mistake) came in at a gain of +45.8% which isn't bad for 2 days.

I had an idea yesterday of what I was looking for in the market and last night's futures action reinforced that idea.

Essentially I'm looking for something like this using the Q's as a proxy for the broad market, although each average is in a little different situation.

 QQQ 10 min, the base that's in and divergence is already plenty strong to make the targets I posted yesterday, but with the carry trades and some signals in the intraday charts, I expected this based on the information available at the time...

A "W" shaped pattern larger than what we saw starting to form in the late Friday divergences. I put in a head fake move/stop run on the second bottom because that would be the highest probablility before a base like this breaks out.

The TICK data is not conclusive on its own, it's just another piece of the puzzle that supports the same theory (this is my custom TICK Indicator)...

SPY vs. NYSE TICK data (intraday).

So I needed to make a choice quickly this morning with time decay becoming a larger factor, I looked to the opening indications to see if there was confirmation of the open or not as we already had intraday signals suggesting some pullback in the averages is coming...

This is the QQQ shortly after the open with non-confirmation which taken with the other averages made up my mind to close the QQQ April $85 Call position.

This is the larger 3 min intraday divergence that was already in place as of yesterday putting short term probabilities a bit more on the side of a pullback and a "W" base.

I checked the Carry trades (actually USD/JPY) to see if what I saw last night was still holding and it was...
The $USDX 5 min chart that needs to move up for the USD/JPY to move up saw accumulation of a first low in what I suspect will be another "W" base and then some overnight distribution which would be needed to send the $USDX to its second low in a "W" base.

The 5 min USD/JPY is supportive of some small base forming here with a positive divegrence in 3C, I suspect that will be a "W" base formed at the same time as the QQQ/market and then they'll turn the Carry Trade correlated algos back on.

The intraday 1 min USD/JPY was also supportive of a pullback which would be a needed first step in creating a "W" bottom/base.

As for the other opening indications, they supported the Q's...
Here's the SPY not confirming the open...

The IWM

And the DIA.

So it's about waiting or being patient for the next set up to materialize.

There may be a trade on the downside, perhaps a QUICK put position, I don't think an equity trade would have the profit potential to make it worthwhile and with those 10 min QQQ leading positive divegrences we really want to be sure before entertaining the thought of a put position in what would be very speculative trading.

I'm going to check on some other assets we are involved with or that have been mentioned recently as potential trades.