Monday, April 16, 2012

A new ingredient in the stew

I mentioned several times today that the $USD weakness that developed after the European close was broadly supportive of the market...

Here's an example using the EUR/USD which accounts for 50% of the Dollar Index
In red the Euro moves down, the dollar moves up which pressures the market and as you can see, the Dow slid at that point as would be expected. After the EU close the Euro gained strength and the Dow was roughly in line the rest of the day except the end when the Dow sold off a bit in to the close, even though the weaker dollar was still supportive of the market.
With Yields in Spain rising above 6% and Italy quickly approaching the same, Euro strength/Dollar weakness is a bit unexpected. There's a gaping hole in in EU banks' capital requirements, some such as Unicredit and Credit Agricole are falling way behind on what is acceptable capital requirements. In fact, as a percentage of their market cap, the two banks along with several others have about a 60% capital gap vs their market capitalization. On average throughout the EU banking system, the average is around 20% of market cap. With their share rices being where they are, these bans do not want to issue new shares and it's unlikely many investors will step up to purchase a new offering knowing that it is going to be used to fill a massive gaping hole in their capital structure.

You may recall in October, one of the things that pushed the rally in the market above and beyond where one would have expected was a massive liquidation of $US dollar denominated assets by EU banks as they had been ordered to recapitalize. During October, for the first time since Markit's inception of their PrimeX market funds (Prime mortgage backed indices), they fell below par, that was the first time ever and why? European banks were selling any and all assets that weren't nailed down to raise capital. The end result was the $USD denominated assets which the EU banks sold had to be repatriated back to the local currency, the Euro; this meant that once the $USD denominated asset was sold, the funds from that transaction (which were in $USD) had to be sold and Euros bought to bring the money back to the EU banks. Arbitrage algos which see dollar weakness as stock cheapness went on a buying spree pushing the market higher, the algos are Currency arbitrage programmed, the computers didn't know what the underlying situation was, they only saw $USD weakness and equated that (as they are programmed to do) with stocks being cheap and they did what they were programmed to do and bought equities. This was a confusing environment because the underlying cause causing the market to rise was a huge problem with EU bank capital, which would normally be associated with a market negative event, however the sale of $USD's pushing the $USD lower and subsequent purchase of Euros pushing the Euro higher created a self-fulfilling loop that the algos had no way of understanding. The end result was a risk on environment in stocks during a market negative event all because $USD denominated assets had to be repatriated to EU banks to plug the liquidity holes.

Since then the ECB (European Central Bank) has conducted two LTRO's in which banks can pledge assets to the ECB and receive a 3 year loan at 1% interest. This money was "intended" to be used by banks to finance a carry trade by buying their county's sovereign debt, thus driving yields down. Very few banks actually conducted this carry trade (it's a 3 year carry trade in theory because the banks get the ECB loan at 1% and then buy higher yielding sovereign debt at 4-6%, the difference between the yield and the interest rate paid on the loan is their carry trade profit).

Instead most bans put the money directly in to the ECB's deposit facility which set new all time records after each of the ECB's L 2 LTRO operations, in reality the banks would rather have the money on deposit with the ECB at a .75% interest rate and lose .25% (being the loan cost 1%) then to invest in sovereign debt. There have been examples of banks buying sovereign debt, we know this because the debt auctions by various PIIGS countries are generally successful if the maturity of the debt is shorter than 3 years, but when the debt being issued is longer than 3 years, the auctions tend to fail. The problem for EU banks now is that they have pledged the majority of collateral to get the LTRO loans and are now left with little left to secure funding. Sovereign yields are rising again, this is not good for the Euro, yet the Euro defended $1.30 and lifted today. This suggests that EU banks may once again be selling $USD denominated assets in an attempt to bring liquidity back home, not necessarily capital. Anyone who has run a business understands that cash flow is not the same as profit, yet these banks must raise liquidity as sources of funding are drying up.

If I had to venture a guess, by looking at the breadth of the market, I'd guess that they've been selling equities in the U.S. markets and converting the $USDs to Euros if this is in fact what is happening again. It is clear the EU banks desperately need liquidity and capital. We may in fact be seeing a similar situation, however this time it may play out a bit differently as algos are less likely to be engaging in currency arbitrage, although there are certainly a portion that do nothing but that.

If this were to come together with increased volatility, the bounce we get could be the bounce I was expecting (at least a break above the support that has been broken in the market). As this seems to be a rather new event its difficult to say if this is what is happening, but it should be monitored. Should the EUR keep rising with sovereign yields spreading wider, then there's probably some repatriation of Euros going on. Whether the market (more specifically algos) are willing to chase it as aggressively as last time is doubtful in my mind, but it may provide a little boost needed to get above those broken support areas on the original volatility shakeout move.

 The European markets are clearly rolling over as seen here in the Euro Top 100 Index.

 Here's the EUR/USD opening Sunday night in green, the market open today in yellow and the close in red.

 The trajectory of the Euro today, this means the $USD fell

 Here's the SPX/Euro correlation today, in this case  the Euro is more supportive than the SPX moved today (white).


The $AUD didn't see the same rise as the Euro did, this would suggest that the other currencies vs the dollar are not reacting, which would suggest the Euro/$USD is the pair that is reacting. In an environment of rising EU sovereign debt yields, this would not normally be expected unless there was a basic supply demand issue, one of selling $USD and buying $EUR to increase EU banks' liquidity. This would also have another effect, it would remove support for stocks as the stocks would first have to be sold before any currency repatriation could take place, further undercutting the breadth of the market and making it more of a house of cards than it already is.

I'm not jumping to any conclusions as of yet, but this is something worth understanding and monitoring.

As of now the Euro is pretty flat since the close, ES is also flat since the 4 p.m. close.

I'll update any changes.

BIDU Update-The complexities of the market

This market is what you call a meat grinder, unless you are nimble and quick, positions long and short are just being decimated, that is when it really pays off to step back from the noise and look at the trend. There are a lot of great examples of volatility, manipulation, head fakes and just general chaos that the market intentionally puts in your way. As emotional creatures, hours can influence our outlook, as traders we need to try to step away from emotion and sort out what is really happening and how we can use that to our advantage, the best way I know how to do that is to step back from the intraday and day to day trade and emotion and determine what is really happening. For example, last night's Market Breadth charts make the situation very clear.

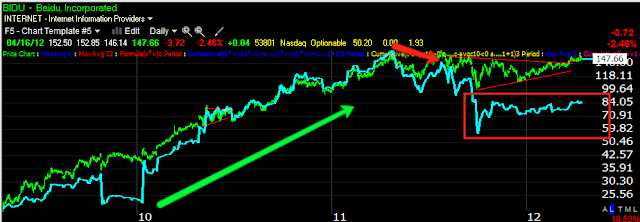
 BIDU shows a clear trend from 2009 through mid-2011, but by 2011 the volatility becomes obvious and the trend is no longer clean and stable, this is almost always a sign of a top. The large triangle that developed soon after is another sign. The fading volume as BIDU moved higher is one of the greatest central bank manipulations of the market I have ever seen. Without QE1/2 BIDU would probably be trading in the $25-$50 area. The lack of volume cannot be ignored when looking at the big picture, this is a clear sign traders are not willing to pay up for BIDU when they know it's a house of cards.

 Money Stream confirms the trend up , but goes negative in 2011 and just gets worse from there.

 As has been the case 80+% of the time, before any reversal, whether a 1 min chart or a 5 day chart, there's almost always a head fake move to throw traders off, to trap traders and add extra momentum to the reversal. In yellow this is the almost certain area of a head fake move. For a break out from such a big triangle, BIDU has gone nowhere since.

 Here's an example of a head fake move on a 30 min chart, there's a clear triangle which is taken by technical traders to be a continuation pattern, they would expect a break to the downside, instead BIDU breaks to the upside in a head fake move, then sucks all the longs who bought the breakout down, likely many being stopped out, contributing to the downward momentum. Imagine the momentum on a daily chart for the hardcore longs.

 Like many Tech stocks, the damage was done near the open, the momentum waned from there throughout the rest of the day. We have a "U" shape and a relatively flat area in BIDU through the afternoon.

 When looking at the big picture if you want to step back and avoid all the volatility (although there' money to be made in this volatility), I want to make sure I'm short BIDU as it breaks below the $144 area and especially in to and below the triangle in the $130's. We always try for the best entry with the highest probabilities and last risk, but if I were a large hedge fund manager who had to put a position together in BIDU (which could take weeks), I'd essentially just short every day BIDU was up and keep accumulating the short position. As we trade in much smaller size, we can be more selective and typically have to be more selective as our funds under management and transaction costs can be prohibitive to such a strategy.

 3C 60 min is negative on the BIDU breakout-tht is the point of 3C, to contradict price with solid signals. Since the breakout of the large triangle, BIDU has done nothing but chop. A real breakout would have seen BIDU making a new leg up long ago.

 Intraday today the 1 min chart in BIDU looks like weakness was bought, a lot of the tech stocks look like that today. It is one of those things in the market that we don't easily accept emotionally, buying weakness and selling strength, but that is the way of the market.

The 15 min chart is in line, right now after having seen a positive and then negative divergence, this would suggest to me a short move in BIDU up, followed by continued downside until it breaks those support levels. It is these short term moves where we want to try to pick a position that is not only low risk by shorting BIDU at the highest point possible, but also doing it in a timely manner so we don't sit through a month of chop. The market is clearly moving toward falling off the edge of the cliff. Last week when the bounce started shaping up I thought two things, 1) incredible volatility which should translate in to very impressive price moves (such as last week's 2 day move up being the biggest 2 day move of all of 2012) and #2), this is likely the last bounce before the market snaps. There's just too much damage done to the underlying trade, to risk assets and credit, to market breadth and now the negative news cycle coming back in to play and Europe looking at a potential Spanish default which could be game over for the EU.

While I and many of you have used the volatility to great advantage using options to get extra leverage on otherwise very quick moves, the big picture is starting to move me away from options and I want to look at pure equity positions as expiration and options decay is not something I want to deal with when the market moves out of all of this sideways volatility and in to a trend.


PCLN Update

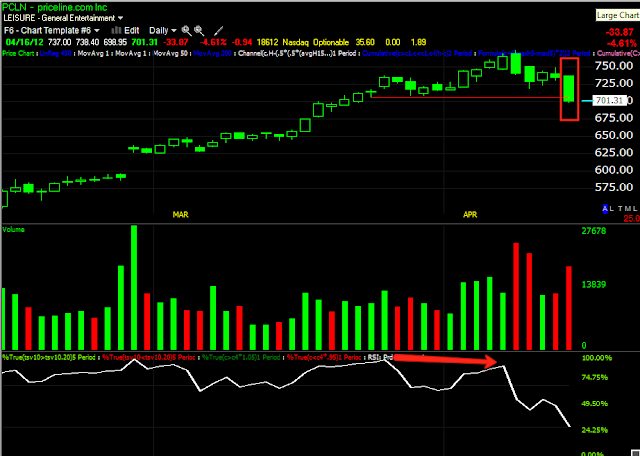
I suspected PCLN was making a head fake move, it consummated that move today, but also broke just below its support level. I took out some Puts on PCLN a bit back, but I went to early on the expiration at April, May would have been beautiful.

Most of the damage today in PCLN was on the open, the rest of the day it stayed fairly lateral.

 Here's the suspected head fake breakout move and a break today below the breakout area.

 The 5 min chart for PCLN shows a decent 5 min positive divergence, remember, 3C is suppose to contradict price, that is where the edge is. The very late break below the intraday lows and then recovery back above them is a little interesting as that would draw in a new round of shorts, obviously this is a potential bear trap, longer term though if you can sit through some draw down and volatility, I think PCLN as well as AAPL and many others can be taken anywhere in this area and still yield significant gains, much bigger than what we have seen on the downside. Of course as always we want the highest probability/lowest risk entry and that takes patience and lately nerves of steel.


 Here's the 60 min chart to give you an idea of what kind of damage PCLN has seen. Typically a decline will almost always drop lower than where the divergence first started which would be around the $640 level, however I think there's much more downside to PCLN than just that.

Traders see these parabolic moves up in PCLN and AAPL and are convinced of their strength, when a stock breaks character like this, from a nice steady uptrend to a volatile parabolic move, it certainly can b fun to ride out on the long side, but people get emotionally attached to stocks that have made them big/quick bucks and they are loathe to admit the party has ended and the market will give them a thousand reasons why their point of vies is correct, that's why they typically end up losing all of the gain. In my view, PCLN could very easily retrace to $400 and probably below as longs become sellers finally.

This is one of the most challenging parts of a market cycle, but it's always good to step back and look at the big picture and realize, you didn't miss the bus. In the mean time, I'll stay patient with PCLN and see if the trend of increased volatility continues, if not, I'll gladly take PCLN at $650 and rise it to $400, although in the near term I'd rather be a bit patient and see if I can get in at $725.

EOD Market Update

 DIA 1 min is seeing some distribution, they can't sell in to something that hasn't moved and the Dow has been the best performer on the day.

 DIA 5 min is at best in line.

It may be worth considering some leveraged shorts on large caps, such as BGZ, or at least phasing in to them, leaving room for any potential further gains in the Dow.

 The IWM 1 min has been in line all day since the early negative divergence, small caps are another that look unimpressive to me.

 5 min IWM, this is why I don't see the IWM as much of  factor.

 QQQ 2 min has continued to build, even with some late day market weakness.

 The 5 min above still looks impressive.

 And now even the 15 min looks impressive.

 The SPY seems to be seeing some late day positive divergences in to some late day weakness as it hovers near unchanged.

The 5 min chart still looks fairly impressive in the very near term

USO Update

I'm still a little ticked my earlier USO calls didn't get filled, but that's part of the game.

 I have said I'm short term bullish, meaning these little bounces and longer term bearish on USO as this is a near perfect example of the "Boiling a frog" theory.

 USO has been clearly trending down, but for those who get caught up in the intraday trade, there have been numerous intraday recoveries to make you "Feel" USO is more bullish then it actually is. You see the quick moves down and then the longer moves up, intraday this can "feel" like there's strength in a trend that is clearly down, but this is all part of the game, as I maintain and will until I see different, a price chart is a reflection of emotions.

 USO's break below some significant support today was clearly being accumulated for one of these short term trades with calls that have worked well if you are nimble enough to get out of the way in time. Honestly the same play could be used with puts, but the position would need to be closed early after the a.m. gap down. There's overhead resistance in the area and USO seems to be consolidating before making a run at that resistance.

 Today's a.m. accumulation of the break of support, the 2 min negative divergence toward the afternoon doesn't have to imply a reversal, many times these are just consolidations.

 The 5 min chart, which is one of the main reasons I put in the Call order earlier for the options MP is holding up fairly well.

The hourly chart looks like this is USO's best chance to break toward the downtrend's upper trend line.

Knowing that USO would need dollar weakness to pull that off, that also has some impact on the overall market as it would benefit from the same dollar weakness.

For now, I'm holding the May $38 calls in USO from Friday.

AAPL Update

As you know, AAPL is a behemoth, I wouldn't expect it to turn on a dime, but since the early morning rout in AAPL, it has held its ground traveling laterally which is where we often see divergences, traders look for momentum to define underlying smart money action, but in years of experience, their moves are made in relative calm.

The QQQ divergence is getting to be quite impressive, especially relative to the leaders today. One thing of note is that we have NOT seen downside follow through in the market as a whole, which has to be discouraging to the bears. I'm not sure the bulls know what to think at this point, the "Buy the dip" brainwashing has been very effective so I'll have to look for my sentiment update from Sam-that's your cue buddy!

I don't see how the Q's can rotate in with out at least some support from AAPL. The entire premise of the bounce from the SPX breaking the 50 day moving average was a volatility bounce. the evidence built in after the theory, the concept of the volatility bounce has been the trend in the market and until the trend ends, we are best off following the trend.

As you know AAPL broke a centennial mark at $600 and support below that today, translation, "Candidate for a volatility bounce". Since the a.m. drop in AAPL, I haven't seen much that would indicate that trend of volatility shakeouts has ended and AAPL is in the perfect spot for such a move.

 AAPL 5 min leading positive today with some relative divergences as well.


The 15 min chart is what is really looking more impressive. Shorter term divergences have a better chance of being run over, this 15 min has less of a chance of being run over and a significant portion of it came today alone.


Market Update

The market is starting to move fast again, but looks set for rotation. 

 The Dow is having a decent day, thus all the large caps like XOM/WMT popping up. This is the resistance area the Dow would need to break to get an effective shakeout and possibly get longs involved, as you can see we are very close.

 The IWM has a longer way to go, I'm not sure it will even matter that much in the end.

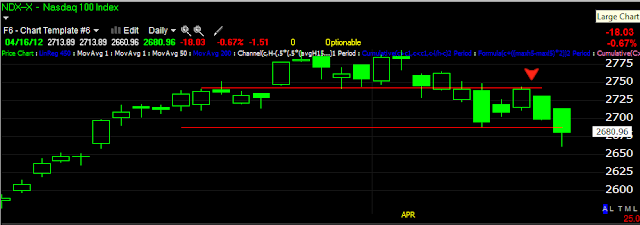
 For today, the NASDAQ 100 breaking above the lower resistance line would be a decent achievement.

 The SPX is holding its own, not yet threatening the resistance area that would be the obvious target to run a good shakeout, this is all part of the increased volatility as market structure is very asymmetrical today.
 The $USD weakness, depicted by using the inverse Euro in blue is offering the market quite a bit of room, the Dow has taken advantage of that, the SPX/NDX, not so much yet. Commodities are way off right now from the typical dollar correlation. I read this as trouble in China.

 Credit is holding up fairly well, it's certainly not diverging extremely negatively as we have seen in the past at a turning point which can develop within an hour.

 Yields are lagging, I would expect to see this, weakness in underlying markets, in effect, any bounce has underlying weak character, despite what volatility may come on the upside.

 The $AUD is somewhat supportive of the market moving higher, not to the same degree as dollar weakness after today's European close.

 HY Corp. Credit continues to move higher, this in my view reflects an environment in which the bounce still has breathing room.

 Today's sector rotation has been strong in Industrials (look at the Dow), interestingly the defensive sectors are fading a bit as well as financials.

 In afternoon trade you can see financials fading off more acutely, Industrials are fading, Tech is starting rotation in as well as discretionary, this is a small change thus far, but indicative of a bit of risk appetite and the sector rotation toward Tech.

 Here Financials have held good momentum all day, they are starting to see that peel away.

Tech has been largely lateral, but as Financials start to peel away, Tech is showing some signs of life, not impressive yet, but changes in character lead to changes in trends.

 Short term 2 min DIA is starting to leak off

 The negative divergence starting in the Dow hasn't reached the 5 min chart which is at best in line or trend confirmation, note the difference between the DIA and the Q's coming up.

 QQQ 2 min is starting to fly in a strong leading positive divergence, you can see Tech starting to see price movement from this divergence.

 The 5 min chart has been running up all day and is now in its most solid position in days.

 SPY 2 min is mostly in line.

The 5 min is pretty strong, it still appears Tech will take up leadership shortly.

I'm staying patient here, but I may consider looking at some of the large caps like XOM, which is only $.40 from our initial target area. I am thinking about phasing in to some sectors that start moving out of rotation as that becomes more clear.