Wednesday, December 1, 2010

Nightly Wrap

Tuesday and Tuesday night I mentioned in several different contexts that the market looked like it could bounce based on holding support for two days, tweezers bottom candlestick patterns n the averages and finally last night's price volume relationship being heavily skewed at Price down volume up, a dominant relationship over 2x greater then then next relationship of 4 indicating an oversold condition. I also mentioned the blackbox pattern recognition programs and the fact we had a near perfect rectangle and in the past we've seen a lot of false or manipulated moves around these patterns. So the conditions were right and Chinese economic data coming in stronger then expected got the European markets bid up as well as some good economic data out of the Euro zone (it was mixed as well, but sentiment clearly was ready for a bounce). All of this raised the US Futures market as we saw wit the gap up in the a.m.

The 3 charts of the averages below all show a fairly common occurrence when a channel is broken, it's akin to a support level broken and retested, it called "kissing the channel goodbye"
 DIA daily

 QQQQ daily

SPY Daily

3C did not confirm the trends higher today as it remained well below where it should have been to confirm the trends.

 DIA 1 min

 DIA 30 min barely lifted

 QQQQ 1 min

 QQQQ 30 min did not lift-for a move of this magnitude, these should have lifted much higher

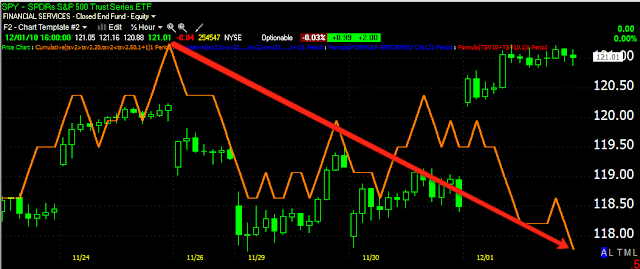
 SPY 1 min

SPY 30 min initially lifted and headed lower throughout the day

 GLD 1 min lost ground in the afternoon in a leading negative divergence.

 SLV 1 min looked better toward the end of the day

 However, the 10 min chart continued lower. A simple interpretation of what these two charts suggest would be early strength in SLV that fades.

 USO 1 min failed to confirm as well today

The 15 min USO which shows accumulation in white is why we had the bounce trade in USO, as it moved higher, you can see it's now in a leading negative divergence

 While I didn't look at every inverse/bear trade, several I looked at showed some surprising strength- here's EDZ short on emerging markets seeing late day accumulation and the start of a move up.


 FAZ's 3C lifted eve into lower prices EOD

and the short on the China 25 showed an impressive leading divergence in the afternoon.

Today the news was scattered and strange. First the arrest warrant for Jullian Assange from Wikileaks after it has been widely believed the US Bank that was next on the leak list was BAC, due to him giving an interview several months ago in a computer magazine saying so. An Arrest warrant came out, followed by their server dumping them, they jumped on the amazon server to have the US government pressure Amazon to dump them. It seems they are back up now in Sweden. Whatever this BAC thing is, it seems serious.

Then the news the US would help bailout Europe lifted the market followed shortly thereafter by a denial in the Wall Street Journal, saying no such talks are in progress.

All in all from the charts above, it looks like today was a bounce that was sold into.

The Asian markets have opened strong a second day, however the big event for Europe tomorrow and probably the US as well will be what comes out of the European Central Bank which is expected to announce a bond buying program to stabilize Europe. What is said and how it is taken will largely dictate tomorrow's trade I would think. There may be some early hits in the FX markets. 

Requested Chart Example

Yesterday during the day, I mentioned the possibility of a bounce. I posted a few charts showing a possible "Tweezers Bottom" which is a candlestick pattern for a short term reversal. Then last night talked about the overwhelming price/volume relationship which was price down and volume up and 2X greater then the next largest relationship and how a overwhelming relationship like that ca produce an oversold condition. I talked about thinking about some longs, but decided against it because I myself would not have bought them, which I think was the right decision based on the fact that most of the gain came by way of a gap, so there wasn't much to profit from.

I any case, the request was for a similar situation to what we are currently in as I said this is one of the worst negative leading divergences I've seen since 2007-2008.

Here is the 2007 top which is remarkably similar to what we see now, more similar then I thought I would find.

To many of you this may look like the daily SPY charts I post every night, however it is not, it is 2007. Similar to 2007, we had early warning of a bounce, you can see that in August as price makes a new low and 3C a higher low-coincidentally it was the end of August when we saw the accumulation that lead to this last rally. Much like now, 3C refused to confirm higher highs and at the top went into a leading downside divergence.

Here is the current chart for comparison.

Here's what happened the next day on from the first chart above in 2007
The market started trending lower, but along the way they were several bounces. This is where trade management and commitment come into play. Anyone of those bounces that lasted a week to two weeks could have made you feel like the decline is over, you only know what you know at the time. This is why I say "try not to get too caught up in the daily gyrations of the market."

 The area in the red box is the same timeframe as the first chart above showing the negative leading divergence, or the top of the market's rally. The decline from there was 55%. In individual stocks it would have been 2-3X that as well as leveraged ETFs.

Keeping your eye on the bigger picture. For most people, including myself, I rely on an objective indicator so when a 1 or 2 week rally/bounce occurs, I'm not scared out of my position. The Trend Channel held the entire decline, not even one false signal. By early 2009 there were already signs of accumulation so your exact exit point would be difficult to pinpoint, using the channel it will never be at the very bottom, but as I said, there were signs the decline was coming to an end early in 2009.

Hopefully this comparison sheds some light on 3C and on the importance of an objective system to keep emotions out of the trade as well as illustrating, nothing goes straight up or down, there are always corrections, even in the best and most reliable trends.

DIA update

In the last post, the DIA looked the best, it is now deteriorating more in line with the SPY/QQQQ

UPDATE


DIA 1 min

DIA 5 min

 QQQQ 1 min

 QQQQ 5 min

SPY 1 min

 SPY 5 min


 SPY DAILY

Update of Today's Issues Thus Far


Chinese PMI comes in stronger then expected

The Chinese surprise PMI is credited with lifting the European markets and that had obviously overflowed into the US futures. A rise in US consumer confidence certainly didn't hurt the market being bid up as well as speculation that the European Central Bank may engage in outright purchases supporting the markets. Key phrase here is “rumor” but rumor is enough.

As mentioned in last night's post, the contagion risks can be judged by European bond sales and the yeild they command. Today Portugal held a bond auction, the anticipated yeild was 5%, it came in worse at 5.281%. The last auction came in at 4.813% These are the rising costs that led to speculation of a bailout and eventually most probably a bailout will be needed as the borrowing costs start to exceed what the country can afford to repay. However spreads have tightened on the rumor of an ECB QE program that may be announced tomorrow.

Here's how fast and out of control borrowing rates can get, this is Ireland's 10 year note.
IRELAND1


Employment data from Challenger and ADP were at odds with each other. Challenger seeing an increase in layoffs, while ADP came in at +93k vs expectations of +70k.
However, ADP's estimates have had a track record of being significantly off the mark.

European economic data today was throughly “MIXED”. There's so much I can't list it al, but for every positive there as a negative. I'll lok through it more closely for any country specific trends.

The U.S. ISM Manufacturing number came in as expected at 56.6 (expected 56.5) however the whisper number was said to be 60. The concept of the whisper number is a private number that Wall Street expects, but it s not the same as which is released by analysts. Usually when you hear about “the whisper number” it pertains to earnings, thus companies that beat are often sold off as they didn't make the whisper number. The current reading is a decrease from October at 56.9.


More breaking news:
"US official says US would be ready to back larger European financial stability fund via increased IMF commitments."
Here's what happened with the Euro/Market


More Coming, in the meantime something just spooked the market. Perhaps something was found in the Fed lending release.
 Dow-30

 QQQQ

SPY

Afternoon Update

 DIA

 GLD

 QQQQ

 SLV

 SPY


USO

Commods

 GLD
 SLV
USO

I usually don't get to worked up about after and premarket trading, the first hour -hour and a half of the trading day also is not always that insightful as a lot of the action is designed to tae advantage of retail limit orders set before people head off to work.

Thus far it looks like a fade will set in early, but the underlying action through the rest of the day will hold the real insight. As far as I know, this is being hailed as a rally born of good numbers out of China, but as I mentioned several times during the trading day yesterday and last night, we're in a pretty god position for an oversold bounce and last night's 2:1 Price volume relationship of Prices down and volume up is more often then not a sign of a short term oversold market.

If you read toward the bottom, I mentioned to watch the European debt auctions, I'll get into that later, but there were some pretty nasty occurrences. The ADP employment number has been notoriously way off base and it contradicts the earlier Challenger employment number, but in a bounce situation, the market is going to bounce-th pundits will ascribe the reasons why, which more then not, have nothing to do with the situation.

An Early Look

 DIA 1 min

 QQQQ 1 min

SPY 1 min

So far the gap up looks like it's going to faded.