Wednesday, May 22, 2013

Key Reversal Day

It's only after that things make sense, that's the way when you can see what smart money is doing, but aren't exactly sure why, although I dare say we've been as close for a much longer time than anyone I've read and certainly much better than CNBC who literally changed their tune from Bulls on parade to the party is ending, but only after watching the market. It is stunning that these people have no real idea what is happening in the market or they're purposefully filling millions of people's heads with subterfuge.

I'm not going to make the entire case for all of the analysis here that suggested the F_E_D was boing to back out of assets sooner than later 9while even the most cynical perma-bear website argued the F_E_D can never back out of QE as recently as this morning).

I'm just going to go over the bullet points of what I have been calling the F_E_D's "Slow boiling the frog" to their exit.


  • September 13th 2012 the F_O_M_C announces QE3, however at 2:24 p.m. during Bernie's press conference, when asked what the F_E_D would do if inflation reared its head, Bernie said they "could adjust the pace of asset purchases" (paraphrased). This was the first shot, the market topped at that very moment after having a knee jerk move higher on QE3 being hauled out.


What became obvious was for the first time, the F_E_D was not giving the market absolute certainty.


  • Next the F_E_D contemplated changing the yardstick and suggested that they may change the way they analyze QE, for the first time suggesting they may move away from calendar dates (which are about as certain as you get) and toward a model based on the economic conditions.
  • Next the F_E_D did EXACTLY that, this is all part of Bernie's "guidance" for the market, but the market either didn't care or wasn't paying attention. This removed the hard dates that Wall St. could count on, "ZIRP will last this long, QE will be this big and last this long". If there's one thing the market hates, it's uncertainty, ESPECIALLY WHEN ASETS ARE THIS MARKED UP BEYOND REASONABLE VALUE.
EXAMPLE:
Compare bull market 2003-2007 to 2009-present.

In the first market volume was rising as it should for a healthy market, there was no asset purchases holding the market up, in fact consumer spending was strong because of housing values and almost entirely held the market up. Unemployment was low, there was no US sovereign Credit rating downgrade, there was no European, Chinese or worldwide recessions, unemployment was low and inflation was right at the F_E_D's comfort zone.

In the second market, it was entirely fueled by the F_E_D creating money out of thin air, savers were punished as their savings lost buying power, inflation was rampant causing manufacturing and other margin squeezes so bad it was killing earnings, gasoline hit all-time highs, The Debt Ceiling, the Sequestration and the F_E_D's perception (and reality) that Congress hasn't made structural reforms and is the most divided Congress in recent memory, The F_E_D's antidote to too much debt is creating more debt,  unemployment has stubbornly persisted, consumer spending is nothing like the last bull, millions of homes have been foreclosed on, banks have become even larger and less stable (Too Big to Fail), Economic data has went down the tubes- not only in the US, but worldwide, we have recessions across the world, we have banking and sovereign country failures, on and on and on -and volume is falling. Everything is dependent on the F_E_D devaluing the $USD and buying our debt that China no longer wants.

Can you honestly say that asset/market valuations at all time highs are reasonable given economic conditions here and world-wide vs the prices seen during the first bull market that did not end well, but was very healthy while it was running? Perhaps now you can see why years of accumulated shares may have taken several quarters to be distributed and shorts set up.

I Digress...
  • The F_E_D then started hinting that they may have to look at the size and scope of the current asset purchase program, the market kept whistling past the graveyard.
  • F_O_M_C meetings took on a surreal quality, "We may but more, we may buy less" with no press conference to explain.
  • Hilsenrath, the unofficial mouthpiece of the F_E_D from the WSJ (If you don't believe me, tell me how he analyzed the minutes and typed this pice precisely 3 minutes after the release of the minutes?) made the case on a Friday after the market closed that trimming of QE was coming. The market still ignored.
  • I think we knew a long time ago, in fact I started making the case September 13th, the F_E_D realized they had a huge balance sheet that would be painful for the market and economy to unwind and they weren't getting any tangible results from asset purchases other than blowing asset bubbles. If you think this market is not a bubble, please email me and explain why, keeping in mind the last bull market's conditions vs this one's.
So what spooked the market today?
Maybe the fact the F_E_D speakers (5 this week so far) sounded very much out of character, some sounded downright afraid and some admitted they were afraid. Ex-F_E_D governor, Kevin Warsh gave us the F_E_D's problem last September, "QE is easy to get in to, exiting policy accommodation has always been the painful part" and we have unprecedented policy accommodation, not even the F_E_D knew what to expect because if they did, we would never have seen QE2, they expected a rebound long ago.

Some suggest it was the disconnect between what Bernanke said this morning and the other F_E_D speakers and more importantly, the lack of consistiency between his prepared comments and the Q&A portion of his testimony today and most importantly the disconnect between everything Bernanke said today vs. what the actual F_O_M_C minutes said. As I said this morning, the minutes will have the most credibility.

Or...
 
 “A number of participants expressed willingness to adjust the flow of purchases downward as early as the June meeting"


Perhaps it was F_O_M_C members going on record in the minutes, saying they were concerned about the bubbles in US Financial (stock) markets (paraphrased). More dangerously for the QE IV-dripped market may have been this... 

"One participant cautioned that the emergence of financial imbalances could prove difficult for regulators to identify and address, and that it would be appropriate to adjust monetary policy to help guard against risks to financial stability."

 Essentially for the first time ever, an F_O_M_C member went on record saying the F_E_D was intentionally creating assets bubbles, which up until the April meeting had been a cost/analysis benefit as described by Bernie himself in Congressional testimony, "The Russell 2000's gains are creating a wealth effect" LOL! For the banks maybe, that volume isn't declining since 2009 because more retail is coming in to the market with their 401k's and IRAs.  

I can almost guarantee who this member was, none other than QE critic, Richard Fisher.

Perhaps it was all of it. Does it matter?

What we saw today was the best example of a "1-Day Key Reversal".
The fact the market hit an all time new high today makes the 1-Day Key Reversal even more Picture Perfect. The day should close below the lows of the previous day. We also call these "Outside days" and sometimes "Bearish Engulfing Candles", but this is more specific and more damning.

A little Factoids for you...

The S&P and NYSE saw the highest volume in a month, something which fits well with a Key Reversal Day.

The Dow was up 155 points today, then closed down 80 points, losing 235 points from the high with the Dow and SPX both hitting all time new intraday highs, before giving it all back and then some (again perfect Key Reversal Day). The NASDAQ hit a 12.5 year high and saw the worst close in a month on the same day.

High Yield Corporate Credit, HYG, saw it's biggest decline from intraday highs in 6 months and as the market starts to see more "real supply/demand or rather Fear/Greed", as I have mentioned, we are seeing some of the first real technical patterns in years based on actual fear and demand. For instance, HYG's flag was manipulated to help the SPX last week, I've proven that much to you, today's move is the first real flag pattern I've seen based on real trading supply/demand (as noted recently, we have seen this in TLT and VXX).
A true bear flag? It could have been even worse if HYG wasn't accumulated 5/13-5/15!


I like this one...

The last two times the S&P 500 hit all-time high and closed down more than 1% from that high were 10/11/07 & 3/24/00
That's a fact!

As for longer term divergences, I don't show these charts often because people have a hard time believing them, but perhaps some attitudes are more willing to consider the data and the concept of "Reversion to the mean"

You already know about the Macro0data which I recently said will be more and more important.

 US macro going to pot as soon as the seasonal adjustment period is over just like the last several years.

I showed you this last night, Dr. Lumber vs the SPX as the new leading indicator replacing "Dr. Copper"- not that copper isn't negative as well...

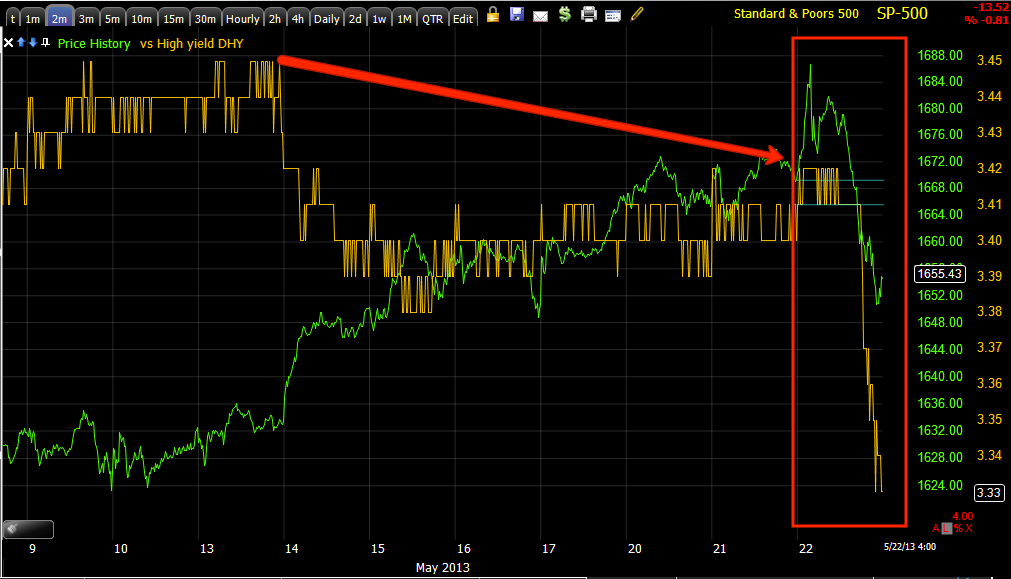
Yields and the market have always shared a relationship in which they move together, I don't think, "This time it's different", I believe in "reversion to the mean".
SPX (green) vs. Yields (red)


You know about channel busters...

That's quite an ES retracement and on volume...

Russell 2000 Futures are even worse, this is what I was warning about in going long when you know there are so many red-flags. This is just a warm-up, but we can easily lose a month's gains with a single gap opening.
TF put in the high and low for the time period today and on volume.

How about the $USDX?
That's another breakout new high for the $USD. As I said and as we are now seeing more frequently intraday, "The market can't ignore the $USD forever"

Some may not agree the Yen/SPX correlation is quickly becoming one of the most important now that the Euro and AUD have failed, the $USD is important and increasingly so too.

It's hard to argue with the reversal areas today.

I noted several changes yesterday afternoon, the reach for protection in VIX futures was one of many...

Of course you remember the VIX Bollinger Band Squeeze that I thought, well it's well known, it tends to create a highly directional move-interestingly it's tight ranges as well where we see accumulation and distribution, perhaps the Bollinger Band concept now has a literal reason why it works...

We noticed this a few days ago, also noticed it's been getting tighter than the last two squeezes (remember the market and VIX move opposite each other).

I already showed you the stop run on TLT and reminded you that a head fake move is often the last thing we see before a reversal, this afternoon after that stop run that saw the highest volume of at least this year, we saw accumulation in to the afternoon flat trading range, where we often see accumulation. Apply Bollinger Bands to TLT in the right timeframe and you'll see them pinching as well.
This led to two positions opened today, TBT Puts and TLT Calls.

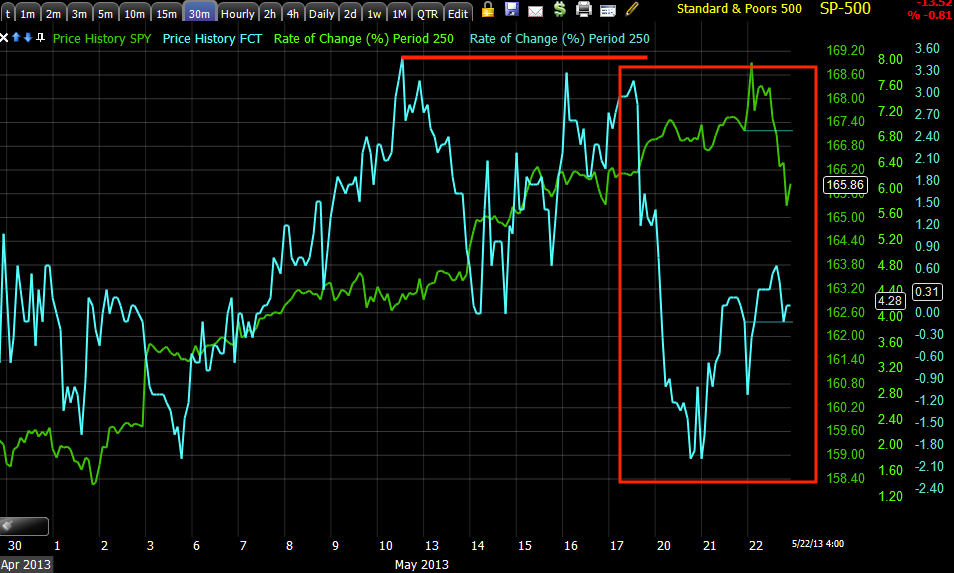
Then there was this which we already knew about, FCT as a sentiment indicator vs. the SPX...

As for credit, High Yield just dumped today after having gone negative last week.
 Look at that loss i HY Credit today, it did warn before, but sometimes we don't pay attention to obvious warnings until we are smashed over the head with them.

This is ES vs. HYG, HY and IG Credit.

 Spepaking of the VERY liquid HYG (HY Corp. Credit), it took an absolute beating today.

I wondered if HYG would bounce at support of the flag, it sliced right through, but that's what I'd expect before a bounce any way as a head fake move, even for a silly bounce from here-the stops have to be hit.

I do expect some bouncing, probably tomorrow. I'd guess there will be some sellers who came home from work to this mess tonight putting in orders to sell on the open, we did see the divergences starting, but as I said, this is emotional warfare, the market will want to shake off any new shorts, they aren't getting a free ride that easy.

The SPY divergence isn't that impressive and even if it builds, if can't compare with the damage done today.

 SPY 2 min slight positive at the close

SPY 5 min damage today

The QQQ 1 min looks a lot better and may make a nice move, but you have to remember these charts when you think about selling short in to any price strength...

QQQ 5 min

 IWM 3 min really looks as if it could bounce, but again, remember...

IWM 15 min is over the cliff and the long term damage is already there and done, one of the reasons I think Wall St. has been selling in to this move the entire time.

Look at the 60 min chart, it may seem unreasonable in the negative divegrences, but remember where market breadth went south, right in this same area, more stocks were moving down than up-that takes distribution.

As for futures tonight, I'm not making any predictions, but thus far NQ and TF don't look very good.

In Japan tonight, on the open JGB (bonds) futures were halted right on the open as they dropped to 2-year lows, if you don't recall, this was to be one of the signs that the BOJ's aggressive QE failed.

We'll play the set ups sent our way, I think we have a few good ones today, we'll be looking for more.

Closed IWM Put / VXX Calls today

Today's IWM Put that was closed and VXX Calls that were closed were both closed for the same reason, a market bounce, but today was what is known as a "Key Reversal Day" and that's not good for the market.  However as I have said 100 times and 101 today, the Street isn't going to make this an easy, "Kumbaya, lets all make money together". 

The "Trendy Trader" right now is called a momentum trader and today we pulled a momentum stunt in closing IWM puts as they were falling like a rock and VXX calls as they were shooting up, it doesn't make a lot of sense does it? You'd think, "This trade is working, why exit?"

The reason is simple, Wall St. isn't going to allow momentum chasers who got in today on the short side to hang around. Those who bought the dip are going to feel like geniuses tomorrow, we bought some dips today with GLD and USO, but note I said these are likely going to be short term trades, especially in the case of USO which has bigger problems than Gold, although a price chart alone won't tell you that.

So options are worth their most when there's momentum and I always want to get out before that momentum fades. Tomorrow, even if we get higher VXX prices and lower IWM prices, chances are, the P/L exiting today was a lot better because of the momentum. You can't look at options the same way as stocks.

So here's where we ended up... Earlier I said both of these were entered yesterday, in fact they were entered the day before,  Monday.


The IWM P/L came out to a +49% gain


The VXX P/L came out to a 35.8% gain

This is a bit ironic because I just said yesterday that we'll be getting back to more guerilla hit and run tactics with options. 

It was just early May that we had 10 option trades in 2 days alone with double digit gains of +42%, +59.5%, +36.8%, +86%, +53% and +.73% and only 1 loser of -7%.

This market has been VERY extreme, more so than I can remember in quite some time, now we know why, actually we've known why and have been building the case the F_E_D was moving toward this since September 13th so it comes as no surprise to me and shouldn't to you if you've been following.

As I have been saying, the market in my view has been expecting this since at least September when I started to suspect it, I've pointed out numerous times that the large base in the $USD coincided with the September meeting in which they started changing the yardstick so they could exit earlier.

If QE sends the $USD lower, what would cause smart money to accumulate the $USD? Did you see $USDX futures today? They hit a low and a high of the week as the market declined-I'll talk more about that later.

Here's the base in the $USDX, the start of accumulation lines up with the September meeting in which they announced QE3, but more importantly, they changed the yard stick which was the first clue they were already planning their escape route and every meeting since then they have advanced that agenda. The base above I believe bears this out that smart money feels the same way, why else would the $USD be building a base and just breaking out just before today's news? QE on= Dollar down, QE off= Dollar reverting back to the mean on the upside.

We are definitely on the right track, as mentioned earlier, not as bragging rights- this is truly educational to show sentiment, but to show on the biggest day of the year, we were positioned correctly as our options tracking portfolio went to #9 of 709 competing portfolios and these are small positions, not swinging for the fences like most option traders do, it's also a tracking portfolio to track all positions, obviously I'd never be able to trade all these positions.  

 This is pretty much a 1-day return of 15%.

This is the rank for the week.

The point being, most people went in to today positioned totally wrong, we saw this yesterday in our sentiment update. We've seen the signs, we've seen the signals, it's been an extreme market and we know why now, Wall Street knew what the catalyst was and was going to sell and sell short right up until the catalyst, we can see them doing that, but we didn't know what or more appropriately, when the catalyst would be, although with the size and pace of distribution that is close to Dow 1929 levels, it was telling us pretty clearly it wasn't going to be good and it couldn't be too much further away. I will tell you, I've never seen a market this extreme before and I think our options performance previously and at the beginning of May bears that out with 90% winners in options where 90% of contracts expire worthless.


I/we have some other open positions that I'm sticking with, especially the June, I believe there's an IWM, SPY and XLF for this week, where they are now I'm just leaving those open because when the market gets to the position its in now, things get very unpredictable and I'd rather just leave those open than take crumbs. The rest of the positions are monthly June, actually the bulk of them.

I always post the open and close of positions and try to do it before the positions are placed in the tracking portfolios, but if I don't place a closing report on options expiring on that day, it's because they are worthless and there's no point in me wasting my time closing a worthless option when there's nothing productive at all about it.

I did have to go back and search around for these for a while, but the positions that closed worthless last week were XLK$125 puts for approx. a -$2268 loss, QQQ 74 puts for a -$4250 loss and IWM $97 Puts for a larger than normal $7880 loss. I usually try to keep these around 5% of portfolio or about $5k unless I feel very strongly about them or more often, get a positioning that I think looks great. The new website that is being built (which I can proudly say thank you as we are at capacity for the GOOGLE hosted site now-we only have 2 spots open for new members after which point I'll have to refund new members signing up until we have the new site up, as GOOGLE just won't allow any more for the hosting we use) will track these positions and make it easy for you to track them as well. As well as many other member upgrades, I may even add a surprise.

Now that we are through the extremes of this market (for the most part) and like I said, I've never seen a market this extreme simply because I don't think there ever has been one. We have unprecedented F_E_D intervention for an unprecedented period of time, but I believe we are over the hump. 

I have a lot to share with you, but it's mostly things I've been showing you every day and I REALLY need a rest (even for just a night) after digging through this market so extensively this year. I will touch on the important topics and some strategies, maybe even a few new tools.

Talk to you soon...


USO Charts

Here's the reason for the Call and the reason I want to keep SCO open as a longer term trade as always intended, you can certainly take profits on SCO and re-enter.
 Intraday USO positive as the trigger...

 The 5 min is the reason

This 15 min shows the longer term, USO will be heading to lower lows after this bounce.

I'd even go for a June USO Call Here- a short term trade

This will more than hedge SCO and I think is worth the chance right now.

GLD Charts

Where GLD ends up short term after this call position,, I don't know, we'll have to follow the charts, but I do think it will make a big move, this may be part of it or we may come back down to base some more.

Here are the charts for the current GLD call just mentioned, this could be a very quick trade, we'll let the market tell us, but looks great for a call position.

 The 2 min chart moving is just a trigger for me, the real reason for the trade is below...

5 min leading positive, that's a LOT of accumulation today alone.

I'd take profits on any USO Calls- SCO for me stays open

Went With Spec. June monthly $130 call

I think GLD long works-Short term

I'd probably want calls, this may only be a trade lasting a day or so, I'd keep it at a speculative size, but I think I'll try it.

I'll let you know.

Quick Market Update

It looks like they are having one heck of a time getting a bounce-able bottom in place, but the divergences are building, just understand that if we get a closing ramp or more likely a gap up in the a.m. by manipulating the overnight, thin volume futures market, this is psychological warfare, they want to knock these new shorts off the move, just keep referring to the longer term charts and look at any bounces as gifts that allow you to get good, low risk, high probability positioning.

The chance of a waterfall breakdown still exists higher than ever now, margin calls will be rolling in, longs will be scared, the F_O_M_C minutes proved to be everything I thought they'd be and more.

AAPL June 445 PUTS

I was considering closing these, just because the Q's will need AAPL to muster some strength for a shakeout of the shorts and AAPL has some short term positives, but I think there's plenty of time on the Puts which are in the green and I don't yet have the full AAPL position size in the equity short I'd like so I decided to leave these open.

 The short term AAPL view at 1 min with a slight positive, it will probably get bigger and bounce a bit.

The more important 10 min negative.

In this situation with a short term 1 min positive and a longer term 10 min negative, unless there's a change in the 3C trend, which there's not, the way I want to play this is look for AAPL strength to sell short in to or buy puts, since I already have puts and enough time, I'll leave them for now.

***When a market gets to volatility like this, there's always the chance of margin calls hitting hard as I showed from our member who updates sentiment, 

"The twittertards are all long, even citing TLT as a reason, even the bears are long".

These margin calls can force selling and we can have a waterfall break-we may very well get one.

For now, I w ant to deal with what I can see and know.


Other Option Positions

I have others, I believe even some for this week that have gained significantly, I believe for the most part, unless I call them out, I'll leave them in place, these two positions though had a lot of momentum and volatility in the premium and I wanted to capture those profits.

Closing June VXX 18 call

I still have representation here, I'll look for a lower place to enter, don't want to lose the momentum

Closing June monthly IWM $100 Put from yesterday I believe

Will reopen, taking this momentum though

Market Update and Tactics

There are positives in the SPY, QQQ and barely in the IWM, but more importantly the SPY arbitrage assets or levers are seeing intraday (1 min mostly) divergences to send HYG up, TLT and VXX down which is bullish manipulation to help the market.

Please remember what I have said all along, "Wall Street isn't going to make this easy". If you are a new short coming in to the market thinking you are going to ride the gravy train because price moved down, you're in for a surprise, Wall St. can't make money with the herd all following price, they will try to shake them out, stop out new shorts chasing price today. Be prepared, but as I've shown, the longer term charts show this market looks broken beyond repair.

I'd be looking at any counter trend bounces (and again they'll have to be strong and move emotions to shake shorts lose after the market lost the gains it had earlier and then plunged, that's bad action for the market.

I'd look at using any price strength to fill out existing positions and  enter new ones. Your emotions are the best reverse indicator you have right now.

I'll keep an eye on how things progress and where opportunities are because, WE NEVER WANT TO CHASE-WATCH WHAT HAPPENS TO THOSE WHO CHASED.


VXX Charts

I've had a lot of experience with 3C so I have a lot of trust in it, I will say I've never seen a market this extreme, but I think that just speaks to how important of a crossroads we are at right now. I've learned although it can be hard, to trust the divergences, we can see what they are doing, but we don't know why or for how long, these are extremely large divergences, meaning there must be an extremely large move coming that we are for the most part, well positioned for.

It's always in retrospect that things look easy.


Anyone remember what I've been saying about this VIX chart the last week or so?
The Daily VIX and Bollinger Band Squeeze, just last night-and for the last 3-4 days I've been saying it should lead to a highly directional move and I doubt it will be down. Today looks to be the start of that move.


The VIX Futures... (Longs in VXX and UVXY as well as some calls)


 1 min looks to see a pullback as stocks look like they'll see an intraday bounce, but I think the damage to the market is done, I think it started September 13th 2012.

 2 min in line, no negative

3 min

3 min trend

5 min trend

10 min trend

30 min trend

Even a 4 hour leading positive, I don't think the market can come back from this.