Monday, May 21, 2012

ES 4 p.m. ending action

While ES will trade overnight, here's a look at how powerful the move in ES was today (as well as the broad market: SPX +1.60%; NDX +2.68%; Dow-30 +1.09% and still the laggard as 3C has been suggesting for well over a week; R2K +2.32% and finally AAPL +5.83% confirming the last move higher in the market would be led by tech and specifically AAPL, this is a great move higher for AAPL)

 As you have seen, ES was in a positive divergence pre-market and added to that on the opening dip to the intraday lows where 3C went positive again on heavier volume. We saw confirmation throughout the day except for a brief period in which the Euro was pulling back. I think because the market was rallying ahead of the FX implied correlation on an intraday basis (the FX implied correlation over the last week has been much more positive) I think short sellers came in to the market expecting today to be a failed attempt to bounce off an oversold condition. As the charts have been showing, this does not strike me as an oversold bounce at all, but rather a cycle that has been planned, has been under accumulation for some time and we also see that in the Risk Asset Layout leading indicators. In other words while most traders view this as an oversold correction, the information we have is that this has been planned and under accumulation before the market reached an oversold condition. It now appears that the market was waiting for OP-EX to end and with the heavy Put open interest, I'd say 1 of 2 things, either Wall Street was counting on those puts to be exercised or (although it would be rare) Wall Street was the owner of those puts, which is much more complicated subject being retail wouldn't be the ones writing them, I lean more toward the second option.

 During normal market hours there was that final positive divergence/accumulation at the ES intraday lows, confirmation, a brief dip in 3C based on the Euro pullback (however the market broke with the correlation on the pullback and stayed positive as it was only an intraday pullback that didn't do any technical damage to the Euro) and finally 3C shows that there was aggressive support (probably some short covering) that sent 3C in to confirmation of ES's intraday highs.

Looking at ES's VWAP, the only break below VWAP was at the 3C positive divergence and volume picked up there, it appears institutional money was soaking up shares on this move below VWAP which represents value. The rest of the day ES walked the upper standard deviation of VWAP in a very impressive show of strength.

Finally her's ES with some Bollinger Bands, whenever an index walks the upper band, it is a very strong show of momentum, the only sticky area was the Euro pullback.

As you can also see, there's a definitive change in character in the SPY/SPX
 The SPY's downside momentum is obvious as the SPY was walking the lower BB's, it's now moving toward walking the upper BBs on a 15 min chart, next target the 30 min and 60 min and maybe we even hit the daily.

Downside momentum as SPY walked the lower BB's and now moving toward the upper Bollinger Bands on a 30 min chart.

Thus far I'm very happy with how things are developing starting with the Euro changes in character in 3C which led to price changes as downside momentum gave out and the Euro formed a base which should be able to support the impressive kind of move I have suspected for some time we would see before the next and very dangerous leg down.


Still holding GOOG Short

 GOOG head fake move and where GOOG was shorted...

 The 1 min chart showing a negative divergence in GOOG as I hoped it would.

5 min also negative.

If I need to close GOOG I can do so at no loss or a very small one, right now I'm hoping GOOG will not see the relative strength the market often provides in a move up

Euro Update

The Euro was a little touch and go today, but when in doubt, I stick with the longer trends that have less noise.

 The Euro 1 min saw some distribution just before it started to decline intraday 1 min, look at the leading positive / confirmation since...

 The 15 min chart went from a change in character to a full on 15 min leading positive divergence, something was up.

For comparison, here's the $USD 15 min leading negative, this is all very market positive in the near term, I of course remain bearish on the longer term.

BIDU Update

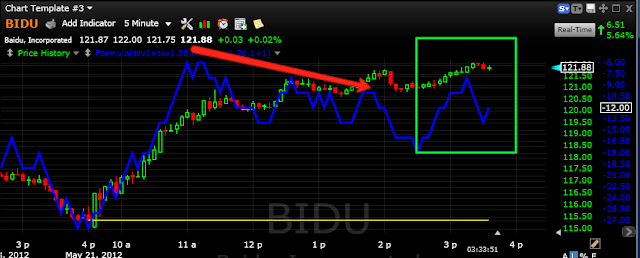
This is one of the shorts we stalked on a head fake move, were patient with and got excellent positioning, very low risk and high probability.

I've been hoping for a move higher in BIDU to short in to so I can add the rest of the intended position, it is performing beautifully today.

 PATIENCE PAYS, AT LEAST WHEN YOU HAVE AN EDGE! BIDU was looking like it was going to make a head fake breakout, the longer term underlying action was very negative so this breakout higher was a golden opportunity to short BIDU in to price strength and the trade has worked exactly as planned. We waited for the breakout which was a head fake move in the orange box and shorted BIDU in that area. Since then it's fallen quite a bit, I'm holding my short there for reasons explained last night, but would love a chance to fill out the short position in to strength. BIDU is up almost 6% today. The two areas I'm looking at to add are in yellow, the higher area is a gap that is unfilled, that would be the ideal spot.

 BIDU 1 min saw some weakness with the rest of the market in 3C as I believe retail has been shorting heavy in to today's move, that will only add more upside momentum in a short squeeze, since like the rest of the market, BIDU has clawed back up in to confirmation.

 The damage from earlier that reached the 5 min chart is starting to be repaired and BIDU looks good for more upside.

 The 15 min chart in BIDU today (reflecting institutional activity (retail action never reaches this far out) is not only in a positive divergence from the lows, but in total confirmation.

Even the 30 min chart has shown the accumulation in BIDU that is in part powering this move today, note the large positive divergence, like I said, it takes time and this divergence is nearly leading in the near term.

Be patient, let this one come to you.


ES Update-Fast moving market

Just a few minutes ago I said 3C needed to break above the 3C intraday high as it was moving in confirmation, it just confirmed on a daily basis by breaking out above the intraday high, it has moved up quite fast.

This looks very good for the bounce move.

Here's the reason for the change in character.

At the last update the Euro was heading down, pressuring the market, the Euro has now broken out through another level of resistance giving the market more support.

ES Update

ES is also seeing some improvement

 ES overall chart for the day, it's trying to move back in to confirmation, which is impressive on today's gains.

A closer look since the 1:45 negative divergence, ES built a small positive and is moving higher in confirmation, it needs to see 3C move above the highest high on the chart, but this is an improvement.

Support building back in

I suspected the early timeframes were seeing a lot of retail selling on strength, there's signs of support building back in and the 15 min charts are getting very positive, reflecting action beyond retail.

 IWM 5 min seeing a leading positive divergence on an already strong day

 IWM 15 min leading positive intraday

 IWM 1 min has managed to stay in line.

 QQQ 1 min picking some momentum back up

The Q's looked the worst on the short time frames, this 15 min intraday positive is encouraging for a bounce.

Market Update

The Euro has been pulling back since about 12:30 or so. The market has been moving up against the Euro intraday correlation and thus it seems to be getting frothy in the area.


 The Dow is showing a similar divergence (negative) recently to that of ES.

 It looks worse on a longer time frame, it looks like a decent pullback, however this certainly could be overwhelming retail selling in to strength today.

 The IWM 1 min shows almost exactly the same thing as ES a negative divergence around the 1:45 high.

 The 5 min chart looks worse as if there's going to be a fairly deep pullback/correction.

 QQQ 1 min looks the worst, negatively divergent at the same area.

 And the 5 min looks the worst here as well.

 SPY 1 min looks exactly the same as ES

The 5 min shows a couple of accumulation areas, but the position of 3C is lower than it should be for confirmation.


ES Update

 ES positive divergence both pre-market and in to the open, since it has been in confirmation with 3C moving higher with price, at the 1:45 highs, there's a small negative divergence, this may just lead to a consolidative pullback.

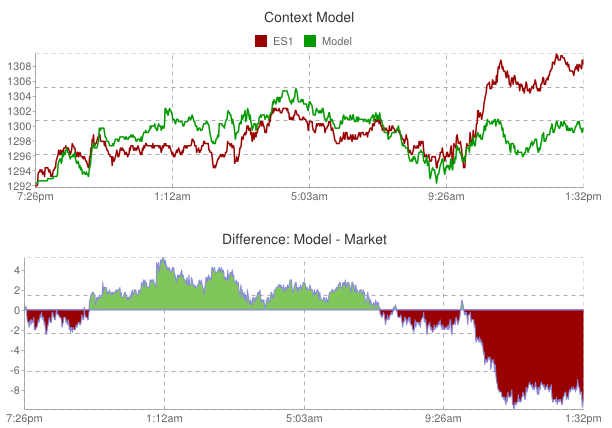
The CONTEXT model is negative with ES outperforming the model, this often happens on bounces, but usually more toward the end. I will say the CONTEXT model looked much more positive last week which makes me wonder if they are tweaking the formula in the model which I have wondered about for a week or so since JPM came out with news that is potentially leading to distortions in the credit markets.

I'll update the market next and I have some stocks coming after.

Risk Asset Layout Update

 Commodities vs the SPX (SPX green) intraday, both are keeping relatively good pace.

 The longer term trend in commodities seems to have been anticipating a move higher in the Euro. The trend higher in commodities also started around the 15th which is the same day we found negative divergences in the $USD (commodity/market positive) and positive divergences in the Euro (commodity/market positive).

 Yields intraday on the 5 year (an excellent leading indicator) are not quite keeping pace in the early afternoon with the SPX, but overall...

 Again around the 15th the trend higher or positive divergence in yields was clear. Note the negative divergence in yields at the May 1 bounce top, this is an excellent leading indicator and suggests more to come in the market on the upside. As mentioned recently, some of these positive divergences are the largest I have seen in the 6 months or so we have been using this layout.


 The $AUD as a carry trade currency is often a good leading indicator as well, although there's some noise in it from events in China, today for the first time $AUD is in sync to the upside with the SPX.

 While the $AUD positive divergence isn't there, we do have confirmation today, longer term though you can see where the $AUD diverged from the SPX and that was the end of the SPX bounce, so once again it tends to be a good leading indicator in the currencies.

 Intraday the Euro and SPX are pretty well aligned, this is the first time in about a week the SPX has been aligned with the Euro which has been more positive over the last week than the SPX.

 A longer view of the Euro/SPX, the Euro is above resistance as it has been carving out what appears to be a short term bottom, but still a respectable one. The SPX is finally responding now that op-ex is past.

 Longer term Euro/SPX action, in green they are in sync or correlation pretty well, the red boxes show Euro negative divergences sending the SPX lower, the white box is the recent positive Euro divergence.

 Energy momentum intraday is falling off a bit vs the SPX momentum.

 Energy intraday vs the Euro (red), the Euro looks a little bit more positive than Energy, which suggests the SPX is more in tune with the Euro intraday.

 However once again the longer term trend in Energy went positive last week around the time the Euro started forming that base-like pattern, the SPX is finally responding.

 Intraday the Financials have fallen off vs the SPX.

 Tech is leading the SPX intraday, which is a good sign as far as expectations for a tech led move go.

 And the trend in Tech momentum vs the SPX, it was certainly much more positive than the SPX on Friday and has shown a much better trend in momentum, again good for the theory of a tech led move and specifically AAPL.

 High Yield Credit hasn't been in a blazing positive divergence, but it has held its ground much better than the SPX, Credit leads, equity follows/confirms. Longer term Credit markets are a mess, short term they look supportive of higher market prices.

 The recent trend in High Yield Credit has been more lateral as the SPX has been down, this overall is part of why I continue to believe in a strong move higher before the next leg lower.

 High Yield Corp. Credit may (like all credit) have some noise due to the JPM debacle, but today HYC Credit (HYG) is leading the market intraday.

 Looking at High Yield Corp. Credit, there's a decent little base and HYC Credit is clearly leading the SPX in a positive divergence.

 As for the major trend in HYC Credit, clearly it is market negative as it has been trending down as the market was topping laterally. This is also a good example of the pendulum-like swings in the market (credit being the example), we see a breakout above the downtrend channel-a head fake move that squeezes Credit shorts and from that we often see the snow ball effect once the head fake unwinds, like we saw in GLD and GOOG as pointed out last night, HYG fell hard and fast to break below the downtrend channel, creating another potential head fake move as shorts jump in on a break below the channel, a move higher in HYG will squeeze those shorts again and give HYG upside momentum (the snow-ball effect). This is why I like channel busters, they often appear to be positive like we first saw with the break above the channel, but any time there's a change in character, there's usually a good opportunity right around the corner.

As for sector rotation from Friday to today, while Financials are leaking lower in to the afternoon, Energy is holding up fairly well, Basic Materials (a risk on sector) has rotated in, Industrials have rotated in strongly, Tech is building steady and Discretionary is maintaining. The Defensive sectors like Utilities, Staples and Healthcare are all rotating out, this looks very indicative of a risk on (bounce) move.