This week just goes to show that the Wall St. market cycles are real (as we've seen for a long time) and that unless it's something incredible that the market had no way of discounting, that it really has very little reaction to geo-political events, although when something does happen and the market moves the talking heads point to that, however when a lot happens and the market does nothing, then it's just ignored.
What I meant above was the F_O_M_C minutes were not positive for the market, we have come to expect the knee jerk reaction and if you watched carefully there were hints of what the market really thought. Today the market widely expected Yellen to dial down the hawkish tone of the minutes, she did not and the market had very little reaction even though many analysts said the market would be very ugly today if she didn't come out full dove (I'd contend that it's because a market cycle was set up w/ the base from 8/1 to 8/8 and the bounce from there and we are now in the reversal process of that bounce as reversals are rarely "V" shaped events, but a process which seems to be long and drawn out on intraday charts, but looks very reasonable in retrospect on a daily chart). I have said many times, "Once Wall St. sets up a cycle, there's very little that can happen that will cause them to abandon it. Note I didn't say a "Rally", I said a cycle which has 4 distinct stages just like the large market cycles: 1) accumulation/base, 2) mark-up/rally, 3) distribution/top and 4) decline.
We identify these stages so we know where we are in a cycle to know what the highest probability is next. I'd say with about 85% surety that we are in the reversal process. I'd normally say we have about a week left in it, however this was a bit more parabolic than usual (almost like a short squeeze even though the MSI didn't put in much of a performance),
the sharper moves tend to have more narrow reversals.
As far as early next week, it was very difficult to glean much from the market and I think that has a lot to do with the same reasons we have had weak signals in the past (intraday-short term in this case), because the trend is lateral, a chop-fest and not conducive to shorter term trades.
However that doesn't mean there isn't a trend to forecast with, it's just on a slightly longer timeframe than what to expect Monday morning.
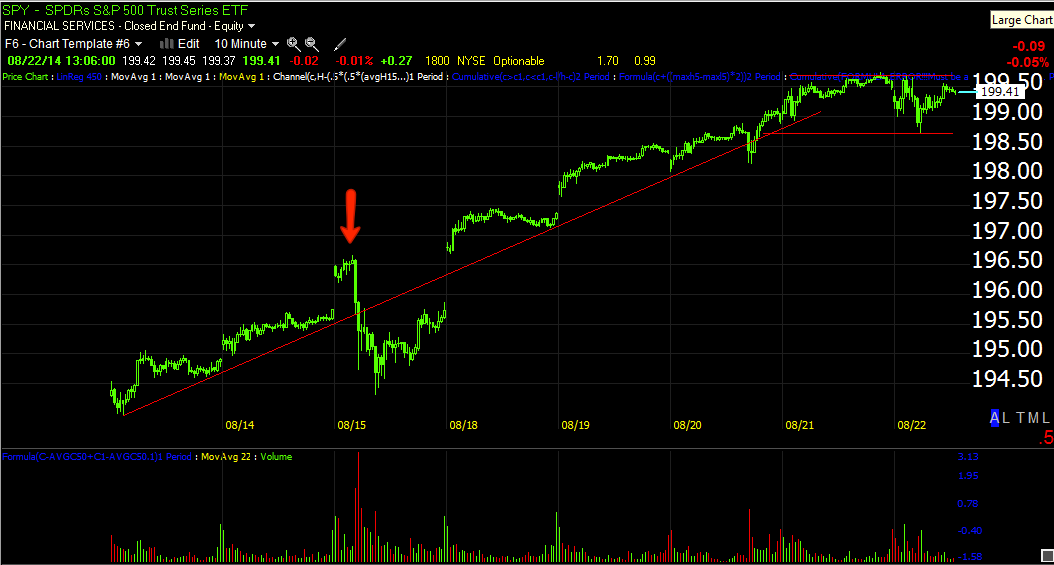
SPY 1 min actually ended the day in leading negative position ( I captured this at 3:08) so perhaps Monday morning will see weakness.
The idea though is to back away from the very same chart and see the trend, it suddenly becomes very clear, but this isn't anything surprising, when I closed FAZ on the first day of base building, my intention was to add it back as XLF crossed above range resistance which it did and I did add FAZ back to the line-up.
Also note the price trend, as they say, "The trend is your friend until the end when it starts to bend", this one is bending which is the reversal process.
While we simply call it the reversal process, it's not something that we just observe in the market, things are going on, there's a reason it exists and it has mostly to do with large positions that take time to move around or switch 180 degrees.
If you look at the trend of the 2 min chart you see something even more interesting and telling. First the divergence at "A" that sent the market lower, this is about when FAZ long was added the last time , then a base, which is where FAZ long was closed on the first day, note the relative price level of SPY at point A and B and then note the relative 3C level at the same 2 points. If nothing had changed in the market's perception 3C would have made an equal high to "A", but it didn't, it made a much lower leading negative divegrence which not only shows distribution in this bounce's trend, but heavier distribution since July.
If you look at the size of the accumulation at the base vs the distribution area, you now know exactly what this Wall St. set up cycle was meant to serve as, and you know what your best opportunity is to use what you have right in front of you.
The larger 5 min trend should be viewed the same way, the distribution/3C level at the July top , the size (small) of the accumulation/base and the current 3C trend not only during the bounce , but vs. the July levels.
Looking on an even longer basis of 15 mins, something starts taking shape and 3C marks the area for you, likely the top for the SPX.
The 30 min chart shows you the same thing at the same place.
The 2 min QQQ trend with last Friday marked in which I expected a couple more days of upside before the reversal process began, you can see in 3C where the chart really falls apart and that's this week, right about Tuesday,
The larger QQQ 15 min chart should be viewed in the same manner as the SPY "A/B" Comparison above as well as the size or amount of accumulation at the base area which is exactly the same date no matter which market average or industry you look at, that's not coincidence.
The IWM (also captured just after 3 p.m.) intraday chart closed a lot more negative than it looks here so again, perhaps that's where we pick up Monday.
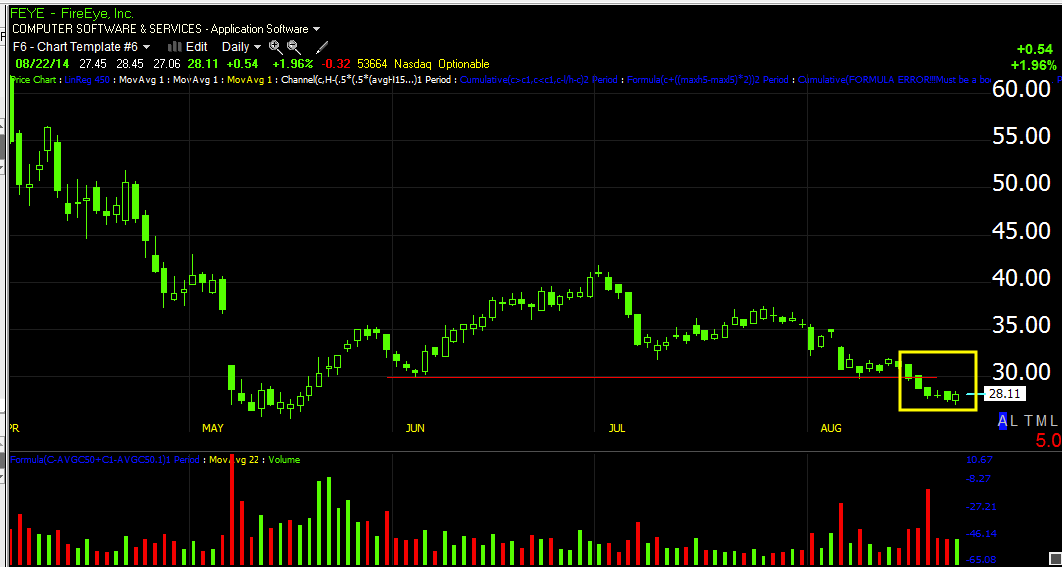
The IWM I believe already has a nearly complete top in place, this move was what I described as a run of the mill correction in the preceding downtrend. This is a long term 60 min chart leading negative through the 9+ month top at new leading negative lows. The yellow arrow points to what I believe will be the next stop after the reversal process is complete.
I've been showing ES's VWAP all week, do you notice anything different about today"s?
This is the first time we've seen VWAP's channel running sideways which is what we expect to see in a reversal process.
As I said earlier, one of the sign posts that we've reached the cycle's target was a pop above XLF's range resistance, the very same area I said I'd add FAZ back on 8/1 - 21 days ago, this is because this is where I believed XLF would move to, it's the area where retail will take action and buy a breakout creating the demand large institutional players need to dump in to.
This daily chart of XLF is a perfect example of the "Understanding the Head Fake" posts linked at the top right side of the member's page. If you understand the concepts, you'll understand why on August 1st I thought it was very high probability that I could close my FAZ long and hold on to 8-9% gains and add FAZ back as XLF crossed above the ranges resistance.
there's a real concept, a real reason that allows us to pretty accurately forecast the target area. I added FAZ back and left about 25% room to add to it, I realize that in a sideways, choppy market that we can see some price spikes that may be better positioning and thus I can add to FAZ,
but I don't think the few extra percent are worth the risk of missing the trade, essentially the risk of not trading my plan.
Here's XLF's3 min chart showing accumulation at 8/1 through 8/8 like all of the averages and a steep 3C leading negative divegrence the moment the demand area of a breakout above XLF's range resistance occurs. The breakout was yesterday, note the leading negative divegrence is the last 2 days.
Here' the 5 min chart and distribution at the end of the range when FAZ was added, then accumulation and FAZ closed on August 1, again,
note where price is relative to the range and note where 3C is relative to the two areas.
On a stronger 10 min chart, note the 3 areas and where price and 3C are at each compared to each other.
Not that we didn't already know what this move was for (remember I elected to keep SRTY and SQQQ even though I knew I'd experience draw-down, but I wanted the bulk of my positions to be aligned with probabilities and hedge the rest using call options),
however, this chart makes the reason for the cycle very clear.
As to why XLf/Financials have been high on my short list, the long term 4 hour chart.
The SPX E-mini futures 60 min chart also makes very clear what has happened during this move...
ES 60 min leading negative divegrence at new leading lows.
You can also see the change in the character of price's trend, the reversal process.
Late in the day it looked like there was an attempt to bang the close, VIX was whacked around 3 p.m. and the Most Shorted Index was pushed in to the close...
The squeeze in the MSI this afternoon had no effect on the close nor did the VIX slam at 3 p.m. I suspect the day's news between Yellen and Draghi was taken much worse than price currently reflects.
Intraday breadth might tell us more about market sentiment on Yellen and Draghi...
At "A" we have a downtrend, after 10 a.m. we have an extreme TICK sell-off reading of more than -1500, I suspect that's the market's true feeling's about Yellen's comments today. At "B" we have the rest between the two and at C Draghi was unable to excite the market either, even with the MSI squeezed and VIX banged, they couldn't get any closing traction.
Expect to see this sentiment in the market (price) soon.
My custom SPY/TICK also shows the same, sell off at Yellen and slight recovery at intermission and sell-off again in to the close as TICK falls negative with more stocks declining than advancing.
Just in case the trend wasn't clear, the SPY is lateral.
For more evidence the market didn't care for what Yellen, who was suppose to be super dovish today according to the pundits, just look at the treasury curve. The yield difference between five- and 30-year T's reached the flattest since 2009. The five-year note yield is more sensitive to investors’ sentiment toward monetary policy than that of longer term debt. The 5 year yield touched a two-week high after Yellen said in her speech that there’s been “considerable progress” in strengthening employment.
I showed you all week what HYG has been doing in 3C and price, here's another look...
HYG not only reverted down to the SPX, but then started leading it lower, a trend I expect to see continue in HYG next week.
TLT outperformed on the day as did VIX futures for most of the day until the smack down in VIX near the last hour of trade.
High Yield Credit (specifically not the manipulative HYG) also was not impressed on the day and sold off.
Don't think of this as credit, think of this as some of the smartest players in the market.
And like yesterday, our Leading Indicator for pro sentiment leads the market negative again today.
There were very few changes in breadth today, but I suppose with the SPX down -.20%, the Dow -.23%, the NDX +0.14%, the Russell 2k +0.01% and Transports +0.01%,
few changes in breadth should be expected.
Those changes that were observable were to the downside, for instance the Percentage of NYSE stocks trading above their 40-day moving average fell from 55.4% yesterday to 53.3% today.
The NASDAQ Composite's Advance/Decline line which is beyond repair looked worse, the Russell 2k's A/D line from July to now is very divergent, as is the Russell 3000's.
The S&P sectors saw only 2 of 9 close green and the Morningstar groups only saw 96 of 239 close green.
The Dominant Price/Volume Relationship was solidly Close Down/ Volume Down which is the predominant relationship seen in a bear market, but has no short term oversold/overbought condition attached to it.
The $USD gained more today and closed up +1.1% on the week, the best in 9 months
Although I want to be more prepared for downside risks right now as this is the larger trade I referenced back when I posted targets and where the 2 pivots for taking action would be, I still expect the concept of the reversal process to play out which means a more lateral trend which could be a rounding type top or the more rectangular or "W" shaped top. EEither way, there's almost always a head fake move (to the upside in this case) right before the downside reversal.
I'd be prepared to not go after too many short term trades as the environment should be more rangebound and choppy, however longer term core positions (mostly short) will be presenting opportunities to enter. As I went through my watch list today I saw many which have deteriorated significantly from earlier in the week, however I also saw quite a few that looked like they needed a few days more,
AAPL was one of the bellwethers for me. This watchlist look-over is yet another reason I think we have several more days in the reversal process.
I'll just warn in advance, they are likely to be dull days unless the character of the reversal process has changed like many other things have since July 1st, as this is the first reversal process other than the base from 8/1 to 8/8 which was also a reversal process, we have seen since July 1.
Thus, I'd be careful abut maintaining patience, while not getting complacent either.
This is one of the hardest balances to strike, patient, yet very diligent and aware in what is otherwise a boring environment.